Part 12 Trading Master Class With Experts Risks in Option Trading
While options can enhance profits, they also carry risks:
Time Decay (Theta Risk) – Options lose value as they near expiration.
Volatility Risk – Sudden drops in volatility can erode option premiums.
Liquidity Risk – Illiquid options may have wide bid-ask spreads, leading to slippage.
Unlimited Loss Potential for Sellers – Writing naked options can result in huge losses.
Complexity – Understanding the interplay of Greeks and pricing models requires skill and experience.
Trade

Part 11 Trading Master Class With Experts Popular Option Trading Strategies
Covered Call – Holding the underlying stock while selling a Call option to earn premium income.
Protective Put – Buying a Put option as insurance against a potential fall in a stock you own.
Straddle – Buying both a Call and Put option at the same strike price and expiry to profit from big price movements in either direction.
Strangle – Similar to a straddle, but using different strike prices to reduce cost.
Iron Condor – Selling a combination of Call and Put spreads to profit from low volatility.
Bull Call Spread – Buying a Call at a lower strike and selling one at a higher strike to reduce premium cost in bullish markets.
Bear Put Spread – Buying a Put at a higher strike and selling another Put at a lower strike to profit from bearish moves.
These strategies allow traders to balance risk and reward based on market outlook.

Part 10 Trade Like InstitutionsWhy Traders Use Options
Options are used for various purposes:
Hedging – To protect portfolios against adverse price movements. For instance, a fund manager holding stocks may buy Put options to limit downside risk.
Speculation – Traders use options to bet on market direction with limited capital.
Income Generation – Writing (selling) options can earn premium income. Covered Call and Cash-Secured Put strategies are popular examples.
Leverage – Options offer exposure to large positions with a small upfront cost.

Part 9 Trading Master Class With ExpertsTypes of Options
Options can be classified in different ways:
Based on Style:
European Options – can only be exercised on the expiry date.
American Options – can be exercised any time before expiry.
Based on Underlying Asset:
Stock Options – based on shares of companies.
Index Options – based on market indices like Nifty or Bank Nifty.
Commodity Options – based on commodities like gold or crude oil.
Currency Options – based on currency pairs like USD/INR.

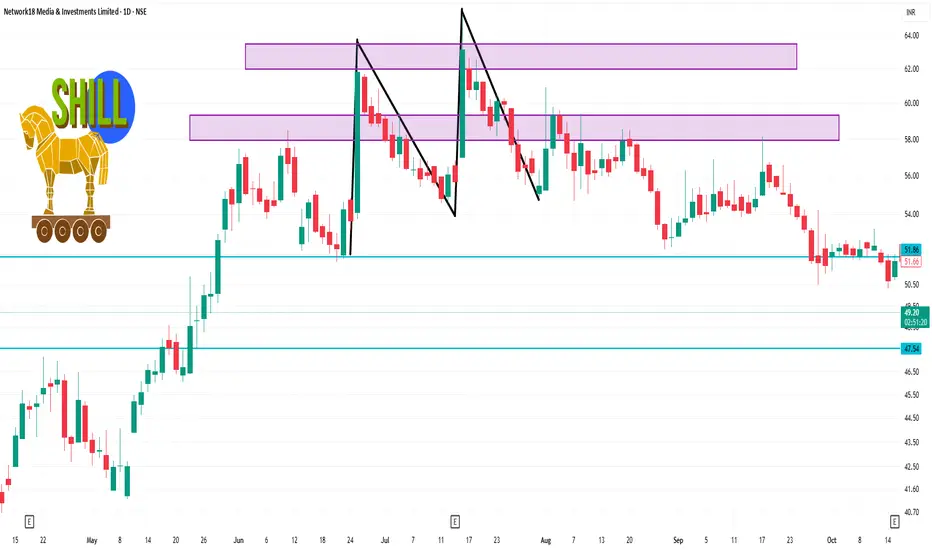
NETWORK18 1 Day Time Frame 📊 Key daily levels to watch
Here are approximate levels based on recent data:
Support: around ₹47.50-₹48.00 region (the near lower band)
Resistance: around ₹50.00-₹52.00 region — a near barrier if the stock tries to bounce.
Pivot/central reference: ~ ₹48.15 (classic pivot) for the day.
📌 Interpretation for a Day Trader
a) If price remains above ~₹48.00 and holds, that level may act as a short-term base.
b) A decisive break above ~₹49.50-₹50.10 with good volume could open a short relief move towards the next resistance zone.
Conversely, a break below ~₹47.50 would signal risk of deeper downside and may invalidate the c) short-term support.
d) Because the trend/indicator setup is weak (daily technicals show “Strong Sell” for daily timeframe), any long trade should be cautious and risk-managed.
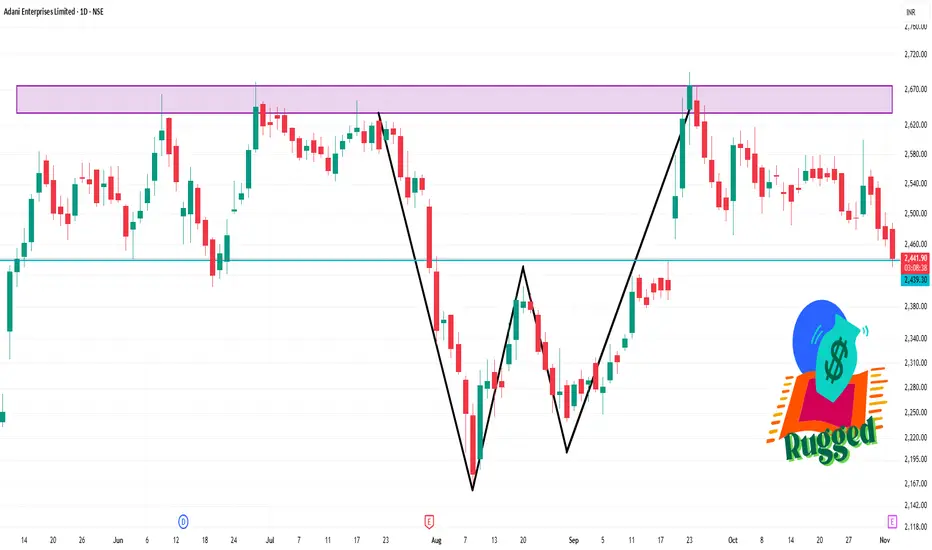
ADANIENT 1 Day Time Frame ✅ Important Levels
From the pivot-point and support/resistance calculations:
Pivot (Classic) ≈ ₹ 2,448.43
Resistance levels: ≈ ₹ 2,466.16 (R1) / ₹ 2,493.93 (R2)
Support levels: ≈ ₹ 2,420.66 (S1) / ₹ 2,402.93 (S2)
🧭 What to watch in the near term
a) If price breaks above ₹2,466-2,493 and holds above, that could shift bias upward and open a test of higher resistance levels.
b) If price slips below ₹2,420-2,402, further downside risk is likely, and next support zones would become relevant.
c) Given the bearish MA structure and weak momentum, the path of least resistance right now appears downward (unless strong buying emerges).
Crypto and Digital Asset Regulations in India (Post-2025)1. Early Phase: From Uncertainty to Recognition
The Indian crypto journey began with skepticism. In 2013, the Reserve Bank of India (RBI) first issued warnings about virtual currencies like Bitcoin, citing risks of volatility, fraud, and lack of legal backing. Between 2017 and 2018, crypto trading volumes surged across Indian exchanges such as ZebPay and CoinDCX, prompting the RBI to impose a banking ban in April 2018. This prohibited regulated entities from providing services to crypto businesses, effectively stalling industry growth.
However, in March 2020, the Supreme Court of India overturned the RBI ban, ruling that it was unconstitutional. This verdict reopened doors for the crypto sector, allowing exchanges to restart operations. This was a landmark judgment that recognized crypto assets as a legitimate digital commodity, though not yet as legal tender.
2. Post-2021 Developments: Regulatory Consolidation
From 2021 onwards, the Indian government and financial regulators started formulating frameworks to oversee the growing digital asset ecosystem. The focus was on taxation, registration, and consumer protection, rather than outright prohibition.
In Budget 2022, the Finance Ministry took a crucial step by introducing a 30% tax on income from Virtual Digital Assets (VDAs). This was a clear signal that the government acknowledged the existence of digital assets but wanted to regulate them stringently. Additionally, a 1% TDS (Tax Deducted at Source) was applied to crypto transactions exceeding ₹10,000, aimed at tracking transactions and ensuring compliance.
While this tax structure made day trading less attractive, it marked a shift from banning to monitoring. The move was followed by exchanges being required to comply with Know Your Customer (KYC) and Anti-Money Laundering (AML) norms, integrating with India’s Financial Intelligence Unit (FIU-IND).
3. The Digital India Context: Blockchain Beyond Crypto
India’s broader Digital India initiative has greatly influenced crypto policy. The government recognizes that blockchain technology — which underpins cryptocurrencies — can revolutionize financial inclusion, supply chain management, and public records.
Projects such as the Central Bank Digital Currency (CBDC), launched by the RBI as the Digital Rupee (e₹) in 2023, have demonstrated India’s willingness to explore regulated digital currencies. The CBDC aims to provide the benefits of digital transactions while maintaining state control over monetary policy.
However, private cryptocurrencies like Bitcoin or Ethereum remain outside the legal tender framework — they can be traded, but not used as official currency.
4. Current Regulatory Structure (Post-2025)
As of post-2025, India’s crypto and digital asset framework revolves around four key pillars:
a) Legal Recognition & Definitions
The Virtual Digital Asset (VDA) category covers cryptocurrencies, NFTs (Non-Fungible Tokens), and certain tokenized assets. They are recognized as digital commodities or property, not as money. The term “crypto currency” is deliberately avoided in official documents to emphasize that these are assets for investment, not currency substitutes.
b) Taxation Framework
30% flat tax on profits from digital asset transfers.
1% TDS on each transaction for monitoring purposes.
No offset of losses between different digital assets or against other income.
Gifts in digital assets are also taxable under existing income tax rules.
This framework discourages speculative trading but supports transparency and record-keeping.
c) Regulatory Bodies
RBI (Reserve Bank of India) – Oversees monetary implications and CBDC operations.
SEBI (Securities and Exchange Board of India) – May regulate tokenized securities or investment contracts.
FIU-IND – Monitors compliance with AML and KYC norms.
Finance Ministry – Leads policy formation and taxation oversight.
d) Exchange & Custody Regulations
Crypto exchanges are now required to:
Register under FIU-IND as “reporting entities.”
Maintain complete transaction and user data for audit purposes.
Ensure compliance with international FATF (Financial Action Task Force) standards.
Implement cold wallet storage and cybersecurity frameworks for asset safety.
5. Investor Protection and Market Discipline
Post-2025, investor protection remains a top priority. Regulators aim to protect retail investors from frauds, Ponzi schemes, and misleading promotions. Exchanges must provide disclosures on risk, volatility, and regulatory uncertainty.
Educational campaigns are being promoted through both government and industry initiatives to help investors differentiate between legitimate projects and scams. The industry also follows self-regulatory codes, inspired by SEBI norms for mutual funds and brokers.
6. India’s Stance on Global Coordination
India has been actively engaging in G20 and FATF discussions to establish global crypto standards. As G20 president in 2023, India pushed for a global regulatory framework to avoid cross-border arbitrage.
In 2025, India’s policies align with the G20-endorsed framework that calls for:
Uniform tax reporting standards (similar to the OECD’s “Crypto-Asset Reporting Framework”).
Common KYC and anti-terrorism financing standards.
Information sharing between nations on suspicious crypto transactions.
This international collaboration helps prevent misuse of crypto for money laundering or terror financing while enabling legitimate innovation.
7. Central Bank Digital Currency (CBDC) – The Digital Rupee
The Digital Rupee (e₹) represents India’s official foray into state-backed digital assets. Issued by the RBI, it functions like a virtual version of the Indian Rupee, ensuring transparency, traceability, and low-cost transfers.
Key features include:
Pilot use in wholesale and retail segments.
Interoperability with UPI and bank apps.
Programmable transactions for specific purposes (like subsidies or government payments).
The CBDC complements rather than competes with private crypto assets — providing a regulated digital payment option backed by sovereign authority.
8. Emerging Trends: Tokenization and DeFi
India’s next wave of digital asset regulation focuses on tokenized real-world assets (RWA) and Decentralized Finance (DeFi). Tokenization allows physical assets such as real estate, art, or bonds to be represented digitally, creating liquidity and transparency.
However, regulators are cautious about DeFi projects due to the anonymity involved. The focus remains on regulated innovation, where blockchain is used under frameworks ensuring identity verification and financial stability.
9. Challenges Ahead
Despite progress, India faces several challenges:
Tax Burden: The 30% tax and 1% TDS discourage active participation.
Lack of Clear Legal Status: Crypto is not illegal, but not officially legal either.
Banking Hesitancy: Some banks remain cautious in offering services to exchanges.
Regulatory Fragmentation: Multiple agencies overlap in jurisdiction, slowing innovation.
Still, the policy direction is moving toward clarity, control, and co-existence.
10. The Road Ahead
Looking beyond 2025, India aims to establish a Comprehensive Digital Asset Regulation Bill that classifies different asset types (utility tokens, security tokens, stablecoins) and provides guidelines for their issuance, trading, and taxation.
The focus will be on:
Integrating blockchain in public infrastructure.
Encouraging innovation in Web3 and fintech startups.
Aligning with global best practices to make India a regulated digital asset hub.
With its young tech-driven population and strong fintech ecosystem, India has the potential to lead in responsible crypto innovation while maintaining financial sovereignty.
Conclusion
Post-2025, India’s crypto and digital asset regulations reflect a measured and pragmatic approach — not anti-crypto, but pro-regulation. The government acknowledges the transformative power of blockchain while safeguarding against financial risks. Through structured taxation, compliance requirements, and global coordination, India is building the foundation for a transparent, secure, and innovation-friendly digital asset ecosystem.
As policies mature, the country’s focus will likely shift from control to collaboration — enabling India to play a leading role in shaping the future of global digital finance.
AI and Data Analytics in Stock Market Decisions1. The Evolution of Stock Market Decision-Making
Traditionally, stock market decisions were made using two major approaches:
Fundamental analysis, which focuses on company performance, earnings, and macroeconomic factors.
Technical analysis, which studies past price and volume patterns to predict future trends.
While both methods remain relevant, they are now enhanced by AI and data analytics. AI can process enormous data sets that humans cannot handle manually, identify hidden correlations, and make decisions based on probabilities rather than assumptions.
The integration of these technologies started with algorithmic trading in the 1990s and has evolved into machine learning-driven trading systems and predictive analytics models in the 21st century.
2. Understanding AI and Data Analytics
Artificial Intelligence (AI) refers to systems that can mimic human intelligence, learn from experience, and make decisions autonomously. In stock trading, AI tools like machine learning (ML), deep learning, and natural language processing (NLP) play vital roles.
Machine Learning (ML): Learns patterns from historical data and applies them to predict future stock price movements.
Deep Learning (DL): Uses neural networks to process large-scale and complex financial data, identifying non-linear relationships.
Natural Language Processing (NLP): Analyzes financial news, social media sentiment, and corporate announcements to gauge market mood.
Data Analytics, on the other hand, involves the collection, cleaning, and analysis of structured and unstructured data to uncover insights. This includes historical price data, earnings reports, economic indicators, and even tweets or headlines.
Together, AI and data analytics form the backbone of quantitative trading, robo-advisory platforms, and automated portfolio management systems.
3. Key Applications of AI and Data Analytics in the Stock Market
a. Predictive Analysis and Price Forecasting
AI models can analyze historical price patterns, volatility, and macroeconomic indicators to forecast short-term and long-term price movements.
For example:
Neural networks detect recurring patterns in stock charts.
Regression models and reinforcement learning algorithms adjust predictions in real time as market conditions change.
b. Sentiment Analysis
NLP-powered tools scan news articles, earnings calls, analyst reports, and social media to measure market sentiment.
A positive sentiment can lead to short-term price surges, while negative buzz can trigger sell-offs. Platforms like Bloomberg and Refinitiv now incorporate AI-based sentiment analytics for traders.
c. Algorithmic and High-Frequency Trading (HFT)
AI-driven algorithmic trading systems execute thousands of trades per second, exploiting minor market inefficiencies.
Algorithms analyze order book data and market microstructure.
AI continuously improves its strategy by learning from past trades.
This minimizes human error and maximizes execution speed and accuracy.
d. Portfolio Management and Robo-Advisors
AI helps investors manage risk and optimize portfolios based on their risk tolerance, investment goals, and market outlook.
Robo-advisors such as Zerodha’s Niyam or international platforms like Betterment and Wealthfront use AI to automatically rebalance portfolios and minimize losses.
e. Fraud Detection and Compliance
AI-powered surveillance systems detect anomalies, such as insider trading, price manipulation, or fraudulent transactions.
Machine learning algorithms monitor trading patterns in real time and alert regulators or brokers to suspicious behavior.
f. Risk Management
AI quantifies risk using predictive models that estimate Value at Risk (VaR), expected shortfall, or drawdown probabilities.
By analyzing correlations and stress scenarios, traders can better prepare for sudden market downturns or black swan events.
4. Role of Big Data in Stock Market Analysis
Modern financial markets produce terabytes of data every day, including:
Price and volume data from multiple exchanges
Corporate filings and earnings reports
Global macroeconomic indicators
Alternative data like satellite images, foot traffic, or credit card transactions
AI and analytics platforms integrate these datasets to extract valuable insights.
For example:
Hedge funds use satellite imagery to estimate retail store performance.
Credit card data is used to forecast quarterly earnings before official reports are released.
This “alternative data revolution” gives institutions an informational edge that traditional analysis cannot provide.
5. Benefits of AI and Data Analytics in Stock Market Decisions
Speed and Efficiency: AI can process millions of data points in seconds, enabling rapid and informed decision-making.
Accuracy: Predictive models reduce human bias and emotional trading.
Automation: Reduces manual analysis and allows automated trade execution.
Risk Reduction: Helps identify potential losses early through predictive risk assessment.
Data-Driven Insights: Converts raw market data into actionable intelligence.
These advantages help both retail traders and institutional investors stay competitive in increasingly complex markets.
6. Limitations and Challenges
Despite their power, AI and analytics tools face several limitations:
Data Quality Issues: Inaccurate or biased data can lead to faulty predictions.
Overfitting: Models that perform well on historical data might fail in live markets due to changing dynamics.
Black Box Problem: Deep learning models often lack interpretability, making it hard to explain why they make certain predictions.
Market Volatility: AI cannot always predict sudden events like geopolitical crises or natural disasters.
Ethical and Regulatory Concerns: Automated trading systems can cause flash crashes or manipulate markets unintentionally.
Hence, while AI enhances decision-making, human oversight remains crucial.
7. The Future of AI in Stock Market Decision-Making
The next phase of financial technology will see even deeper integration of AI, quantum computing, and blockchain in trading ecosystems.
Quantum AI may process financial data exponentially faster, enabling near-instant decision-making.
Explainable AI (XAI) will make algorithms more transparent and trustworthy.
AI-Blockchain integration will ensure secure, auditable, and tamper-proof trading records.
Additionally, personalized AI assistants will help individual investors make smarter decisions based on their unique profiles and preferences.
8. Real-World Examples
JP Morgan’s COiN platform uses AI to review legal documents and extract key data for risk evaluation.
Goldman Sachs’ Marcus employs data analytics for consumer lending and investment recommendations.
Kavout’s Kai Score leverages machine learning to rank stocks based on predictive factors.
Indian brokerages such as Zerodha, Upstox, and ICICI Direct are adopting AI-based tools to help clients identify trading opportunities and manage portfolios efficiently.
9. Conclusion
AI and data analytics have redefined the rules of stock market participation. What was once a game of intuition and experience has now become a science of data, prediction, and automation.
By integrating AI into trading strategies, investors can gain a deeper understanding of market dynamics, identify hidden opportunities, and manage risk with greater precision.
However, successful use of AI in stock market decisions requires a balance between machine intelligence and human judgment. Machines can crunch numbers and identify trends, but human insight, discipline, and adaptability remain irreplaceable.
Ultimately, the collaboration between humans and AI will continue to shape the future of intelligent investing, driving markets toward more efficiency, transparency, and innovation.
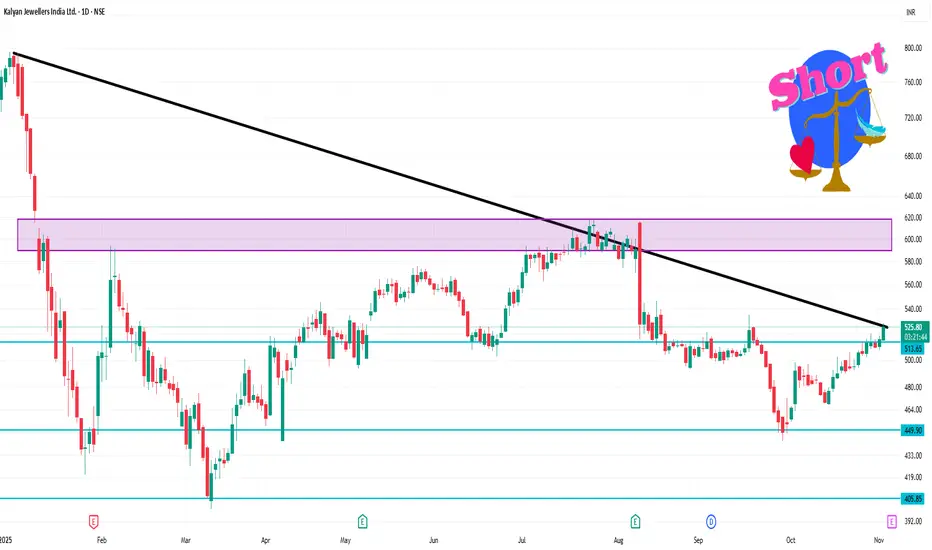
KALYANKJIL 1 Day Time frame✅ Important Levels
Pivot Point (daily): ~ ₹ 514.
Resistance Levels:
R1 ≈ ₹ 519
R2 ≈ ₹ 526
R3 ≈ ₹ 531 and above
Support Levels:
S1 ≈ ₹ 507
S2 ≈ ₹ 502
S3 ≈ ₹ 495 (or slightly below)
Introduction to Indian Financial Markets1. Structure of Indian Financial Markets
The Indian financial market is broadly divided into two segments:
Money Market – Deals with short-term funds (maturity up to one year).
Capital Market – Deals with long-term funds (maturity more than one year).
Each of these segments has multiple sub-markets and instruments designed to cater to specific financial needs.
2. Money Market
The money market provides liquidity for the economy by enabling short-term borrowing and lending. It is crucial for maintaining the stability of financial institutions and ensuring that businesses and the government have access to short-term financing.
Key Instruments of the Money Market:
Treasury Bills (T-Bills): Issued by the Reserve Bank of India (RBI) on behalf of the government for short-term borrowing.
Commercial Papers (CP): Unsecured promissory notes issued by corporations to raise short-term funds.
Certificates of Deposit (CD): Negotiable time deposits issued by commercial banks.
Call and Notice Money: Very short-term loans between banks to manage daily liquidity needs.
Repurchase Agreements (Repo and Reverse Repo): Short-term borrowing/lending against government securities.
The money market in India is regulated by the Reserve Bank of India (RBI), which ensures stability, transparency, and adequate liquidity.
3. Capital Market
The capital market facilitates the raising of long-term capital by companies and governments through the issue of shares, bonds, and other securities. It also provides investors with opportunities to earn returns by investing in these instruments.
The capital market is divided into two segments:
Primary Market: Where new securities are issued (Initial Public Offerings or IPOs).
Secondary Market: Where existing securities are traded (Stock Exchanges).
Major Institutions in the Capital Market:
Stock Exchanges: The two leading stock exchanges are the Bombay Stock Exchange (BSE) and the National Stock Exchange (NSE).
Securities and Exchange Board of India (SEBI): The regulatory authority overseeing capital markets to protect investors and promote fair trading.
Depositories: Institutions like NSDL (National Securities Depository Limited) and CDSL (Central Depository Services Limited) that facilitate electronic holding and transfer of securities.
Key Instruments of the Capital Market:
Equity Shares: Represent ownership in a company.
Debentures and Bonds: Long-term debt instruments.
Mutual Funds: Investment vehicles pooling funds from multiple investors.
Derivatives: Financial contracts like futures and options that derive value from underlying assets.
Exchange-Traded Funds (ETFs): Funds traded on exchanges like stocks.
4. Role of Financial Institutions
A variety of institutions operate within the Indian financial market to ensure smooth functioning and growth:
Banks: The backbone of the financial system, offering deposit, credit, and investment services.
Non-Banking Financial Companies (NBFCs): Provide credit and financial services outside the traditional banking system.
Insurance Companies: Mobilize long-term funds through life and general insurance.
Mutual Funds and Asset Management Companies (AMCs): Provide collective investment options.
Development Financial Institutions (DFIs): Such as NABARD, SIDBI, and EXIM Bank, which support industrial, agricultural, and export financing.
5. Regulatory Framework
The Indian financial market is regulated by several key institutions to maintain transparency, protect investors, and ensure financial stability:
Reserve Bank of India (RBI): Regulates the banking system and money market, controls inflation, and manages monetary policy.
Securities and Exchange Board of India (SEBI): Regulates the capital market and protects investor interests.
Insurance Regulatory and Development Authority of India (IRDAI): Supervises the insurance sector.
Pension Fund Regulatory and Development Authority (PFRDA): Oversees pension funds and the National Pension System (NPS).
Ministry of Finance (MoF): Frames financial policies and oversees public finances.
These institutions collectively ensure that India’s financial markets remain efficient, stable, and globally competitive.
6. Evolution of Indian Financial Markets
India’s financial market has undergone significant transformation over the past few decades:
Pre-Liberalization Era (Before 1991): The market was tightly regulated with limited investment options and government-controlled interest rates.
Post-Liberalization Era (After 1991): Economic reforms introduced free-market mechanisms, liberalized capital inflows, and promoted private sector participation.
Technological Advancements: The introduction of electronic trading, online demat accounts, and real-time settlement systems improved efficiency and transparency.
Global Integration: Increased participation by foreign institutional investors (FIIs) and global listing opportunities expanded India’s financial reach.
Today, India’s financial markets are well-diversified, globally recognized, and supported by a robust technological and regulatory framework.
7. Participants in Indian Financial Markets
The Indian financial ecosystem comprises various participants:
Retail Investors: Individuals investing in shares, mutual funds, and bonds.
Institutional Investors: Entities like mutual funds, insurance companies, pension funds, and banks.
Foreign Investors: Including Foreign Institutional Investors (FIIs) and Foreign Portfolio Investors (FPIs).
Corporate Entities: Raising capital through equity or debt.
Government: Issuing securities to finance public expenditure.
Each participant contributes to market liquidity, depth, and efficiency.
8. Importance of Indian Financial Markets
The financial market plays a crucial role in the nation’s economic framework:
Mobilization of Savings: Channels individual and institutional savings into productive investments.
Efficient Resource Allocation: Ensures funds flow to sectors with higher growth potential.
Capital Formation: Encourages entrepreneurship and industrial expansion.
Price Discovery: Reflects economic trends through demand and supply of securities.
Economic Stability: Helps manage inflation, liquidity, and interest rates.
Wealth Creation: Offers opportunities for individuals and institutions to build financial assets.
9. Challenges Facing Indian Financial Markets
Despite progress, the Indian financial system faces several challenges:
Financial Illiteracy: A large portion of the population remains unaware of investment opportunities.
Regulatory Complexity: Multiple regulators can sometimes lead to overlapping responsibilities.
Market Volatility: Global economic uncertainty affects capital inflows and investor sentiment.
Limited Depth in Bond Market: The corporate bond market remains underdeveloped compared to equity markets.
Technology Risks: Increased digitalization exposes markets to cyber threats.
Efforts are ongoing to address these challenges through reforms, education, and stronger governance.
10. Future of Indian Financial Markets
The future of Indian financial markets looks promising. With initiatives like Digital India, Financial Inclusion (Jan Dhan Yojana), and Unified Payments Interface (UPI), India is building a modern, inclusive, and technology-driven financial system.
The rise of fintech startups, blockchain applications, and AI-driven analytics is expected to enhance transparency, speed, and participation. Moreover, India’s growing middle class and global economic presence are likely to attract more domestic and international investments.
Conclusion
The Indian financial market stands as a cornerstone of the country’s economic engine. From traditional banking to sophisticated capital market instruments, it provides a dynamic platform for growth, investment, and innovation. Supported by strong regulatory institutions like the RBI and SEBI, and driven by technology and globalization, India’s financial markets continue to evolve rapidly.
As India progresses toward becoming a $5 trillion economy, a robust, transparent, and inclusive financial system will remain essential to sustain growth, attract investments, and empower millions of citizens to participate in the nation’s economic journey.
Part 3 Institutional Trading Options as Hedging Tools
One of the main reasons institutions and traders use options is for hedging. For instance:
A portfolio manager can buy put options to protect against a fall in market prices.
A trader can sell covered calls to earn additional income while holding long-term positions.
This risk management function makes options a vital component of modern financial markets.

Part 2 Ride The Big Moves a. Single-Leg Strategies
Buy Call: Used when expecting a sharp rise.
Buy Put: Used when expecting a sharp fall.
Sell Call or Put: Used when expecting low volatility or price stability.
b. Multi-Leg Strategies
Covered Call: Holding a stock and selling a call against it to earn premium income.
Protective Put: Buying a put to hedge against downside risk in a stock position.
Straddle: Buying both a call and a put at the same strike to profit from volatility.
Strangle: Similar to a straddle but with different strike prices.
Bull Call Spread: Buying a lower strike call and selling a higher strike call to reduce cost.
Bear Put Spread: Buying a higher strike put and selling a lower strike put to reduce premium outlay.
These strategies help manage risk-reward ratios, making options suitable for both speculative and hedging purposes.

Part 1 Intraday Tradiing Master ClassTypes of Options
There are two basic types of options:
a. Call Option
A Call Option gives the buyer the right to buy an underlying asset at the strike price before the expiry date.
The buyer of a call expects the price of the asset to rise.
The seller (writer) of a call expects the price to fall or remain stable.
b. Put Option
A Put Option gives the buyer the right to sell an underlying asset at the strike price before expiry.
The buyer of a put expects the asset’s price to fall.
The seller (writer) of a put expects the price to rise or remain stable.

PNB 1 Month Time Frame 📊 Key price data
Latest close: ₹116.94 (approx)
52-week high: ~ ₹120.20
1-month range: roughly ₹112-₹124
🧭 Support & Resistance Levels
Support zone: ~ ₹112-₹114 — recent monthly lows around ₹112.02.
Resistance zone: ~ ₹123-₹124 — recent highs in that band.
Resistance zone: ~ ₹123-₹124 — recent highs in that band.

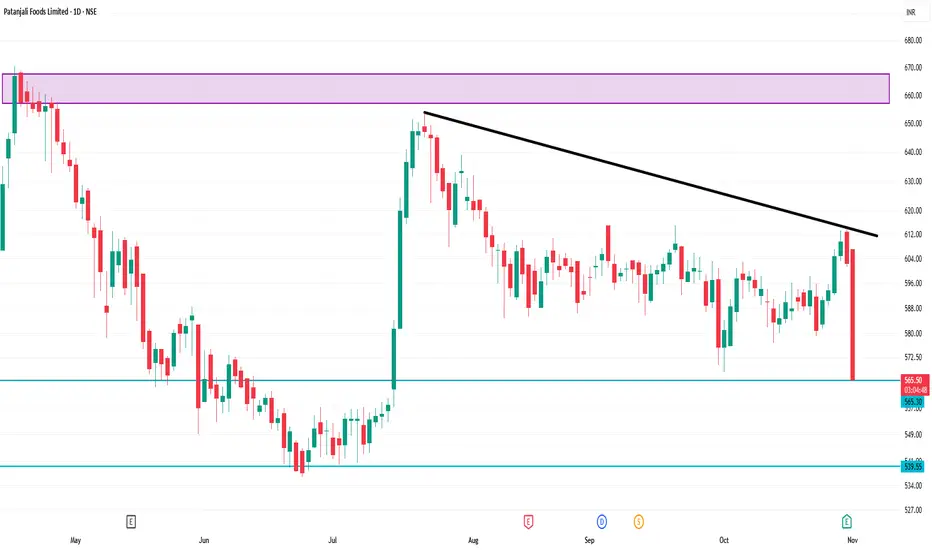
PATANJALI 1 Day Time Frame📊 Key levels to watch
From the “pivot point” data available:
Pivot (approx): ₹ 571.62
First support level: ~ ₹ 562.84
Second support level: ~ ₹ 565.72
First resistance above pivot: ~ ₹ 574.64
Further resistance: ~ ₹ 577.52
So for the day, one might watch roughly ₹ 562-570 as support range and ₹ 574-578 as near-term resistance.
Derivatives and Hedging RisksIntroduction
In modern financial markets, derivatives play a crucial role in managing uncertainty and volatility. A derivative is a financial instrument whose value is derived from an underlying asset such as stocks, commodities, interest rates, currencies, or indices. These instruments are widely used by investors, corporations, and financial institutions to hedge risks, speculate on price movements, and enhance portfolio performance.
Hedging, on the other hand, refers to the practice of reducing or offsetting potential losses from adverse price movements in an asset. Derivatives are the most efficient tools for hedging because they allow traders to take positions that move inversely to their underlying exposures. Together, derivatives and hedging form the backbone of risk management strategies in global financial systems.
Understanding Derivatives
Derivatives are contracts between two or more parties whose value is based on agreed-upon financial variables. These instruments do not necessarily involve the actual buying or selling of the underlying asset. Instead, they function as financial agreements to exchange cash flows or values based on the performance of the underlying asset.
Main Types of Derivatives
Futures Contracts
Futures are standardized agreements traded on exchanges to buy or sell an asset at a predetermined price and date in the future. Futures are used extensively for hedging commodities, currencies, and indices.
Example: A farmer might sell wheat futures to lock in prices before harvest to protect against falling wheat prices.
Forwards Contracts
Forwards are similar to futures but are traded over-the-counter (OTC) and customized to suit the needs of the buyer and seller. Since they are not standardized, they carry higher counterparty risk.
Example: An importer may enter a forward contract to purchase U.S. dollars at a fixed rate three months ahead to guard against currency depreciation.
Options Contracts
Options give the holder the right, but not the obligation, to buy (call option) or sell (put option) an asset at a predetermined price before or on a specific date. Options are flexible instruments for both hedging and speculation.
Example: An investor may buy a put option on a stock to protect against a potential price decline.
Swaps
Swaps involve the exchange of cash flows between parties, often related to interest rates or currencies. The most common types are interest rate swaps and currency swaps.
Example: A company paying variable interest might enter an interest rate swap to exchange its variable payments for fixed ones, reducing exposure to interest rate fluctuations.
Purpose and Importance of Derivatives
Derivatives serve several essential functions in financial markets:
Risk Management (Hedging) – The most important function of derivatives is to mitigate risk. Investors use derivatives to protect against price changes in commodities, currencies, or securities.
Price Discovery – Futures and options markets provide valuable information about future price expectations, helping businesses plan production and investment.
Market Efficiency – Derivatives improve liquidity, allowing for more efficient capital allocation and portfolio diversification.
Leverage and Speculation – They allow investors to take large positions with smaller capital outlays, though this can increase potential losses.
Understanding Hedging
Hedging is a defensive strategy used to offset potential losses in one position by taking another position in a related derivative instrument. The goal is not to generate profit but to minimize uncertainty and protect against adverse movements.
How Hedging Works
The process of hedging typically involves identifying a risk exposure and then selecting an appropriate derivative instrument to counterbalance that risk.
For example:
An airline company concerned about rising fuel costs might use crude oil futures to lock in fuel prices.
A multinational firm expecting payment in euros might use currency forwards to secure the current exchange rate.
By doing so, these entities ensure that fluctuations in market prices do not drastically affect their financial outcomes.
Common Hedging Instruments
Futures and Forwards for Price Risk
Companies use these contracts to fix the buying or selling price of an asset. This reduces uncertainty in cash flows and budgeting.
Options for Downside Protection
Options allow investors to protect against losses while still participating in potential gains. This is often referred to as an “insurance strategy.”
Swaps for Interest Rate and Currency Risk
Swaps are commonly used by corporations to stabilize cash flows and reduce borrowing costs when dealing with fluctuating interest rates or foreign currencies.
Hedging Strategies in Practice
Commodity Hedging
Producers and consumers of commodities such as oil, gold, or wheat use futures and options to stabilize prices and manage inventory risk.
Currency Hedging
Exporters and importers use forward or futures contracts to protect against adverse exchange rate movements. This ensures predictable revenue and cost structures.
Interest Rate Hedging
Financial institutions use interest rate swaps and futures to manage exposure to changing interest rates. For instance, banks with variable-rate assets and liabilities often hedge to maintain stable margins.
Equity Hedging
Investors use options and index futures to protect portfolios from market downturns. A common approach is buying put options on indices to limit losses during a market correction.
Advantages of Using Derivatives for Hedging
Risk Reduction – The primary advantage is minimizing exposure to market volatility.
Cost Efficiency – Derivatives require smaller initial investments than directly buying or selling the underlying asset.
Flexibility – With multiple contract types and structures, hedgers can customize their risk management approach.
Liquidity and Accessibility – Exchange-traded derivatives are liquid and transparent, offering ease of entry and exit.
Risks and Limitations of Derivatives and Hedging
While derivatives are powerful tools, they also carry certain risks that must be carefully managed.
Market Risk – Prices may move unpredictably, resulting in losses even in hedged positions.
Credit (Counterparty) Risk – In OTC contracts like forwards and swaps, there is a risk that one party may default.
Liquidity Risk – Some derivatives may lack buyers or sellers, making it hard to exit positions.
Operational Risk – Errors in execution, settlement, or valuation can lead to losses.
Basis Risk – The hedge and the underlying exposure may not move perfectly in correlation, resulting in imperfect hedges.
Speculative Misuse – Derivatives can be misused for speculative purposes, amplifying losses due to high leverage.
Regulatory Framework and Risk Management
Post the 2008 financial crisis, global regulators emphasized transparency, reporting, and clearing mechanisms for derivatives. Institutions are now required to:
Use central clearinghouses for standardized contracts.
Maintain adequate collateral (margin) to cover exposures.
Conduct regular stress testing and valuation reviews.
These measures aim to reduce systemic risk and ensure that derivatives serve their intended purpose—effective risk mitigation.
Conclusion
Derivatives and hedging together represent the foundation of modern financial risk management. Derivatives provide powerful mechanisms to transfer and manage risk efficiently, while hedging strategies enable investors and corporations to protect themselves from adverse market movements. When used responsibly, derivatives help stabilize earnings, control costs, and improve financial predictability.
However, their complexity demands a deep understanding and disciplined application. Poorly designed or speculative use can lead to severe financial losses, as history has shown. The key to success lies in prudent strategy, robust regulation, and transparent practices. In essence, derivatives and hedging transform uncertainty into opportunity—offering stability in an unpredictable financial world.
Carbon Credit and ESG Trading: A New Era of Sustainable Finance1. Understanding Carbon Credits
A carbon credit represents a permit that allows a company or organization to emit a certain amount of carbon dioxide (CO₂) or other greenhouse gases (GHGs). Typically, one carbon credit equals one metric ton of CO₂ equivalent (CO₂e). The concept emerged from the Kyoto Protocol (1997) and was further refined under the Paris Agreement (2015), both of which aimed to create global mechanisms to reduce emissions.
There are two primary carbon markets:
Compliance Markets: These are regulated by governments or international bodies. Entities are assigned emission caps, and if they exceed them, they must buy carbon credits from others who have reduced emissions below their limits.
Example: The European Union Emissions Trading System (EU ETS) is the world’s largest compliance carbon market.
Voluntary Markets: Here, companies or individuals purchase carbon credits voluntarily to offset their emissions, even if they are not mandated to do so.
Example: A corporation may offset its air travel emissions by investing in reforestation or renewable energy projects.
2. How Carbon Credit Trading Works
The carbon trading system operates under a “cap-and-trade” model:
Cap Setting: A governing body sets a limit (cap) on the total emissions allowed within a specific sector or region.
Allocation: Companies receive or purchase emission allowances.
Trading: Firms that emit less than their allowance can sell their surplus credits to others who exceed their limits.
Verification: Independent auditors verify emission reductions to ensure integrity and transparency.
This market-based approach incentivizes companies to invest in cleaner technologies, as reducing emissions can generate tradable credits and financial rewards.
3. Economic and Environmental Impact
Carbon trading creates an economic value for emission reductions, encouraging innovation in renewable energy, energy efficiency, and carbon capture. It aligns business incentives with environmental outcomes. By putting a price on carbon, it makes pollution a financial liability rather than an external cost.
Globally, the carbon market is expanding rapidly. The EU ETS, China’s National ETS, and California’s Cap-and-Trade Program together cover billions of tons of CO₂ annually. The voluntary carbon market also reached record highs, driven by corporate net-zero commitments and growing environmental awareness among consumers.
4. Challenges in Carbon Trading
Despite its promise, carbon trading faces challenges:
Lack of Standardization: Different countries and organizations follow varied methodologies for measuring and verifying carbon credits.
Greenwashing: Some companies use carbon offsets to appear sustainable without making real emission reductions.
Price Volatility: Carbon credit prices fluctuate due to regulatory changes and market sentiment.
Double Counting: Ensuring that emission reductions are not claimed by multiple parties remains a key concern.
To enhance credibility, organizations like Verra (VCS), Gold Standard, and Climate Action Reserve have established verification frameworks to certify carbon projects and improve transparency.
5. Introduction to ESG Trading
ESG trading refers to the practice of integrating environmental, social, and governance factors into investment decisions and portfolio management. ESG metrics assess how responsibly a company operates and how sustainable its business practices are in the long term.
Environmental factors include carbon emissions, renewable energy use, waste management, and resource conservation.
Social factors cover labor practices, human rights, diversity, and community impact.
Governance factors focus on corporate ethics, board structure, transparency, and compliance.
Investors increasingly view ESG performance as a proxy for risk management and long-term resilience, rather than mere philanthropy.
6. ESG Investing and Market Growth
ESG investing has grown exponentially over the past decade. Global ESG assets surpassed $40 trillion by 2025, reflecting a major shift in capital allocation. Institutional investors, sovereign wealth funds, and retail traders alike are demanding greater accountability and disclosure from companies.
Financial products linked to ESG include:
Green Bonds: Debt instruments financing environmentally friendly projects.
Sustainability-linked Loans: Interest rates tied to ESG performance targets.
ESG ETFs and Mutual Funds: Funds that invest in companies with strong ESG ratings.
Stock exchanges worldwide—such as the London Stock Exchange, Singapore Exchange, and Bombay Stock Exchange (BSE)—now require listed companies to disclose ESG data, ensuring transparency and comparability.
7. Carbon Credit and ESG Trading: The Connection
Carbon credit trading and ESG investing intersect in several ways:
Environmental Metrics: Carbon reduction is a key “E” metric in ESG scoring. Companies active in carbon markets often score higher on environmental performance.
Financial Innovation: ESG funds are increasingly integrating carbon offset credits into their portfolios or partnering with projects that generate verified credits.
Corporate Strategy: Firms that trade or retire carbon credits to offset emissions can strengthen their ESG profiles, attracting sustainable investors.
In essence, carbon trading contributes to quantifiable ESG outcomes, helping corporations demonstrate tangible progress toward net-zero goals.
8. Technological Advancements in Carbon and ESG Markets
Emerging technologies are transforming both carbon and ESG trading:
Blockchain: Ensures transparency and traceability in carbon credit issuance and trading, preventing fraud or double-counting.
AI and Data Analytics: Improve ESG scoring by analyzing vast datasets from sustainability reports, satellite imagery, and social media.
Tokenization: Digital carbon credits (like KlimaDAO and Toucan Protocol) are creating decentralized carbon markets, enabling small investors to participate.
Such innovations enhance accessibility, liquidity, and trust—key pillars for scaling sustainable finance.
9. Global Policy and Regulation
Governments and regulators are increasingly aligning policies to support carbon and ESG markets:
The Paris Agreement (2015) commits nations to limit global warming to below 2°C.
The Task Force on Climate-related Financial Disclosures (TCFD) promotes standardized climate reporting.
The EU Taxonomy defines what qualifies as a sustainable activity, guiding ESG investors.
India’s Perform, Achieve, and Trade (PAT) scheme and Carbon Credit Trading Scheme (CCTS) are local examples encouraging carbon efficiency.
As climate risks become financial risks, central banks and regulators are integrating sustainability criteria into their frameworks.
10. The Future of Carbon and ESG Trading
The future points toward convergence—where carbon markets and ESG frameworks reinforce each other to drive a sustainable economy. Companies with strong ESG credentials will have better access to carbon finance, and carbon-neutral portfolios will become mainstream.
Looking ahead, the focus will shift from offsetting emissions to reducing them at the source. Investors will increasingly demand measurable impact and verified sustainability data, making transparency a competitive advantage. Carbon credit prices are expected to rise as governments tighten emission caps, creating both opportunities and risks for traders and corporations.
Conclusion
Carbon credit and ESG trading represent the twin engines of sustainable capitalism. While carbon credits place a tangible price on environmental impact, ESG trading embeds sustainability into the financial DNA of markets. Together, they redefine how companies measure success—not merely in profit, but in purpose.
As the global economy moves toward decarbonization, those who integrate carbon efficiency and ESG principles early will not only protect the planet but also unlock new financial value in the green economy of the future.

How to Trade Smart with Crypto1. Understand the Crypto Market Fundamentals
Before you can trade smart, you must understand what you’re trading. Cryptocurrencies are decentralized digital assets built on blockchain technology. Bitcoin (BTC), Ethereum (ETH), Solana (SOL), and thousands of others represent different projects, purposes, and technologies.
Key points to understand:
Bitcoin (BTC) is the first and most influential cryptocurrency, often seen as a digital store of value.
Altcoins like Ethereum, Binance Coin, and Cardano serve specific network functions (smart contracts, DeFi, etc.).
Stablecoins (like USDT, USDC) are pegged to fiat currencies and used for liquidity and hedging.
Tokens vs. Coins: Coins operate on their own blockchain (e.g., Bitcoin), while tokens are built on others (e.g., Uniswap token on Ethereum).
Understanding market structure—spot trading, futures, leverage, and decentralized exchanges (DEXs)—helps you make informed decisions rather than emotional ones.
2. Choose a Reliable Exchange and Secure Your Assets
Trading starts with choosing the right exchange. Reputable centralized exchanges like Binance, Coinbase, Kraken, or Bybit offer security, liquidity, and various tools. For advanced users, decentralized exchanges like Uniswap or PancakeSwap provide more control and privacy.
Smart traders prioritize security:
Use hardware wallets (Ledger, Trezor) for long-term storage.
Enable two-factor authentication (2FA) and strong passwords.
Avoid keeping large sums on exchanges; “not your keys, not your coins” is a golden rule.
A smart trader treats cybersecurity as seriously as trading strategy—because one mistake can mean total loss.
3. Learn Market Analysis: Fundamental vs. Technical
Two main forms of analysis drive smart trading: fundamental analysis (FA) and technical analysis (TA).
Fundamental Analysis
FA examines the intrinsic value of a crypto asset. Key factors include:
Project purpose – What problem does it solve?
Team and development – Are the developers credible?
Tokenomics – Supply, demand, and utility.
Adoption and partnerships – Who’s using or supporting it?
For example, Ethereum’s strength comes from its use in decentralized applications and DeFi, while meme coins often lack fundamentals and depend on hype.
Technical Analysis
TA studies price charts and patterns to forecast market behavior. Smart traders use indicators like:
Moving Averages (MA) – Identify trend direction.
Relative Strength Index (RSI) – Detect overbought or oversold conditions.
MACD – Reveal momentum shifts.
Support and Resistance – Predict entry and exit zones.
Combining FA and TA provides a balanced, data-driven approach instead of trading on speculation or emotion.
4. Develop a Clear Trading Strategy
A smart crypto trader never trades blindly. Instead, they follow predefined strategies based on risk appetite and time commitment.
Common strategies include:
a. Day Trading
Frequent trades within a day, taking advantage of volatility. It requires constant monitoring and fast decisions.
b. Swing Trading
Holding positions for days or weeks to capture medium-term price movements. It’s less stressful but demands chart analysis.
c. Scalping
High-frequency trading to profit from small price changes. This needs precision, low fees, and strong emotional control.
d. Position Trading
Long-term strategy based on major trends or fundamental belief in an asset’s future. Often used by Bitcoin or Ethereum holders.
e. Dollar-Cost Averaging (DCA)
Investing a fixed amount periodically regardless of price. It reduces emotional bias and smooths out volatility over time.
Choose a method that fits your lifestyle, time availability, and psychological comfort.
5. Manage Risk Like a Professional
Trading smart is not about maximizing profits—it’s about minimizing losses.
Risk management separates successful traders from gamblers.
Key principles include:
Never risk more than 1–2% of your capital per trade.
Set stop-loss orders to automatically limit downside.
Take-profit targets to secure gains.
Diversify: Don’t put all your money into one coin or project.
Use leverage cautiously: Leverage amplifies both gains and losses.
A disciplined trader thinks in probabilities, not certainties. Even the best setups can fail; risk management ensures you live to trade another day.
6. Keep Emotions in Check
The crypto market is extremely volatile—prices can move 20% in an hour. Greed and fear often drive traders to make impulsive decisions. Smart traders master their emotions by following a system, not feelings.
Avoid:
FOMO (Fear of Missing Out) – Chasing hype can lead to buying tops.
Panic Selling – Dumping assets during dips often locks in losses.
Overtrading – Too many trades increase fees and mistakes.
Build emotional discipline by keeping a trading journal—record why you entered and exited a trade. Reviewing patterns helps you identify emotional triggers.
7. Stay Updated and Adapt
Crypto evolves daily—new technologies, regulations, and narratives emerge constantly. Staying informed gives traders an edge.
Follow:
News platforms like CoinDesk, CoinTelegraph, and Decrypt.
Data tools like CoinMarketCap and Glassnode.
On-chain analytics for wallet movements and whale activity.
Social signals from Twitter, Reddit, and Discord (with caution).
Adaptability is essential. For instance, shifts like Ethereum’s “Merge,” Bitcoin halving cycles, or new layer-2 solutions can drastically impact market sentiment.
8. Understand Market Cycles and Sentiment
Crypto operates in cycles driven by liquidity, investor psychology, and Bitcoin halving events. Typically:
Bull Markets – Optimism and price surges.
Bear Markets – Pessimism, consolidation, and accumulation phases.
Smart traders use tools like the Fear & Greed Index or on-chain metrics (e.g., exchange inflows) to read sentiment and position accordingly. They accumulate during fear and take profits during euphoria—the opposite of the crowd.
9. Embrace Automation and Tools
Smart traders leverage technology:
Trading bots execute automated strategies using algorithms.
Portfolio trackers like CoinStats or Zapper monitor performance.
Alert tools like TradingView notify price movements.
DeFi protocols enable yield generation through staking or liquidity provision.
However, automation requires careful setup. Bots can fail in volatile markets, so human oversight remains critical.
10. Think Long-Term and Build Wealth Sustainably
The smartest crypto traders see the market not just as a casino, but as a wealth-building ecosystem. They combine trading with long-term investing, staking, and diversification across assets like NFTs, DeFi tokens, and Bitcoin.
Principles for long-term success:
Compound your gains instead of withdrawing impulsively.
Learn continuously through books, courses, and communities.
Protect capital—survival is the first step to profitability.
Have patience—crypto rewards those who endure cycles.
Remember: The most successful traders are not those who made one lucky trade but those who consistently manage risk and adapt over time.
Conclusion
Trading smart in crypto is a blend of knowledge, strategy, and discipline. It’s about understanding market behavior, applying data-driven decisions, managing emotions, and protecting capital. While the market offers immense opportunities, it equally demands respect for its volatility and unpredictability.
Smart crypto trading isn’t about predicting every move—it’s about building a system that survives and thrives across all conditions. Whether you’re a beginner or a seasoned trader, the path to success lies in continuous learning, emotional mastery, and a focus on long-term growth rather than short-term greed.
In the ever-changing world of digital assets, remember this timeless rule:
Trade with logic, not emotion. Plan every move, and let patience and discipline guide your profits.
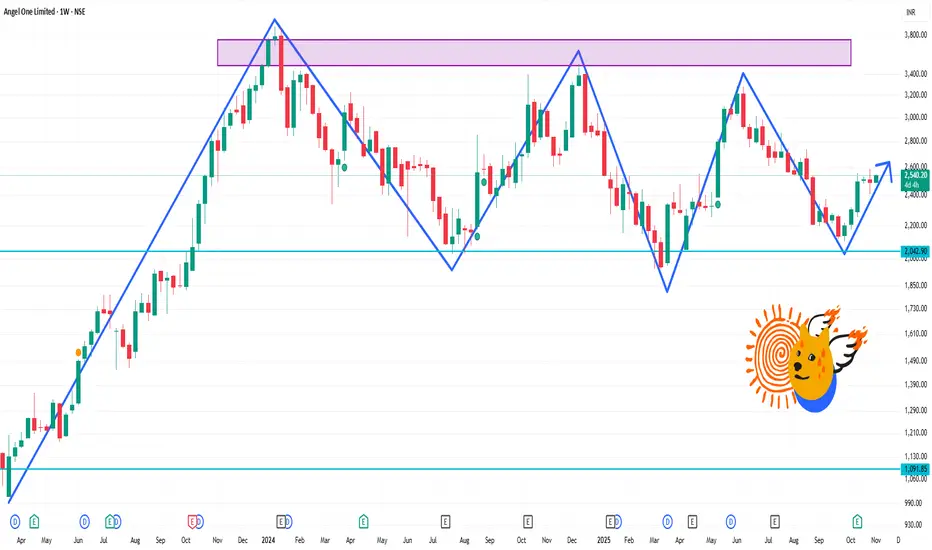
ANGELONE 1 Week Time FrameCurrent price ≈ ₹2,514.50.
Support zone: ~ ₹2,450-2,480
Resistance / near term ceiling: ~ ₹2,560-2,600
If momentum builds: breakout above ~ ₹2,600 could target ~ ₹2,650-2,700
On weakness: below ~ ₹2,450, watch for a move toward ~ ₹2,400
Part 1 Support and Resistance Introduction to Options
Option trading is one of the most powerful and flexible instruments in the financial markets. It allows traders and investors to speculate, hedge, or enhance returns with limited risk. Simply put, an option is a contract that gives the buyer the right, but not the obligation, to buy or sell an underlying asset (like a stock, index, or commodity) at a predetermined price (strike price) before or on a specific date (expiry date).
Unlike shares, which represent ownership in a company, an option is a derivative instrument — its value is derived from the price of an underlying asset. Options are widely traded in stock markets, especially on exchanges like the NSE (National Stock Exchange) in India and NYSE/NASDAQ in the U.S.

LiamTrading - $XAUUSD$: Second Scenario – BUY UP Priority ...LiamTrading - OANDA:XAUUSD $: Second Scenario – BUY UP Priority After BREAKING RESISTANCE $4002$
With the Support of the US Treasury Secretary
Hello traders community, LiamTrading is back with detailed OANDA:XAUUSD $ analysis for the start of the week!
The Gold market is receiving strong support from policy: US Treasury Secretary Scott Bessent calls on the Fed to continue cutting interest rates as the PCE inflation is currently at $2.7\%$.
This call, aimed at reducing mortgage rates and supporting the housing market, strengthens the long-term outlook for Gold.
Technical Analysis: We prioritize continuing to buy up following the main trend. The best strategy is to enter orders at strong resistance/support zones to ensure the lowest risk.
📰 MACRO FUNDAMENTALS: CALL FOR RATE CUT
Impact: The Treasury Secretary's statement on cutting interest rates to support the "transitioning" economy increases expectations of policy easing, which is a strong support factor for Gold (although not yet an official decision).
Suitable Strategy: Market sentiment is being driven by expectations of easing policy, reinforcing the priority for a BUY (Long) position.
📊 TECHNICAL ANALYSIS: IMPORTANT PIVOT POINT
Resistance Zone $4002$: This area acts as an important pivot point.
Buy Entry will be triggered after the price breaks resistance $4002$ and retests.
Sell Entry: Look for short-term scalping at the resistance zone $4030$ to secure profits. Highlighted Zone: Prioritize entering orders at confirmed Trendline zones.
🎯 DETAILED TRADING PLAN (ACTION PLAN)
We will wait for Gold to break structure and create a BUY setup.
🟢 Main BUY Scenario (BUY Break & Retest)
Logic: Buy at $4002$ after breaking resistance and retesting, leveraging new upward momentum.
Entry (BUY): $4002$
SL: $3995$ (tight SL)
TP1/TP2: $4020$ | $4035$
TP3: $4070$
🔴 SELL Scalping Scenario
Logic: Short-term scalping at the strong resistance zone $4030$ (near Sell Liquidity zone).
Entry (SELL): $4030$
SL: $4038$
TP1/TP2: $4015$ | $4004$
TP3: $3990$
📌 SUMMARY & DISCIPLINE (Liam's Note)
Our BUY strategy is reinforced by policy outlook and technical break at $4002$. Strictly adhere to SL $3995$ to manage risk before the upward structure is confirmed.
Are you ready for Gold's movement at $4002$? Please LIKE and COMMENT!

LiamTrading - $XAUUSD$: NEW WEEK TRADING SCENARIO...LiamTrading - OANDA:XAUUSD $: NEW WEEK TRADING SCENARIO – PRIORITISE SELLING After BREAKING THE TRENDLINE
Hello traders community,
The new week opens with a clear strategy: Prioritise SELLING after Gold has broken the previous upward trendline.
Although fundamental economic news (like interest rate policies and politics) supports Gold potentially reaching the $5,000$ USD mark, we must trade according to the current Price Action. The technical selling pressure is strong. We will SELL at key resistance zones and continue SELLING as the price breaks the downward structure.
📰 FUNDAMENTALS & LONG-TERM OUTLOOK
$5,000$ Prospect: Fundamental and political factors continue to support the scenario of Gold reaching $5,000$ USD in the long term (due to geopolitical risks and potential loss of Fed independence).
Short Term 🔴: Gold is under technical selling pressure after breaking through the $4,000$ USD mark.
📊 TECHNICAL ANALYSIS: TRENDLINE BREAK
Structure: Gold has exited the upward price channel and is retesting the broken trendline.
Priority: SELL at the retest resistance zone $4024$.
🎯 DETAILED TRADING PLAN (ACTION PLAN)
🔴 SELL Scenario (SELL Primary) - Preemptive Resistance
Entry 1: $4024$ (Sell retest trendline zone)
SL: $4032$
TP1/TP2: $4012$ | $4000$
TP3: $3989$
Entry 2 (Continuation SELL): When price breaks the next trendline at $3992$
SL: $4000$
TP: $3940$
🟢 BUY Scenario (BUY Reversal) - Buy at Strong Support
Logic: Only buy when price hits strong liquidity support, potential for a short-term rebound.
Entry (BUY): Around $3960$ (Buy Scalping Zone)
SL: $3954$
TP1/TP2: $3972$ | $3988 FWB:TP3 : $4000$
📌 SUMMARY & DISCIPLINE (Liam's Note) Don't let the $5,000$ USD prospect affect short-term risk management. Trade according to Price Action. Adhere to SL and prioritise SELL positions at resistance zones.
Are you ready for the SELL strategy at the start of this week?
