Is it still possible to adjust to 2435 and 2450 beats per minuteAnalysis of the gold trend in the Europe - America session on August 22, 2024:
The analysis from yesterday was completely accurate as gold has confirmed the current peak at 2531. The deep correction trend continues, albeit slowly, due to political situations and investor sentiment. Today, there will be news affecting USD and GOLD, leading to the possibility of establishing new peaks before further adjustments.
The trading trend for today is SELL.
Key price areas to watch:
SELL zone: 2517 - 2523, 2525 - 2527, and 2538 - 2541.
BUY zone: 2500 - 2503 and 2494 - 2497.
Recommended orders:
Plan 1: SELL XAUUSD zone 2517 - 2519
SL 2523
TP 2514 - 2505 - 2495 - 2450.
Plan 2: SELL XAUUSD zone 2525 - 2527
SL 2531
TP 2520 - 2510 - 2500 - 2450.
Plan 3: BUY XAUUSD zone 2500 - 2502
SL 2496
TP 2507 - 2515 - 2520.
Traderchamp

XRP USD seems bullish for long termIt seems nice o prtunity to grab long move with minimum risk.
It is good opertunity for swing traders .

EURUSD Great Opertunity for short selllers......As seeing this chart pattern there is great opertunity and Good risk to reward ratio for sellers.
We can expect good volume and quick moves at this range.
Good opertunity to involve in this trade .

XRU USD COULD SEE BULLISH MOVEMENTUM .At this level we can grab big move. We could suppose this level is good to buy at this level.
This level are imp for day trading.

TANLA: Bullish Momentum Resumes After ConsolidationTANLA has exhibited a robust upward movement, marked by a significant upside followed by a consolidation phase lasting a few days. The current price action suggests a renewed bullish momentum as the stock emerges from the consolidation zone.
Key Points:
1.Strong Historical Performance: TANLA has a history of delivering strong upside moves,
indicating its potential for substantial price appreciation.
2.Consolidation Breakout: After a brief consolidation period, TANLA is now breaking out of the
consolidation zone. This breakout often signifies the resumption of an upward trend.
3.Volume Confirmation: The positive price movement is supported by a notable increase in
trading volume on positive candlesticks. This volume confirmation enhances the reliability
of the bullish signal.
4.Swing Trade Opportunity: Given the recent price action and volume trends, TANLA appears
well-suited for a swing trade. Swing traders can capitalize on short to medium-term price
fluctuations, aiming to profit from the anticipated upward movement.
It's important for traders to conduct their own technical analysis, set appropriate stop-loss levels, and consider other relevant factors before entering any trade.
This content should not be considered as investment advice. Trading involves risks, and past performance is not indicative of future results.

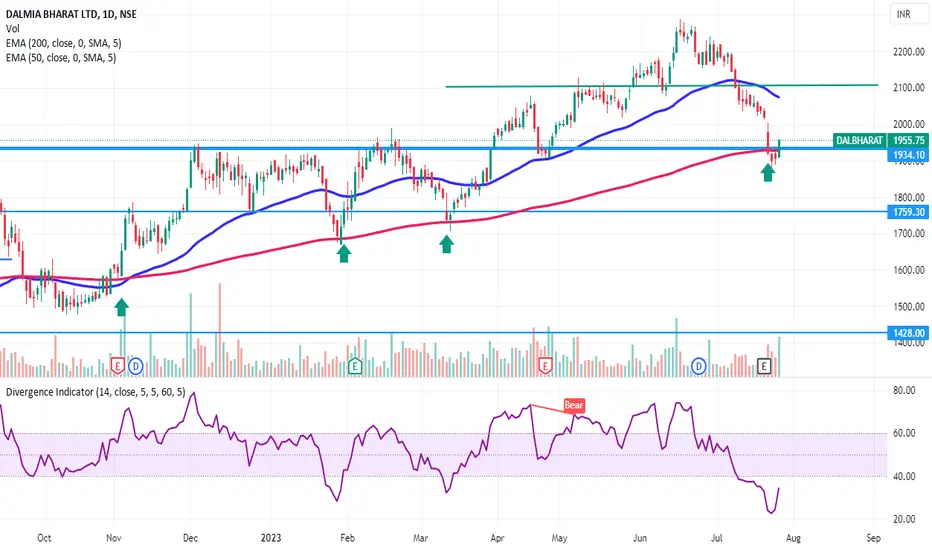
Dalmia bharat a Very High Probability Trade ideaA Very High probability trade of Dalmia Bharat. Long between 1945-1955 for the first target of 2110 & 2250 with SL of 1900. As per the price action pattern we have seen, Whenever stock has touched the 200 EMA the same will bounce back from the level with increased volumes. Watch the levels of the stock in the coming days. This is for your educational purpose only.
BANKNIFTY 1DAY banknifty also breaks all time high ..weekly close above the top line so strong buy coming days... and upcoming target above

19 July Nifty Prediction based on Multiple AnylysisNSE:NIFTY
As we can see in the chart at 45 minutes time frame, Market took support at 15864 and gone up by almost 100 points and in the process forming a W pattern.
If the market Opens flat and starts going up based on the candlestick pattern and breaches 16070 we can take at the money CE for a target of 16,150.
If because of any news the market starts going down we can take a PE only if the market breaks 15864.

Hemostemix has terminated the settlement agreement (OTCQB: HMTXFThe hemostemix and aspire health science interdependence settlement agreement has now been completed, permitting managers to concentrate on strategic business development efforts
