Price Action vs. Indicators: Which Strategy is Better?Price Action vs. Indicators: Which One Works Better?
Hello everyone! I hope you're all doing great in life and in your trading journey. Today, I bring an educational post on a widely debated topic in the trading community— Price Action vs. Indicators . Some traders swear by naked charts , while others rely on technical indicators for trade decisions. But which one is better? Let’s break it down!
Price Action vs. Indicators: Key Differences
Trading Approach:
Price Action Traders analyze candlestick patterns, trendlines, support & resistance without using indicators.
Indicator Traders use tools like RSI, MACD, Moving Averages to identify trade setups.
Speed & Responsiveness:
Price Action provides real-time signals based on raw market movements.
Indicators are often lagging , meaning they react after the move has started.
Simplicity vs. Confirmation:
Price Action is clean and simple , but requires deep understanding.
Indicators offer confirmation but can clutter charts if overused.
Market Adaptability:
Price Action adapts well to all market conditions .
Indicators can be less effective in ranging or choppy markets .
Who Uses It?
Scalpers & Intraday Traders prefer price action for quick decisions .
Swing & Position Traders often combine indicators with price action for confirmation.
Which One Should You Choose?
✔ Use Price Action if: You prefer a clean chart and want to react directly to price movement.
✔ Use Indicators if: You like structured trading signals and need extra confirmation.
✔ Hybrid Approach: Many traders combine both methods for better accuracy—price action for direction, indicators for entry signals.
Outcome:
Both Price Action and Indicators have their strengths. The key is to find what suits your style, test strategies, and stay consistent.
What’s your favorite trading method? Price Action, Indicators, or Both? Share your thoughts in the comments!
Trading!

Identical patterns in Godfrey Phillips and Swan EnergyI showcase two identical patterns in Godfrey Phillips and Swan Energy in this video. I had previously traded Swan Energy, and because I journal my trades, I remembered its price action when I spotted the same setup in Godfrey Phillips.
This is the power of journaling! By maintaining a trading journal, you track your profits and losses and improve your ability to recognize repeating patterns and backtest data effectively.
Do you maintain a trading journal? Let me know in the comments!

Bull Market vs. Bear Market: How to Trade Both Successfully!Bull Market vs. Bear Market: How to Trade Both Successfully!
Hello everyone! I hope you're all doing great in life and in your trading journey. Today, I bring an educational post on Bull Market vs. Bear Market —two crucial phases that every trader and investor must understand. Whether the market is rising or falling, having a strategy for both conditions is essential for success. Let’s break down the key differences, trading strategies, and opportunities in each market!
Bull Market vs. Bear Market: Key Differences
Market Direction:
Bull Market → A period when stock prices rise consistently , reflecting strong economic growth and investor confidence. Demand is higher than supply, pushing stock prices upward.
Bear Market → A period when stock prices fall continuously , usually due to economic downturns, high inflation, or external shocks. Fear dominates, and investors pull money out of the markets.
Trader & Investor Sentiment:
Bull Market → Optimism is high, and traders are willing to take more risks . Investors have a buy-and-hold mentality , expecting further gains.
Bear Market → Pessimism dominates, leading to panic selling . Investors focus on preserving capital instead of taking risks.
Risk & Reward:
Bull Market → Higher rewards , as most stocks trend upward. Corrections are usually short-lived, allowing traders to capitalize on price increases.
Bear Market → Higher risk , as market volatility increases. Stocks tend to fall sharply, leading to heavy losses for uninformed traders .
Strategy & Approach:
Bull Market Trading → Traders focus on momentum stocks, breakouts, and uptrend confirmations .
Bear Market Trading → Traders look for short-selling opportunities, hedging strategies, and defensive stocks .
Opportunities in Each Market:
Bull Market → Growth stocks, tech stocks, IPOs, and high-risk assets thrive in bull markets.
Bear Market → Defensive sectors like FMCG, Pharma, Gold, and Bonds perform well.
How to Trade in a Bull Market?
✔ Follow the Trend: Buy on dips near support levels and stay in the trade until the trend reverses.
✔ Use Momentum Indicators: RSI, MACD, and Moving Averages help in identifying strong uptrends and overbought conditions.
✔ Focus on Growth Stocks: Tech stocks, finance, and emerging market stocks tend to perform well in a bull market.
✔ Avoid Shorting the Market: Short trades have lower success rates in strong uptrends. Stick with trend-following strategies .
✔ Stay Invested Longer: A long-term buy-and-hold strategy is beneficial in bull markets as prices continue rising.
How to Trade in a Bear Market?
✔ Short-Selling Opportunities: Stocks with weak fundamentals fall harder during a bear market, creating opportunities for short trades.
✔ Look for Safe-Haven Assets: Gold, government bonds, and defensive stocks (FMCG, healthcare) tend to hold value.
✔ Use Stop-Loss & Position Sizing: Volatility increases in bear markets, making risk management crucial.
✔ Hedge Your Portfolio: Options strategies like put options, covered calls, and inverse ETFs can help protect investments.
✔ Wait for Signs of Reversal: Don't rush into trades—look for market bottom confirmations using volume, RSI divergence, and trendline breaks .
Outcome:
Both Bull and Bear Markets present profitable opportunities, but having the right strategy for each condition is key to success.
Which market do you find easier to trade— Bull or Bear? Let me know in the comments!

GOLD HITS NEW ATH – IS $3000 THE NEXT TARGET? 📊 Market Overview:
Gold continues to break all-time highs, currently trading around $2930 - $2932. Despite a temporary pause at this resistance level, geopolitical uncertainty and economic conditions suggest that gold could soon reach the psychological $3000 mark.
📈 Technical Analysis & Market Sentiment
Yesterday, gold printed a strong Marubozu candle, rallying from $2853 to $2910, confirming strong bullish momentum.
Today, the price continues its uptrend, climbing from $2910 to $2932, indicating that buyers remain in full control.
Selling at this stage is risky, as price keeps breaking resistance zones.
A potential reversal will require strong bearish signals from both technical indicators and major fundamental news.
📍 Key Levels to Watch
🚀 Resistance Zones (FE - Fibonacci Extensions) for Short Setups:
🔹 2938 - 2945 - 2956 - 2972 - 2983 - 2990
📉 Support Zones for Buy Setups:
🔻 2918 - 2908 - 2896 - 2880 - 2858
📊 Trading Plan for Today
🟢 BUY SCALP: 2908 - 2906
📍 SL: 2902
🎯 TP: 2912 - 2915 - 2918 - 2922 - 2926 - 2930
🟩 BUY ZONE: 2883 - 2885
📍 SL: 2878
🎯 TP: 2888 - 2892 - 2896 - 2900 - 2905 - 2910
🔴 SELL SCALP: 2945 - 2947
📍 SL: 2950
🎯 TP: 2940 - 2935 - 2930 - 2925
🔻 SELL ZONE: 2982 - 2984
📍 SL: 2988
🎯 TP: 2978 - 2975 - 2970 - 2965 - 2960 - 2955
📌 Risk Management & Market Insights
✔ Follow TP/SL levels to protect your capital.
✔ Buy setups are preferred for now, but unexpected sell-offs could happen.
✔ Join our community for real-time updates and trade signals.
📩 Follow for the latest gold analysis and trading strategies! 🚀
💬 Will gold reach $3000? Share your thoughts in the comments! 🔥

Nifty 50 | Head &Shoulders Pattern – A Breakdown Ahead?Hello everyone! I hope you all are doing great in life and in your trading . Today, I have brought an in-depth analysis of Nifty 50, focusing on a powerful Head & Shoulders pattern that is currently forming on the charts. This pattern is known for signaling a bearish reversal, which increases Supply in the market pushing prices downside. If this pattern plays out as expected, we could witness a strong Downside move in the coming sessions.
Currently nifty is trading at 23,340 levels Where previously buyers had shown interest pushing the market gap up following this pattern is selling pressure these buyers could Exit their position Pushing prices to 23,232 (Target 2) and 23,134 (Target 3).
Disclaimer:-This analysis is for educational purposes only. Please trade responsibly and consult a financial advisor before making any decisions.
If you found this analysis helpful, don’t forget to like, follow, and share your thoughts in the comments below! Your support keeps me motivated to share more insights. Let’s grow and learn together—happy trading!

BTC#14: Bitcoin Is Resurgent? Bulls Are Back or Just a Scam?💎 💎 💎 As analyzed in the previous article, BTC tested the trendline and then turned down. However, the price did not fall too much and we saw a recovery. Let's plan BINANCE:BTCUSDT the next trade 💎 💎 💎
1️⃣ **Fundamental analysis:**
📊 The US dollar index DXY is up more than 0.50% on the day and is currently at 108.40; US regulators are piloting tokenization, using stablecoins as collateral.
🔹The Texas Bitcoin Reserve Act has been submitted to the Senate Finance Committee for consideration;
🔹US Senator from Florida proposes Bitcoin investment bill.
🔹 New bill in Montana, USA allows investment of up to $50 million in Bitcoin;
🚀 Standard Chartered Bank: Bitcoin expected to break record high as US Treasury market environment is favorable for digital assets.
📌 Overall policy implications for Bitcoin have restored optimism to the market.
2️⃣ **Technical analysis:**
🔹 **D Frame**: A green pinbar appeared at the end of the week, bringing positive signals to the market. The current price line is also supportive as the price breaks above the candle wick top.
🔹 **H4 frame**: Although the downtrend has not been broken, the 96K area is still acting as an important support zone. 2 pinbars are a clear sign that we will see a recovery for BINANCE:BTCUSD
🔹 **H1 frame**: The temporary downtrend price structure has been broken. However, the resistance zone of 98k - 100k is also very close.
3️⃣ **Trading plan:*
⛔ The current SW zone has been maintained for quite a long time. We will need to wait for clarity on the price line because the downtrend price structure in the H4 frame has not been broken yet
✅ Currently, looking at the positive price reaction for this area, the market is leaning more towards the bulls. However, establishing a BUY position at this time is riskier. We can wait for the price structure as on the H1 chart to choose a position.
💪 **Good luck trading!**

XAU#14:Payrolls Fall,Inflation Rises– Should You Invest in Gold?💎 💎 💎 The market is volatile! The Fed has not cut interest rates, but inflation expectations are soaring. Is this a golden time to invest in FOREXCOM:XAUUSD , or are there still potential risks? 💎 💎 💎
⏳ Opportunity or trap? Let's plan for OANDA:XAUUSD , let's do it!!! 🚀
1️⃣ **Fundamental analysis:**
📊 Employment: Non-farm payrolls increased by 143,000, lower than the forecast of 170,000 and the lowest level since October 2023. However, the unemployment rate fell to 4.0%, the lowest since May 2023.
📌😂Fed policy: The Fed is in no hurry to cut interest rates. A cut in June is possible if inflation continues to cool and the labor market remains stable.
🚀 US one-year inflation expectations rose to their highest level since November 2023. This is only the fifth time in 14 years that we have seen such a large increase (one percentage point or more) in inflation expectations for the coming year in a single month.
✅️ In short, the market is still waiting for a clearer signal from inflation and subsequent data. In the short term, gold prices may fluctuate with a large amplitude, waiting for more CPI data and statements from the Fed to have a clearer trend.
2️⃣ **Technical analysis:**
🔹 **Frame D**: Friday evening's candle closed as a Shooting star candlestick pattern, giving us a little warning of a correction. However, looking at the W candle, it could also be just a profit-taking move of BUY positions when the market closes at the end of the week.
🔹 **H4 frame**: In this time frame, we can see a pinbar appearing when it has just passed the old peak, showing that the market needs a better momentum to conquer the new price level
🔹 **H1 frame**: The bullish price structure reappears when the price passes 2870, but we still have to wait for confirmation at the trendline support area.
3️⃣ **Trading plan:**
⛔ The conflict in basic information data over the weekend is clearly reflected in the price line. At the moment, we should wait for price reaction at important support areas to establish positions.
✅ Looking at the price line, the old peak area has been rejected and there is a high possibility that we will have a slight correction to gain momentum to move to a higher price zone. The end of the W candle shows that the uptrend of Gold has not shown any signs of ending. Prioritize trading in line with the main trend.
💪🚀 **Wishing you successful trading!**

Trading vs. Investing: Which Strategy Suits You Best?Trading vs. Investing: Which One is Right for You?
Hello everyone! I hope you're all doing great in life and in your trading journey. Today, I am bringing an educational post on Trading vs. Investing , two different approaches to making money in the stock market. While both have their advantages, choosing the right one depends on your goals, risk appetite, and strategy . Let’s dive into the key differences and find out which style suits you best!
Trading vs. Investing: Key Differences
Time Horizon:
Traders aim for short-term profits , holding positions for minutes, hours, or days .
Investors hold stocks for months or years , focusing on long-term wealth creation .
Strategy & Approach:
Traders rely on technical analysis, charts, and price patterns to make quick decisions .
Investors focus on fundamental analysis , looking at company earnings, management, and growth potential .
Risk & Reward:
Trading is high risk but can offer quick returns if executed well.
Investing involves lower short-term risk but requires patience for long-term gains .
Capital & Leverage:
Traders often use margin and leverage to amplify gains (but also risk higher losses ).
Investors generally avoid leverage , focusing on steady capital appreciation .
Emotional Discipline:
Trading requires quick decision-making and emotional control to handle volatility .
Investing demands patience and the ability to ignore short-term market fluctuations .
Who Should Choose What?
✔ Choose Trading if: You prefer fast decision-making, market analysis, and short-term gains .
✔ Choose Investing if: You have patience, believe in long-term wealth building, and prefer lower risk .
✔ Hybrid Approach: Many successful market participants combine both strategies , trading for short-term profits and investing for long-term growth .
Outcome:
Both trading and investing have their place in the market. There’s no one-size-fits-all approach —the key is understanding your risk tolerance, time commitment, and financial goals .
Which one do you prefer? Trading, Investing, or Both? Let me know in the comments!

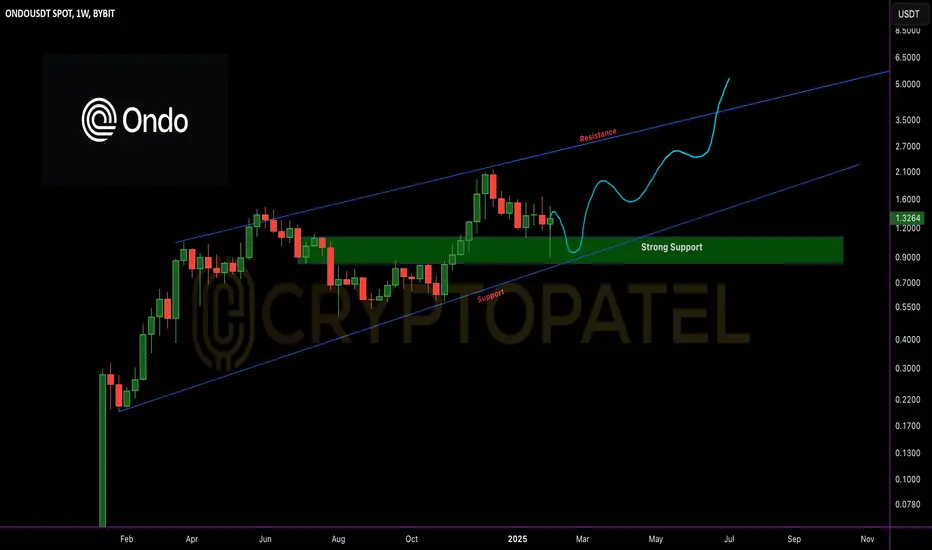
$ONDO $10 Potential in Current bull Market so What Best Entry?CRYPTOCAP:ONDO to $5 is HIGHLY PROBABLE this bull run.
$10? Possible. But $5 looks like a SAFE TARGET. 🎯
Best entry? Around $1 🔥
BTC#13: Market Shaking! Where is BTCUSDT Price? 💎 💎 💎 As predicted in the previous article, the price touched the H1 trendline zone and then had a correction back to the 96K support zone. Now we will continue to plan for BTC 💎 💎 💎
1️⃣ **Fundamental analysis:**
📊Maryland, the United States plans to establish a strategic Bitcoin reserve fund
🔹US non-farm payrolls increased by 143,000 in January, lower than expected;
🔹Trump plans to announce retaliatory tariffs as early as Friday
🚀 Interest rate futures traders expect the Fed to make another rate cut in May
📌 Overall, the current fundamentals are still supporting BTC's upside potential. However, market liquidity is still being affected by Trump's tariff policies and potential future trade wars from these policies
2️⃣ **Technical analysis:**
🔹 **D frame**: A long-tailed pinbar appeared when the price reached the 99K resistance zone. However, the 96K support zone is still doing its job well. For a clearer view, we will evaluate the smaller time frames
🔹 **H4 frame**: The bearish price structure is still intact with no signs of change.
🔹 **H1 frame**: Although the bearish price structure was broken, it immediately turned down. The price reaction at the current support area is weak.
3️⃣ **Trading plan:**
⛔ Looking at the multi-frame price structure, it can be seen that this is not a suitable time to establish a BUY position. Basic information from the market is also showing concern about the upcoming tariff policy. If there is a change in the price structure from H1, then this possibility should be considered.
✅ Trading with the trend is still the top priority, 2 pinbars in time frame D also show that the market sentiment is leaning towards the bears.
💪 **Good luck trading!**

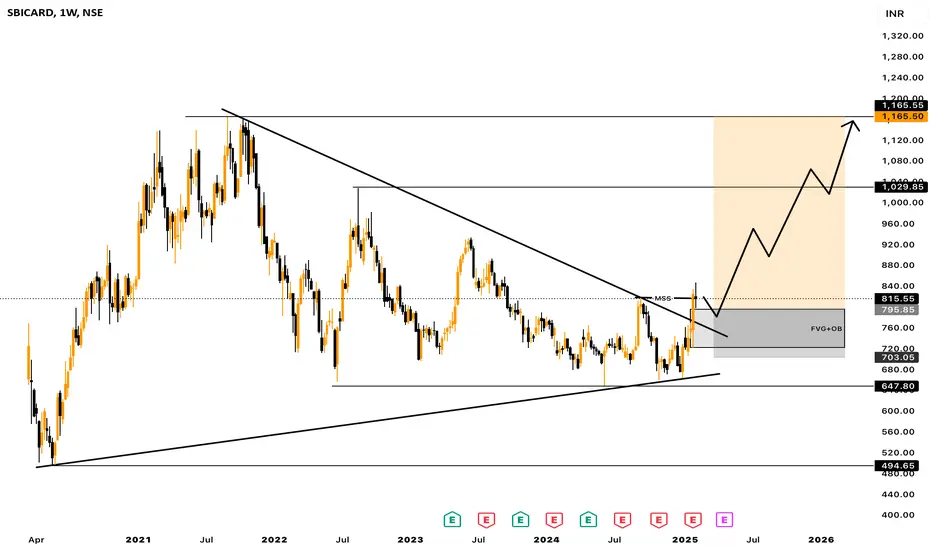
Technical Analysis: Symmetrical Triangle Breakout in SBICARD
• The weekly chart of SBI Cards (SBICARD) shows a symmetrical triangle pattern that has been forming since mid-2021.
• The stock recently broke out of this pattern, indicating a potential trend reversal or continuation move depending on broader market conditions.
• Resistance Breakout: The upper trendline, which acted as resistance, has been breached, and the stock is now retesting the breakout level (~800).
• Volume Confirmation Needed: To validate the breakout, an increase in volume would be ideal.
Fundamental Analysis: Mixed Earnings Performance
• Earnings Per Share (EPS) Trends:
• Q3 FY24 EPS came in at 4.25, missing estimates by 31.16%—a significant negative surprise.
• Q2 FY24 EPS also missed estimates by 4.51%, while Q1 FY24 had a 4.59% miss as well.
• The company has shown inconsistent earnings, which could cause volatility despite the technical breakout.
• Revenue Growth:
• Q3 FY24 revenue was ₹46.19B, exceeding estimates by 10.06%.
• Q2 FY24 revenue missed expectations by 3.01%, while Q1 FY24 was also slightly weak.
• This suggests that while top-line growth is strong, profitability (EPS) is under pressure due to either higher costs or operational inefficiencies.
Investment View: Cautious Buy with Risk Management
• Technical View: The breakout above the triangle is bullish, but the stock must sustain above 800-820 for confirmation. If it does, next resistance levels are 900 and 1000.
• Fundamental Concerns: Weak earnings growth is a risk factor. The next earnings (April 2025) will be crucial.
• Buying Strategy:
• Entry: If the stock holds above 800-820, it can be bought with a target of 900-1000.
• Stop Loss: 750-770 zone (below the breakout trendline).
• Risk Factor: If broader market sentiment weakens or earnings disappoint further, the breakout might fail.
Conclusion: A breakout trade is valid, but weak earnings make it a cautious buy with a tight stop loss. If fundamentals improve, the rally could sustain.
EUR/USD Daily Chart Analysis – Smart Money Perspective
Current Market Bias: Bearish
The price action indicates that the overall structure remains bearish, with lower highs and lower lows being formed. Despite recent bullish retracements, the price has failed to break key resistance levels, signaling that sellers remain in control.
Key Areas on the Chart:
1. Order Block (OB) & Fair Value Gap (FVG) Zone:
• The highlighted gray zone represents an order block (OB), which is a supply area where institutions likely placed large sell orders.
• The presence of a fair value gap (FVG) within this zone indicates an inefficiency in price, making it a strong area for potential reversals.
• Price recently tapped into this area and reacted downward, confirming bearish momentum.
2. Liquidity Grab Possibility:
• The lower dashed line represents a previous swing low, where liquidity (stop-loss orders) is likely resting.
• Smart Money often seeks liquidity before reversing or continuing trends.
• There is a high probability that price will sweep this low before any potential bullish move occurs.
3. Market Structure Shift for a Bullish Setup:
• Although the bias remains bearish, a market structure shift (MSS) is required before considering any long (buy) setups.
• A key level to watch is 1.05351, where a break above could signal a reversal.
• Until then, selling pressure is likely to dominate.
Conclusion & Trade Plan:
• Bearish bias remains active.
• Price might sweep the previous low to grab liquidity before a potential reversal.
• A confirmed market structure shift above 1.05351 is required for bullish confirmation.
• Until that happens, traders should focus on shorting opportunities near supply zones or order blocks.
Final Thought:
By following Smart Money Concepts (SMC), traders can align their trades with institutional movements. Patience is key—wait for confirmations before entering positions. Keep an eye on liquidity sweeps and market structure shifts for the best trade setups.

XAU#13: First NF under Trump, Gold Heading for $2900?💎 💎 💎 Yesterday OANDA:XAUUSD had a slight correction. The current optimization has an important information which is the first Non-farm data under Trump. We will analyze and find trades for today: 💎 💎 💎
1️⃣ **Basis of analysis:**
📊 Yields may remain at a higher neutral level
⚫Dallas Fed President Logan said that interest rates may be close to neutral and do not need to be cut further, unless the labor market weakens.
⚫Even if the 2% money leaf is completed, the Fed can still maintain current interest rates.
👉 Impact of Trump administration policies
⚫Provided to track the impact of tax policies, tax cuts and import controls to deal with growth and employment.
⚫Uncertainty about how the economy will react to these changes.
🚀 ✅️First Non-Farm Data Under Trump | Forecast Big Change, Gold Heading Towards $2900?
2️⃣ **Technical Analysis:**
🔹 **D Frame**: We have not seen anything significant in yesterday's trading. The D structure price has not changed yet.
🔹 **H4 Frame**: There is a price correction found but has not been able to reach the trend line below. By dark today there will be a Nonfarm news. The price line is still SW and there is no clear sign
🔹 **H1 Frame**: As everyone has seen, the price has broken through the trend line back to the uptrend. But this is the ancient creature area. We need to investigate further to find a better service location
3️⃣ **Trading plan:**
⛔ The current area is not suitable for trading. The price line has adjusted and reacted strongly by breaking the trend of the moderate adjustment rhythm, Prioritize BUY positions, but pay attention before the NF news is announced, the market may sweep both ends.
✅ The first non-agricultural data under Trump is an important news and attracts a lot of market opinions. If the data is weak, gold may rise to 2900; if strong, gold may adjust around 281x~282x.
💪🚀 **Wish you successful trading!**

Bharti Airtel – Strong Setup for Short-Term & Positional HoldingHello everyone! Hope you're all doing great in life and in trading. Today, I bring you a stock that has not only given a strong breakout but also delivered exceptional Q3 FY25 results stock name is Bharti Airtel Ltd. and it is the world’s leading providers of telecommunication services with presence in 18 countries representing India, SriLanka, 14 countries in Africa.
After breaking out of a descending trendline , Bharti Airtel is now retesting the 1630-1600 support zone . If this level holds, we could see a strong upside move in the coming sessions. The technical structure remains bullish, with an entry zone between 1630-1600 , and targets at 1688, 1736, and 1778 , while the final positional target is set at 1955 . For risk management, a short-term stop loss at 1570 and a positional stop loss at 1520 should be considered. RSI is showing strong momentum , and volume confirmation on the breakout strengthens the bullish case
.
Latest Q3 FY25 results highlight consistent revenue and profit growth . The company’s standalone revenue surged 19.1 percent YoY to 45,129 crore , with its India business growing 24.6 percent YoY . ARPU has increased to 245 , boosting overall profitability. EBITDA came in at 24,880 crore , with a 55.1 percent margin , showing strong operational efficiency. On the expansion front, 5G rollout is progressing aggressively, with 5.2K new towers added , and the subscriber base has grown by 25.2 million users . Additionally, Bharti Airtel has significantly improved its financial position, having prepaid 36,263 crore in spectrum dues , further strengthening its balance sheet.
Market Cap
₹ 9,70,118 Cr.
Current Price
₹ 1,620
High / Low
₹ 1,779 / 1,098
Stock P/E
48.5
Book Value
₹ 153
Dividend Yield
0.49 %
ROCE
13.1 %
ROE
14.9 %
Face Value
₹ 5.00
Industry PE
40.9
Debt
₹ 2,25,541 Cr.
EPS
₹ 43.2
Promoter holding
53.1 %
Intrinsic Value
₹ 421
Return over 5years
25.1 %
Debt to equity
2.59
Net profit
₹ 27,074 Cr.
Disclaimer:- This analysis is for educational purposes only. Please trade responsibly and consult a financial advisor before making any decisions.
If you found this analysis helpful, don’t forget to like, follow, and share your thoughts in the comments below! Your support keeps me motivated to share more insights. Let’s grow and learn together—happy trading!

BTC#12: Gathering signs from the price line
💎 💎 💎 Is plan #11 helping you make a profit?💎 💎 💎
🔥 As we analyzed the possibilities of BINANCE:BTCUSDT in the previous article, BTC temporarily entered the SW process. And here is the next plan for BINANCE:BTCUSD 🔥
1️⃣ **Fundamental analysis:**
📊 The Trump administration has taken the first step in loosening cryptocurrency regulations. The US SEC plans to reduce the cryptocurrency enforcement team
"eliminate excessive regulations" on digital assets.
🚀US senators from the state of Ohio have proposed a bill to establish a Bitcoin reserve fund and accept it as a form of payment.
📌The US sovereign wealth fund plan is expected to be implemented within 90 days
2️⃣ **Technical analysis:**
🔹 **D frame**: Looking at D frame, we can see that the downtrend is not over yet. If today's price surpasses yesterday's candle wick, we will see a more optimistic market situation.
🔹 **H4 frame**: The bearish price structure is not over yet. Currently, if the support zone of 96~97K is still waiting for evaluation
🔹 **H1 frame**: You can see that the price is close to the trendline. However, we are in a bearish price structure -> Don't rush to decide on this area.
3️⃣ **Trading plan:**
⛔As you can see on the chart, the downtrend has not been broken yet. We still need to wait for confirmation of the 96~97K area by the price structure. Be patient to wait for a better buying position and less risk
✅ Currently, finding a SELL position is in accordance with the price structure, but this price zone is not suitable for establishing a position. You can wait for the price to touch the larger trendline zone and consider the price reaction in that area to establish a position
💪 **Wish you successful trading!**

Gold : Need a reset ?Gold price is testing the daily resistance (R1) and price did not breakout this pivot resistance on daily ,we have seen a massive bull run on gold so we can consider following case for short to mid term from here :
Short-Term : there's a likelihood of a short-term pullback or consolidation (Don't take this as a sell call from me , I am still holding all my buy trades and will add on pullback). This would be a healthy (Yes and this will be a normal correction if it happen) move after a strong uptrend, allowing the market to digest gains . Watch for support at the green trendline and at the previous ATH.
Mid-Term: The strong volume during this uptrend suggests that there's still significant interest in buying gold ,so overall market structure and trend is bullish and we can re-buy from lower levels after a good confirmation.

Option Chain AnalysisUnderstanding Option Chain Analysis
An option chain is a matrix consisting of all available contracts for investors. Option chains are available for individual stocks and market indices like NIFTY 50 and NIFTY 500. You can select a stock or a market index and find all available options through an option chain.
The 9.20 short straddle strategy involves selling a call and a put option at the same strike price at 9:20 AM in Indian markets, aiming to capitalize on time decay and volatility.

Unique way of Trading the Broadening Patterns with examplesI daily make educational content videos for swing / positional trading

XAU#12: Blocking gold is burning? Experience when trading XAU🔥Yesterday we had a correction to 280x (slightly higher than the 279x analysis of analysis #11) which gave us a very nice buying position. Currently, the price is still continuing to conquer the next milestones. 🔥
💎 💎 💎 And here is the plan for FOREXCOM:XAUUSD : 💎 💎 💎
1️⃣ **Fundamental analysis:**
📊 The World Gold Center is Expanding, the shift of the gold market center from New York, London, Zurich to Dubai, Shanghai, Mumbai and Saudi Arabia.
🔴 Dubai now accounts for 25% of global gold trading, becoming the second largest market in the world. Demand for physical gold from emerging markets such as India, Turkey and China is increasing strongly because gold is considered a "stable currency".
📌 Morgan Stanley: No longer expecting the Fed to cut interest rates in March, expecting a rate cut in June
🚀 Although high interest rates and a strong USD often put pressure on gold, gold prices have remained stable, showing the sustainability of the uptrend. However, money flows from Western investors have not yet participated strongly in this price increase, although every slight adjustment is bought.
2️⃣ **Technical analysis:**
🔹 **D Frame**: Yesterday's candle closed showing optimism about the prospect of OANDA:XAUUSD 's price increase.
🔹 **H4 Frame**: The bullish structure has not changed.
🔹 **H1 Frame**: We have new support zones but there is no sign of a correction. Gold's uptrend is sustainable
3️⃣ **Trading plan:**
⛔ As you can see, the importance of trading with the trend. There are quite a few accounts that have been burned by stubbornly holding on to losses waiting for gold to fall. However, this action will erode our trading psychology and accounts. In my personal experience, blocking gold to catch a falling knife or holding on to losses at this time always brings bad results. The advice for those who have lost or are still holding on to losses is that we should end our mistakes and rest to stabilize our psychology before planning the next transaction.
✅ If we have a good position, we can completely wait for a larger profit according to the current situation. In my personal experience, with the current long-term increase, we can only wait until Gold reaches round numbers like 2900 or 3000. Pay special attention to the 3000 mark because its value is equivalent to an important psychological barrier
💪🚀 **Wish you successful trading!**
📌 For any questions, please contact us directly. I am ready to answer you for free

Gold Skyrockets to New Heights – Is $3,000 the Next Stop? 🚀 Gold Breaks Records Again – Is $3,000 Next? 🚀
Gold has done it again! A new all-time high (ATH) has been set, proving once more that the market’s hunger for safe-haven assets is at an all-time high. With rising geopolitical tensions, inflationary fears, and economic uncertainty, investors are pouring into gold, looking for stability amidst the chaos. But is this just the beginning?
🔥 Gold’s Unstoppable Surge – What’s Driving It?
🔹 The USD’s Strength Can’t Stop Gold – Despite a strong dollar, gold continues to push higher, signaling extreme demand from institutions and retail investors alike.
🔹 Geopolitical Uncertainty & Trade Wars – Trump’s latest tariff policies on Canada, Mexico, and China have spooked global markets, fueling demand for safe-haven assets.
🔹 Stock Market Volatility & Crypto Struggles – The S&P 500 and Bitcoin are facing major resistance, while gold is thriving. This shift in capital flows suggests that gold is currently the #1 preferred asset for wealth preservation.
📈 What’s Next for Gold?
💡 Shorting Gold Right Now is Dangerous!
The FOMO effect is in full swing, and the technical structure remains bullish. Even traditional indicators like Elliott Wave, Fib Extensions, and RSI overbought levels are being ignored as price surges past resistance levels with ease.
Is there a correction ahead? Of course, markets never move in a straight line. However, until we see a true breakdown in structure, every dip remains a buying opportunity.
💰 How to Trade This Market
🔹 Manage Your Risk – Extreme volatility means trading without stop-losses is reckless.
🔹 Follow the Momentum – Don’t fight the trend. Gold is moving higher for a reason.
🔹 Stay Updated – The macroeconomic landscape is shifting fast. Follow along to stay ahead!
💬 What’s Your Prediction?
👉 Will gold smash through $3,000 in the coming weeks, or are we in for a sharp correction? Drop your thoughts in the comments!
💛 Follow for daily insights & real-time trade strategies! 🚀

Gold Surges to All-Time High: Navigate Volatility with Confidenc🌍 Market Overview:
Gold reached a record high at the start of the week, fueled by safe-haven flows after U.S. President Donald Trump announced a 25% tariff on Canada and Mexico and a 10% tariff on China.
USD Index (DXY): After a strong rally, DXY retraced to fill its liquidity gap, and technical analysis suggests a potential continuation of the uptrend in the coming days.
Market Sentiment: Concerns over trade wars and rising inflation are major factors supporting gold prices. However, geopolitical uncertainty is causing significant market volatility.
📈 Key Levels for the Asian Session:
Main range: 2822 - 2808.
Trading strategy: Monitor price action at the short-term support and resistance zones. Wait for breakout and retest signals to determine trading direction.
💡 Trading Strategies:
BUY SCALP:
Entry: 2786 - 2784
SL: 2780
TP: 2790 - 2794 - 2798 - 2803 - 2806 - 2810
BUY ZONE:
Entry: 2774 - 2772
SL: 2768
TP: 2778 - 2782 - 2786 - 2790 - 2795 - 2800
SELL SCALP:
Entry: 2830 - 2832
SL: 2836
TP: 2825 - 2820 - 2815 - 2810
SELL ZONE:
Entry: 2848 - 2850
SL: 2854
TP: 2843 - 2840 - 2835 - 2830 - 2826 - 2822
⚠️ Key Notes:
The market remains highly volatile due to escalating trade tensions. Exercise caution when trading.
Always adhere to TP/SL levels to protect your account.
Stay updated on key indicators and news to adjust strategies promptly.
🚀 Join the KevinNguyen-SimpleTrade Community
👉 Follow for more daily market insights and trading strategies.
👉 Access accurate and optimized trading signals through the Premium Signal service.
Wishing everyone a successful trading day! 🚀

Pre and Post Breakout with Pattern trading I make educational content videos for swing / positional trading

BTC#11: Will BTC rise or fall?. Market structure perspective
💎 💎 💎 Did you make a profit in post #10? Please share and comment your thoughts 💎 💎 💎
🔥After the Monday morning dump, we witnessed an amazing recovery of BINANCE:BTCUSD . Market sentiment has improved significantly. We continue to plan for BINANCE:BTCUSDT as follows:🔥
1️⃣ **Fundamental analysis:**
📊Data: Stablecoin on-chain trading volume decreased by 10.5% in January and legal CEX spot trading volume decreased by 18.2%
🔴According to Bybit CEO Ben Zhou, the total value of actual crypto liquidations is higher than $2 billion, he estimates this figure at around $8-10 billion.
🚀Donald Trump signed an executive order to establish a US national investment fund.
📌 In general, market liquidity is falling sharply, the loss after the recent correction has brought a cautious mentality to the majority of investors in the cryptocurrency market.
2️⃣ **Technical analysis:**
🔹 **D Frame**: Yesterday's D candle marked the amazing recovery of BTC. Currently, the price structure of frame D is still maintained as an increasing price structure.
🔹 **H4 Frame**: Gives us a different perspective. Although BTC has recovered, the price structure of frame H4 has not been broken. We will have to wait a while before seeing a more positive signal
🔹 **H1 Frame**: As you can see, BTC is still running in the downtrend channel. The KEY 977xx zone will play an important role in predicting the next direction
3️⃣ **Trading plan:**
⛔At the present time. Although the D candle is a positive sign, in the smaller time frame we still do not have a price structure confirming the recovery of the main trend. Whether placing a BUY or SELL order in this area is very dangerous because there is no confirmed price structure. You should wait to get the best trading position
✅ Based on my personal experience, I will wait for the price reaction in this 97K area. If a supportive price structure appears, we can have a good position following the main trend in the D frame.
💪 **Wish you successful trading!**
📌 For any questions, please contact us directly. I am ready to answer you for free
