Fundamental Analysis for Long-Term Investors1. Understanding the Concept of Fundamental Analysis
At its core, fundamental analysis (FA) seeks to answer one key question: What is the true value of this company?
By comparing the intrinsic value (calculated through analysis) with the current market price, investors can decide whether to buy, hold, or sell a stock.
If Intrinsic Value > Market Price, the stock is undervalued — a potential buying opportunity.
If Intrinsic Value < Market Price, the stock is overvalued — a signal to avoid or sell.
This method assumes that, in the long run, the market will correct any mispricing and reflect the company’s actual worth.
2. Components of Fundamental Analysis
Fundamental analysis can be divided into two main parts:
a) Qualitative Analysis
This part deals with the non-numerical aspects of a company, such as:
Business Model – How the company earns revenue and its sustainability.
Management Quality – Leadership capability and corporate governance.
Competitive Advantage (Moat) – Unique strengths like brand value, patents, or cost advantages.
Industry Outlook – Growth potential, regulatory environment, and barriers to entry.
Economic Factors – Interest rates, inflation, fiscal policy, and global market trends.
b) Quantitative Analysis
This involves examining measurable data like financial statements, ratios, and cash flows to determine a company’s financial health.
3. Key Financial Statements in Fundamental Analysis
A company’s financial statements form the backbone of fundamental analysis. Long-term investors should focus on three primary statements:
a) Income Statement
It shows the company’s profitability over a period, detailing revenue, expenses, and net income.
Key metrics:
Revenue Growth – Indicates whether the company’s sales are increasing consistently.
Operating Margin – Reflects operational efficiency.
Net Profit Margin – Shows how much profit remains after all expenses.
b) Balance Sheet
This statement provides a snapshot of the company’s financial position — assets, liabilities, and shareholders’ equity.
Important metrics include:
Debt-to-Equity Ratio (D/E) – Measures financial leverage; lower ratios imply less risk.
Current Ratio – Indicates liquidity; a ratio above 1 shows good short-term financial health.
Book Value per Share – Helps assess whether the stock is trading above or below its book value.
c) Cash Flow Statement
This shows the actual cash generated or used by the company.
Focus areas:
Operating Cash Flow (OCF) – Cash generated from core business operations.
Free Cash Flow (FCF) – Cash left after capital expenditures; indicates ability to reinvest or reward shareholders.
4. Key Financial Ratios for Long-Term Investors
Ratios simplify the evaluation of a company’s performance. Some of the most important ones are:
a) Valuation Ratios
Price-to-Earnings (P/E) Ratio – Indicates how much investors are willing to pay for each rupee of earnings. A lower P/E could suggest undervaluation.
Price-to-Book (P/B) Ratio – Compares market value to book value; useful for asset-heavy industries.
Price-to-Sales (P/S) Ratio – Ideal for companies with negative earnings but growing sales.
b) Profitability Ratios
Return on Equity (ROE) – Measures how efficiently equity is used to generate profit.
Return on Assets (ROA) – Shows how effectively the company uses its assets.
Gross and Net Margins – Indicate profitability at different stages of the income statement.
c) Liquidity and Solvency Ratios
Current Ratio & Quick Ratio – Assess short-term liquidity.
Interest Coverage Ratio – Measures ability to pay interest on debt.
d) Growth Ratios
Earnings Per Share (EPS) Growth – Consistent EPS growth indicates strong performance.
Revenue Growth Rate – Reflects expansion potential and demand.
5. Intrinsic Value and Valuation Methods
The goal of fundamental analysis is to determine intrinsic value — an estimate of what a company is truly worth. Some popular valuation methods include:
a) Discounted Cash Flow (DCF) Model
This method projects the company’s future cash flows and discounts them to present value using a required rate of return.
It’s one of the most reliable methods for estimating intrinsic value, though it requires accurate assumptions.
b) Dividend Discount Model (DDM)
Used for dividend-paying companies; it values a stock based on future dividend payments discounted to the present.
c) Relative Valuation
Compares the company’s valuation ratios (like P/E or EV/EBITDA) with peers or industry averages to assess whether it’s under or overvalued.
6. Economic and Industry Analysis
Fundamental analysis is not limited to company-level study. A top-down approach starts with understanding the broader economy and narrows down to sectors and companies.
a) Economic Analysis
Factors like GDP growth, interest rates, inflation, and fiscal policy impact company earnings and valuations. For example:
Rising interest rates can hurt highly leveraged firms.
Inflation affects input costs and consumer demand.
b) Industry Analysis
Identifying industries with favorable long-term prospects (such as renewable energy, technology, or healthcare) can improve investment success. Tools like Porter’s Five Forces help analyze industry competitiveness and profitability.
7. Qualitative Factors and Management Assessment
A company’s management team plays a vital role in long-term success. Investors should assess:
Leadership Track Record – Vision, integrity, and experience of the management team.
Corporate Governance – Transparency, accountability, and alignment with shareholder interests.
Innovation Capability – Ability to adapt to changing technology or consumer behavior.
Brand Reputation – Strength of brand loyalty and market position.
8. The Margin of Safety Principle
Coined by Benjamin Graham, the margin of safety is the difference between a stock’s intrinsic value and its market price.
For example, if a stock’s intrinsic value is ₹500 and it’s trading at ₹350, the 30% gap is the margin of safety — a cushion against analytical errors or unforeseen events.
This principle ensures that even if some assumptions go wrong, the investment remains relatively safe for the long term.
9. Long-Term Perspective and Patience
Fundamental analysis rewards patience. Stock prices can remain undervalued or overvalued for extended periods due to market sentiment or short-term volatility. However, over time, prices tend to align with intrinsic value.
Long-term investors must focus on business fundamentals, not market noise.
Compounding works best when investments are held for years in fundamentally strong companies with consistent growth, low debt, and sustainable advantages.
10. Limitations of Fundamental Analysis
While powerful, FA has its challenges:
Time-Consuming – Requires deep research and analysis.
Subjectivity – Valuation depends on assumptions that may not always be accurate.
Market Irrationality – Prices can deviate from fundamentals for long periods.
Changing Macroeconomics – Economic shocks can alter intrinsic value projections.
Thus, blending FA with periodic reviews and awareness of market cycles enhances decision-making.
Conclusion
Fundamental analysis is the foundation of successful long-term investing. It equips investors with the knowledge to differentiate between temporary market noise and genuine value. By analyzing a company’s financial health, competitive position, management quality, and future prospects, investors can make informed decisions that compound wealth over time.
Trading!
Commodity Trading: Gold, Silver, Crude Oil, Natural Gas on MCX1. Overview of MCX and Commodity Trading
The Multi Commodity Exchange (MCX) was established in 2003 and operates under the regulatory framework of the Securities and Exchange Board of India (SEBI). It provides a transparent and standardized platform for trading in commodity derivatives, allowing market participants to hedge against price volatility or take speculative positions based on their market outlook.
Commodity trading on MCX includes bullion (gold, silver), energy (crude oil, natural gas), and base metals (copper, zinc, aluminum) among others. Prices are largely influenced by international benchmarks — for example, COMEX for gold and silver, and NYMEX for crude oil and natural gas — since commodities are globally traded and denominated in U.S. dollars.
2. Gold Trading on MCX
a. Importance of Gold
Gold is considered both a precious metal and a safe-haven asset. It acts as a hedge against inflation, currency depreciation, and economic uncertainty. In India, gold also holds immense cultural and investment value, making it one of the most traded commodities.
b. MCX Gold Contracts
MCX offers multiple gold contracts to cater to different categories of traders:
Gold (1 kg)
Gold Mini (100 grams)
Gold Guinea (8 grams)
Gold Petal (1 gram)
Gold Petal (New Delhi)
Each contract differs in lot size and margin requirements, allowing both retail and institutional traders to participate. The price quote is in Rupees per 10 grams, and the underlying is standard gold of 995 purity.
c. Factors Influencing Gold Prices
Global economic data (especially U.S. inflation, employment, and GDP)
US Dollar movement – Gold has an inverse relationship with the USD.
Interest rate changes by the U.S. Federal Reserve.
Geopolitical tensions or crises that boost safe-haven demand.
Jewelry demand and central bank reserves.
d. Trading Strategy
Gold trading often combines technical analysis (using trendlines, moving averages, and RSI) with macro fundamentals (like Fed announcements). Traders also track the COMEX gold price and the rupee-dollar exchange rate for near-term movement cues on MCX.
3. Silver Trading on MCX
a. Role of Silver
Silver, often referred to as the “poor man’s gold,” has both precious and industrial uses. It’s widely used in electronics, solar panels, and medical instruments. This dual nature makes silver more volatile than gold.
b. MCX Silver Contracts
MCX offers several contracts:
Silver (30 kg)
Silver Mini (5 kg)
Silver Micro (1 kg)
Silver 1000 (30 kg, 999 purity)
The price quote is in Rupees per kilogram. Silver contracts are physically settled, ensuring price integrity and alignment with physical market demand.
c. Price Influencers
Industrial demand in electronics and solar sectors.
Gold price movement (since silver tends to follow gold trends).
US Dollar and bond yields.
Global supply-demand balances from major producers like Mexico and Peru.
d. Trading Insights
Silver’s high volatility appeals to short-term traders. It responds strongly to global macro news and industrial growth data. Many traders use gold-silver ratio analysis — when the ratio widens, it may suggest silver is undervalued relative to gold, and vice versa.
4. Crude Oil Trading on MCX
a. Significance of Crude Oil
Crude oil is the lifeblood of the global economy — influencing transport, manufacturing, and inflation. As one of the most liquid commodities, it offers dynamic trading opportunities. MCX crude oil prices track NYMEX WTI Crude, adjusted for the INR/USD rate.
b. MCX Crude Oil Contracts
MCX offers:
Crude Oil (100 barrels)
Crude Oil Mini (10 barrels)
Prices are quoted in Rupees per barrel. Contract expiries are aligned with global oil futures.
c. Key Factors Affecting Prices
Global demand-supply balance led by OPEC decisions.
U.S. crude inventory data from the Energy Information Administration (EIA).
Geopolitical tensions in the Middle East.
Dollar strength and global growth outlook.
Production levels in the U.S. shale industry.
d. Trading Strategies
Crude oil traders closely track weekly U.S. inventory reports, OPEC meetings, and economic indicators like global PMI data. Technical tools like Bollinger Bands and MACD help spot momentum reversals. Traders also hedge exposure against energy price swings using MCX crude futures.
5. Natural Gas Trading on MCX
a. Overview
Natural gas is a crucial energy source used for power generation, heating, and industrial processes. With the rise in clean energy demand, gas trading volumes have been rising sharply on MCX.
b. Contract Specifications
MCX offers Natural Gas (1250 mmBtu) contracts, quoted in Rupees per mmBtu (million British thermal units). Prices track NYMEX Natural Gas futures, with adjustments for INR movements.
c. Price Influences
Weather conditions – cold winters or hot summers drive higher consumption.
Inventory levels in U.S. gas storage.
Production trends from shale fields.
Transition toward clean energy and LNG demand.
Global geopolitical events affecting gas supply routes.
d. Trading Approach
Natural gas prices are highly seasonal and volatile. Traders use weather forecasts, EIA inventory data, and technical tools like support-resistance zones to time entries. Given its volatility, proper risk management and position sizing are essential.
6. Trading Mechanism and Settlement
All commodities on MCX are traded electronically, ensuring transparency. Contracts are margined, meaning traders need only deposit a fraction of the total value (typically 5–10%) as margin.
Settlement can be of two types:
Cash settlement, based on final settlement price.
Physical delivery, for bullion and select metals.
Traders should be aware of expiry dates, daily price limits, and margin requirements to manage positions effectively.
7. Risk Management and Hedging
Commodity derivatives are vital tools for hedgers (like jewelers or oil companies) to protect against adverse price movements. For instance:
A jeweler may short gold futures to hedge inventory.
An airline may buy crude oil futures to fix fuel costs.
Speculators and arbitrageurs add liquidity, but they must apply strict stop losses, technical discipline, and volatility tracking to avoid large losses.
8. Conclusion
Commodity trading on the MCX — particularly in Gold, Silver, Crude Oil, and Natural Gas — offers immense opportunities for profit and portfolio diversification. These commodities are deeply connected to global macroeconomic events, geopolitical developments, and currency movements.
Success in this market requires a blend of technical analysis, fundamental understanding, and emotional discipline. For retail traders, starting with mini or micro contracts and focusing on risk control is key. As India’s participation in the global commodity market expands, MCX remains a vital gateway for investors to tap into the pulse of international trade and energy trends.

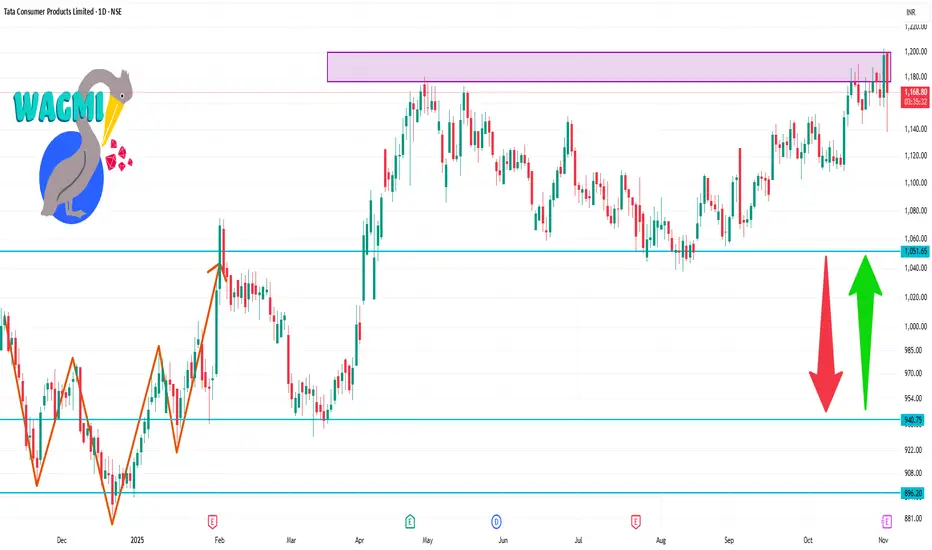
TATACONSUM 1 Day Time Frame 📊 Current Price Snapshot
Last traded around ₹ 1,155.30 on the NSE.
Day’s trading range (approx) ~ ₹ 1,157.20 to ₹ 1,169.40.
52-week range: ~ ₹ 882.90 (low) to ~ ₹ 1,191.20 (high).
🔍 Important Support & Resistance Levels
Resistance: ~ ₹ 1,170-1,190 zone (recent highs near 1,191).
Immediate Support: ~ ₹ 1,140-1,150 (recent price clustering).
Secondary Support: ~ ₹ 1,110-1,120 (if the first support fails).
Major Structural Support: ~ ₹ 1,020-1,030 (in case of deeper correction).
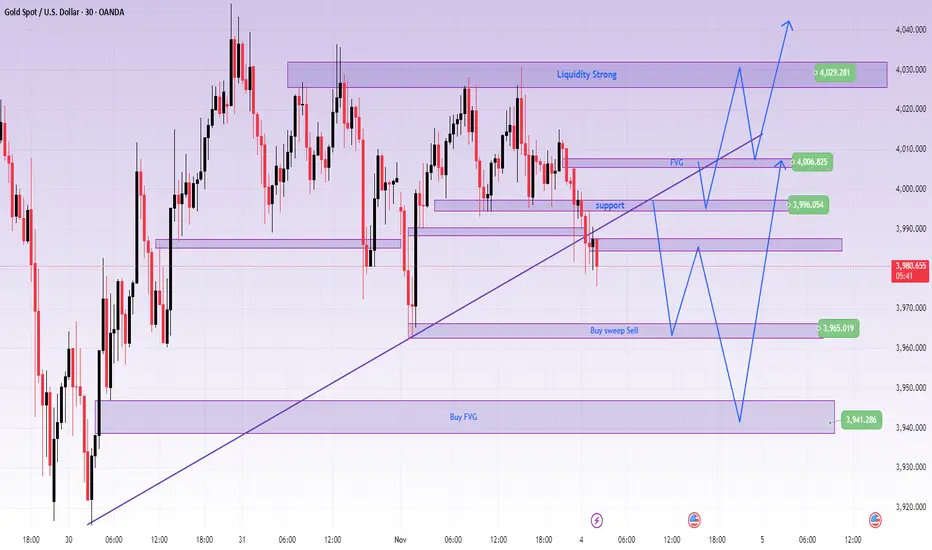
GOLD CONFIRMS SHORT-TERM DECLINE AFTER BREAKING TRENDLINEXAUUSD – GOLD CONFIRMS SHORT-TERM DECLINE AFTER BREAKING TRENDLINE
🪞 1. Overview
🌤️ In the Asian session this morning, gold broke the upward trendline even though the selling pressure wasn't particularly strong.
However, this is the first signal indicating that the short-term trend is leaning towards the sellers.
💬 Currently, the 3996 level is a significant resistance, and the price might retest this area before continuing to decline.
If the price surpasses the FVG at 4007, the trend might temporarily rebound in the short term.
💹 2. Technical Analysis (ICT Perspective)
🔸 Market structure: After breaking the trend, the structure temporarily shifts to short-term bearish.
🔸 Liquidity & FVG: Liquidity is drawn to the 3960–3940 area, while FVG 4007 is the first barrier.
🔸 Order Flow: Smart Money may lightly sweep up to the resistance area before pushing the price further down.
🎯 3. Reference Trading Scenarios
💔 MAIN SELL
Entry: 3996 | SL: 4004
TP: 3985 – 3972 – 3948
💢 SELL scalping
Entry: 4007 | SL: 4014
TP: 3998 – 3978
💖 REACTIVE BUY
Entry: 3965 | SL: 3957
TP: 3976 – 3988 – 3999
🌸 DEEP BUY
Entry: 3941 | SL: 3931
TP: 3955 – 3968 – 3988 – 4012 – 4066
🔍 4. Price Levels to Note
✨ 4007 → FVG resistance, short-term trend confirmation area
✨ 3996 → Retest area of the broken trendline
✨ 3965 – 3941 → Strong support area, likely to see reversal reactions
💬 5. Notes & Call for Interaction
⚠️ This is not an investment recommendation, but merely a personal technical perspective following the ICT method.
Observe the price reaction around the trendline carefully before making a decision 💭
If you find this post helpful, please 💛 like – 💬 leave a comment – 🔔 follow LanaM2
to stay updated with daily gold insights and learn more about the Smart Money Concept 🌷✨
Gold Squeeze: Range Breakout Can Trigger $4,100+ MoveLooking at the current gold price action on the H1 chart, we're seeing a technical setup that's been developing over the past several sessions. The market has clearly established a well-defined range between approximately $3,900 and $4,040, with price respecting both the upper and lower boundaries quite consistently.
price is holding above this ascending support while simultaneously testing the middle-to-upper zone of the range suggests building bullish momentum.
We've seen multiple attempts to push lower get absorbed by buyers, creating a series of higher lows that demonstrate underlying strength. The grey horizontal zone around $4,020-$4,040 represents the key resistance level where sellers have previously shown up, but notice how price action is becoming increasingly compressed near this level a classic sign that a breakout may be imminent.
From a probability standpoint, the combination of higher lows, sustained buying interest, and the current positioning near range highs favors an upside breakout. If gold manages to close convincingly above $4,040, we could see an accelerated move toward the $4,100+ zone fairly quickly, as there's limited technical resistance overhead once this range ceiling is breached.
However, it's worth noting that range-bound markets can be deceptive, and false breakouts are always a possibility. The key will be watching for a decisive move with strong volume and follow-through. Until we get that confirmation, remaining patient with existing positions while maintaining appropriate risk management makes sense.
The market appears coiled and ready to make its next significant move all signs point to higher prices, but as always, let the price action confirm the breakout before adding to positions.

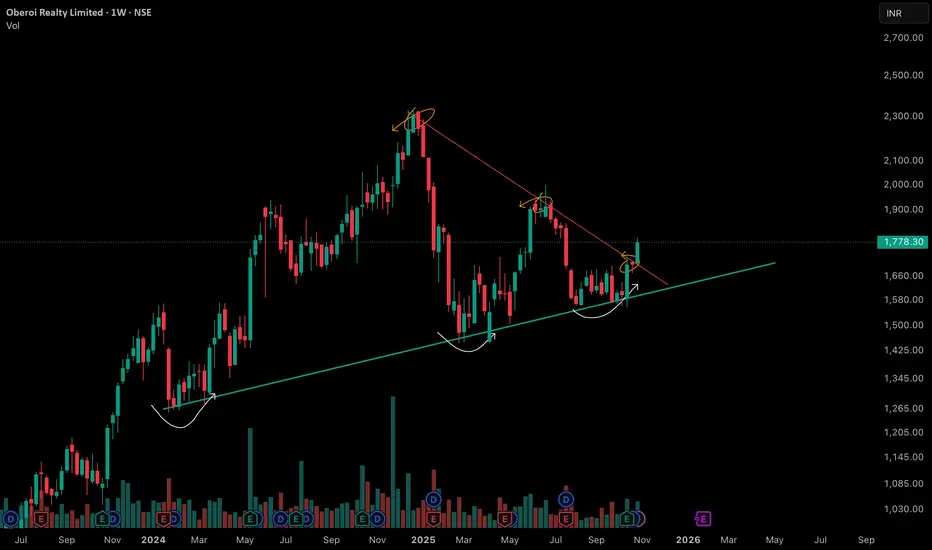
Price Halts and Power of Confluence The price chart displays a noteworthy transformation as a previous supply zone evolves into an area of strong demand, illustrating a crucial market shift. The highlighted supply region, which had earlier capped price advances and attracted selling interest, has now transitioned into a price zone where buyers are stepping in, creating multiple reactions that signify growing demand as prices revisit this level.
- Supply to Demand Conversion: The red-shaded supply band acted as a ceiling for prices historically, but recent moves show price halting and consolidating above this region, marking a critical change in the market’s balance. This type of consolidation—where price compresses and pauses just after clearing a major supply area—is a visible sign of acceptance by market participants, as both buyers and sellers reassess value at this pivotal zone.
- Consolidation as Price Stability: Observing the price action post-supply area, there is clear evidence of tight, sideways movement—an area of price equilibrium or market indecision. This consolidation signals an important digestion phase, a hallmark of healthy price action
- Trendline Confluence: The thick green upward trendline adds a second layer of technical strength to this setup. Historically, prices have repeatedly taken support on this trendline during corrections, aligning perfectly with the newly converted demand area. This intersection of the time-based trendline with the horizontal supply/demand zone forms a strong confluence. Confluence zones like this are typically high-probability areas of interest, as the overlap of structural (trendline) and behavioral (supply/demand) features amplifies the significance of the region and attracts greater participation from market players.
-

Advanced Hedging Strategies1. Understanding Advanced Hedging
At its core, hedging is a risk management technique that involves taking an offsetting position in a related asset to counterbalance potential losses. Advanced hedging, however, goes beyond simple protection. It focuses on optimizing risk-reward ratios, using derivatives combinations, and dynamically adjusting exposures according to market conditions. It is frequently used by institutional investors, hedge funds, multinational corporations, and sophisticated traders.
The aim is not just to eliminate risk but to control volatility, enhance returns, and maintain strategic flexibility.
2. Tools Used in Advanced Hedging
Before exploring the strategies, it’s important to understand the instruments used:
Options (Calls and Puts): Provide the right but not the obligation to buy or sell assets at a predetermined price.
Futures Contracts: Obligate both parties to transact at a set price on a future date.
Forwards: Customized agreements similar to futures but traded over the counter (OTC).
Swaps: Exchange of cash flows or financial instruments, commonly used to hedge interest rate or currency risks.
Exotic Derivatives: Include barrier options, binary options, and variance swaps, offering tailored risk exposures.
Advanced hedging strategies often combine several of these instruments into structured or synthetic positions.
3. Delta Hedging (Dynamic Hedging)
Delta hedging is a sophisticated options-based strategy that aims to neutralize the directional risk of an options position. “Delta” measures how much an option’s price changes relative to the underlying asset’s price.
For example, a trader holding a call option with a delta of 0.6 will hedge by selling 0.6 units of the underlying asset. As the asset price changes, the delta also changes, requiring continuous rebalancing — this is known as dynamic hedging.
Advantages:
Provides precise, real-time risk control.
Effective in managing volatility in fast-moving markets.
Challenges:
Requires constant monitoring and transaction costs.
Can lead to losses in extremely volatile or illiquid markets.
This strategy is common in options market-making, algorithmic trading, and institutional portfolio management.
4. Cross-Hedging
Cross-hedging occurs when the hedging instrument and the underlying asset are not identical but are correlated. This is often used when a direct hedge is unavailable or too costly.
For example, a jet fuel buyer might hedge fuel costs using crude oil futures since both prices move similarly. Similarly, a company exposed to a small currency may hedge through a major correlated currency.
Key to success: Correlation analysis. The hedge’s effectiveness depends on how closely the two assets move together.
Advantages:
Useful in illiquid or niche markets.
Provides flexibility in hedging complex exposures.
Limitations:
Imperfect correlation can lead to basis risk — the risk that the hedge and the asset move differently.
5. Interest Rate and Currency Swaps
Swaps are powerful tools in advanced hedging, especially for corporations and financial institutions exposed to interest rate or foreign exchange fluctuations.
Interest Rate Swaps: Allow companies to exchange fixed-rate payments for floating-rate ones, or vice versa.
Example: A firm with variable-rate debt may enter a swap to pay a fixed rate and receive a floating rate, stabilizing its interest expenses.
Currency Swaps: Used by multinational corporations to hedge exposure to exchange rate volatility in cross-border operations.
Benefits:
Long-term protection against rate or currency changes.
Can be customized to suit exposure duration and cash flow patterns.
Drawbacks:
Requires counterparties and involves credit risk.
Complex to price and monitor.
6. Options Combinations and Exotic Strategies
Professional traders often design options spreads or combinations for advanced hedging.
Examples include:
Collar Strategy: Combining a long position in the underlying with a protective put and a covered call. It limits both downside and upside risk.
Butterfly Spread: Involves multiple strikes to profit from low volatility while limiting risk.
Protective Put: Buying a put option to hedge a long position — a simple but powerful form of insurance.
Exotic Options: Barrier, Asian, or lookback options offer tailored protection and payoff structures for complex exposures.
These strategies allow cost-effective, precisely targeted, and conditional hedging.
7. Volatility Hedging
In turbulent markets, volatility becomes a risk of its own. Traders use volatility derivatives, such as VIX futures or variance swaps, to hedge exposure to market volatility.
For instance, during expected market turbulence, an investor might buy VIX futures or long volatility options to offset potential losses from market declines.
Advantages:
Protects against unpredictable volatility spikes.
Enhances portfolio stability in crisis periods.
Limitation:
Complex valuation and often expensive due to volatility premiums.
8. Tail Risk Hedging
Tail risk refers to extreme market events — low-probability but high-impact scenarios (like 2008’s financial crisis). Tail risk hedging involves using out-of-the-money (OTM) options or structured derivatives that pay off in extreme moves.
Hedge funds and institutional investors often dedicate a portion of their portfolio to such protection.
Examples:
Buying deep OTM puts on major indices.
Using credit default swaps (CDS) to hedge corporate bond risk.
Though costly during normal times, these hedges act as portfolio insurance during financial shocks.
9. Statistical and Quantitative Hedging
With the rise of algorithmic and quantitative finance, statistical hedging models use mathematics and machine learning to predict correlations and hedge dynamically.
Popular methods include:
Pairs Trading: Hedging two correlated assets (long one, short another).
Factor Hedging: Neutralizing exposure to risk factors like size, momentum, or value.
Machine Learning Models: Adaptive algorithms that adjust hedges in real-time using data patterns.
These quantitative strategies optimize efficiency and minimize human bias, often used by hedge funds and algorithmic trading systems.
10. Dynamic Portfolio Rebalancing
Advanced hedging isn’t static. It involves dynamic rebalancing — adjusting hedge ratios as market conditions evolve. Delta changes, volatility shifts, or interest rate movements may require frequent recalibration.
Portfolio managers often use Value at Risk (VaR) and stress testing to measure and fine-tune hedge effectiveness.
11. Strategic Considerations and Risks
While advanced hedging enhances risk control, it involves challenges:
Cost: Complex derivatives carry premiums and transaction fees.
Liquidity Risk: Some instruments may be difficult to exit in volatile markets.
Model Risk: Overreliance on quantitative models can lead to misjudgments.
Counterparty Risk: OTC contracts expose traders to default risk.
Therefore, successful advanced hedging requires continuous monitoring, robust analytics, and disciplined execution.
12. Conclusion
Advanced hedging strategies form the backbone of modern risk management. By intelligently combining instruments such as futures, options, swaps, and derivatives, investors can shield their portfolios from adverse market movements while maintaining exposure to potential gains. Whether through delta hedging, cross-hedging, volatility trades, or quantitative models, the essence of advanced hedging lies in precision, adaptability, and foresight.
LiamTrading - $XAUUSD$: Second Scenario – BUY UP Priority ...LiamTrading - OANDA:XAUUSD $: Second Scenario – BUY UP Priority After BREAKING RESISTANCE $4002$
With the Support of the US Treasury Secretary
Hello traders community, LiamTrading is back with detailed OANDA:XAUUSD $ analysis for the start of the week!
The Gold market is receiving strong support from policy: US Treasury Secretary Scott Bessent calls on the Fed to continue cutting interest rates as the PCE inflation is currently at $2.7\%$.
This call, aimed at reducing mortgage rates and supporting the housing market, strengthens the long-term outlook for Gold.
Technical Analysis: We prioritize continuing to buy up following the main trend. The best strategy is to enter orders at strong resistance/support zones to ensure the lowest risk.
📰 MACRO FUNDAMENTALS: CALL FOR RATE CUT
Impact: The Treasury Secretary's statement on cutting interest rates to support the "transitioning" economy increases expectations of policy easing, which is a strong support factor for Gold (although not yet an official decision).
Suitable Strategy: Market sentiment is being driven by expectations of easing policy, reinforcing the priority for a BUY (Long) position.
📊 TECHNICAL ANALYSIS: IMPORTANT PIVOT POINT
Resistance Zone $4002$: This area acts as an important pivot point.
Buy Entry will be triggered after the price breaks resistance $4002$ and retests.
Sell Entry: Look for short-term scalping at the resistance zone $4030$ to secure profits. Highlighted Zone: Prioritize entering orders at confirmed Trendline zones.
🎯 DETAILED TRADING PLAN (ACTION PLAN)
We will wait for Gold to break structure and create a BUY setup.
🟢 Main BUY Scenario (BUY Break & Retest)
Logic: Buy at $4002$ after breaking resistance and retesting, leveraging new upward momentum.
Entry (BUY): $4002$
SL: $3995$ (tight SL)
TP1/TP2: $4020$ | $4035$
TP3: $4070$
🔴 SELL Scalping Scenario
Logic: Short-term scalping at the strong resistance zone $4030$ (near Sell Liquidity zone).
Entry (SELL): $4030$
SL: $4038$
TP1/TP2: $4015$ | $4004$
TP3: $3990$
📌 SUMMARY & DISCIPLINE (Liam's Note)
Our BUY strategy is reinforced by policy outlook and technical break at $4002$. Strictly adhere to SL $3995$ to manage risk before the upward structure is confirmed.
Are you ready for Gold's movement at $4002$? Please LIKE and COMMENT!

BUY MAX HEALTHCARE FOR TRADINGMax healthcare gives a breakout on weekly as well as daily time frame to consider a buy call for short term trading perspective with strictly stoploss. 1:2 Risk Reward Ratio. if All Time High break out than i repeat my targets in next few days. Stay Tuned. This is only for educational purposes do not consider as a recommendation. do your home work first not guarantee return.

LiamTrading - $XAUUSD$: NEW WEEK TRADING SCENARIO...LiamTrading - OANDA:XAUUSD $: NEW WEEK TRADING SCENARIO – PRIORITISE SELLING After BREAKING THE TRENDLINE
Hello traders community,
The new week opens with a clear strategy: Prioritise SELLING after Gold has broken the previous upward trendline.
Although fundamental economic news (like interest rate policies and politics) supports Gold potentially reaching the $5,000$ USD mark, we must trade according to the current Price Action. The technical selling pressure is strong. We will SELL at key resistance zones and continue SELLING as the price breaks the downward structure.
📰 FUNDAMENTALS & LONG-TERM OUTLOOK
$5,000$ Prospect: Fundamental and political factors continue to support the scenario of Gold reaching $5,000$ USD in the long term (due to geopolitical risks and potential loss of Fed independence).
Short Term 🔴: Gold is under technical selling pressure after breaking through the $4,000$ USD mark.
📊 TECHNICAL ANALYSIS: TRENDLINE BREAK
Structure: Gold has exited the upward price channel and is retesting the broken trendline.
Priority: SELL at the retest resistance zone $4024$.
🎯 DETAILED TRADING PLAN (ACTION PLAN)
🔴 SELL Scenario (SELL Primary) - Preemptive Resistance
Entry 1: $4024$ (Sell retest trendline zone)
SL: $4032$
TP1/TP2: $4012$ | $4000$
TP3: $3989$
Entry 2 (Continuation SELL): When price breaks the next trendline at $3992$
SL: $4000$
TP: $3940$
🟢 BUY Scenario (BUY Reversal) - Buy at Strong Support
Logic: Only buy when price hits strong liquidity support, potential for a short-term rebound.
Entry (BUY): Around $3960$ (Buy Scalping Zone)
SL: $3954$
TP1/TP2: $3972$ | $3988 FWB:TP3 : $4000$
📌 SUMMARY & DISCIPLINE (Liam's Note) Don't let the $5,000$ USD prospect affect short-term risk management. Trade according to Price Action. Adhere to SL and prioritise SELL positions at resistance zones.
Are you ready for the SELL strategy at the start of this week?

Volume Contraction Pattern Amidst Dual TrendlinesThe chart reveals important price structure and behavior over the past 18 months, featuring both a prominent counter trend line (marked in red) and a long-term support trendline (marked in green). Each element signifies distinct phases of supply absorption and buyer interest.
• Counter Trend Line (Red): This line has consistently acted as a pivot for multiple lower highs, reflecting the presence of vigilant sellers at each attempt to move higher. Multiple reaction points along this line indicate repeated supply emergence whenever price approached the zone, especially after sharp rallies earlier in the trend.
• Support Trend Line (Green): The green upward-sloping line marks sequential higher lows. This support axis has been respected multiple times, hinting at growing accumulation at each retest despite temporary price weakness in the broader market. The curvatures at lows (forming cup-like bases) display periods of volatility contraction and constructive price action as buyers step in at successively higher prices.
• VCP Dynamics: The pattern visible in the chart exhibits systematic contraction in the price swings. Each corrective structure—characterized by the curved reactions at support—shows a shrinking amplitude in both price and volume. This VCP sequence typically points toward consistent supply absorption, with sellers getting exhausted at lower levels after each contraction. The emergence of strong green candles with above-average volume near the support line often signals a revitalization of demand forces, as seen recently.
$Q ALERT | TECHNICAL SETUP (500% Potential Setup)$Q ALERT | TECHNICAL SETUP (500% Potential Setup)
Q/USDT is sitting on a strong demand zone at $0.014–$0.016. If it holds & sustains above, we could see a potential rally toward $0.10 (~500% from this zone).
✅ Bullish structure: Price above demand = trend intact
❌ Invalidation: Price closes below demand = setup fails
Keep an eye on this key level. NFA & DYOR

Divergence SecretsOption Premium and Its Components
The premium (price of an option) is determined by several factors. It consists of:
Intrinsic Value (IV): The real value if the option were exercised immediately.
For a call: IV = Spot Price – Strike Price (if positive).
For a put: IV = Strike Price – Spot Price (if positive).
Time Value (TV): The extra premium paid for the time left until expiry, reflecting the potential for price movement.
So,
Option Premium = Intrinsic Value + Time Value.
As the option nears expiry, the time value decays—a phenomenon known as time decay or Theta decay.

Introduction to Option Greeks and Hedging1. Understanding the Concept of Option Greeks
Option Greeks are mathematical measures derived from the Black-Scholes model and other pricing models. Each Greek represents a different dimension of risk associated with holding an option position. Collectively, they help traders understand how their portfolio will behave when market variables change. The main Greeks are Delta, Gamma, Theta, Vega, and Rho.
These metrics provide traders with a structured approach to assess risk exposure. By interpreting these values, traders can anticipate potential losses or gains when market conditions shift, allowing them to make timely adjustments through hedging.
2. Delta (Δ): Sensitivity to Price Movement
Delta measures how much the price of an option changes in response to a ₹1 (or $1) change in the price of the underlying asset.
For call options, Delta ranges between 0 and +1.
For put options, Delta ranges between 0 and –1.
For example, if a call option has a Delta of 0.6, it means that for every ₹1 increase in the stock price, the option’s price will increase by ₹0.60.
Interpretation:
A Delta close to 1 (or –1) indicates the option behaves almost like the underlying asset.
A Delta near 0 means the option is far out-of-the-money and less responsive to price changes.
Use in Hedging:
Traders use Delta to create Delta-neutral portfolios. This means the portfolio’s overall Delta equals zero, making it immune to small price movements in the underlying asset. For instance, if a trader holds call options with a total Delta of +100, they can short 100 shares of the underlying asset to neutralize price risk.
3. Gamma (Γ): Rate of Change of Delta
While Delta measures how much an option’s price changes with the underlying, Gamma measures how much Delta itself changes with a ₹1 move in the underlying.
Gamma is highest for at-the-money options and lowest for deep in-the-money or out-of-the-money options.
Interpretation:
A high Gamma means the Delta changes rapidly, leading to higher price sensitivity.
A low Gamma means Delta changes slowly, making the position more stable.
Use in Hedging:
Gamma helps traders understand how stable their Delta hedge is. For instance, if you are Delta-neutral but have high Gamma exposure, even a small move in the stock price can make your portfolio Delta-positive or Delta-negative quickly. Active traders monitor Gamma to rebalance their hedges dynamically.
4. Theta (Θ): Time Decay
Theta represents the rate at which the value of an option declines as time passes, assuming other factors remain constant.
Options are wasting assets, meaning their value decreases as expiration approaches. Theta is usually negative for option buyers and positive for option sellers.
For example, if an option has a Theta of –0.05, it will lose ₹0.05 per day due to time decay.
Interpretation:
Short-term, out-of-the-money options have faster time decay.
Long-term options lose value slowly.
Use in Hedging:
Option sellers (like covered call writers) use Theta to their advantage, as they profit from the natural erosion of time value. On the other hand, buyers may hedge against Theta decay by selecting longer-dated options or adjusting their positions as expiration nears.
5. Vega (ν): Sensitivity to Volatility
Vega measures how much an option’s price changes for a 1% change in implied volatility (IV).
Volatility reflects the market’s expectation of how much the underlying asset will fluctuate. An increase in volatility generally raises option premiums, benefiting buyers and hurting sellers.
Example:
If an option has a Vega of 0.10, a 1% rise in implied volatility will increase the option’s price by ₹0.10.
Interpretation:
Options with more time to expiration have higher Vega.
At-the-money options are more sensitive to volatility changes than deep in/out-of-the-money options.
Use in Hedging:
Traders hedge volatility exposure by taking opposite positions in options with similar Vega but different expirations or strike prices. For example, calendar spreads and straddles are often used to manage Vega risk.
6. Rho (ρ): Sensitivity to Interest Rates
Rho measures how much an option’s price changes for a 1% change in interest rates.
For call options, Rho is positive — higher rates increase their value.
For put options, Rho is negative — higher rates reduce their value.
While Rho is less impactful in short-term trading, it can influence long-term options significantly, especially when central banks alter monetary policy.
7. Combining Greeks for Effective Hedging
A successful options trader doesn’t look at any single Greek in isolation. Each Greek interacts with others, influencing risk and reward simultaneously. For example:
A position may be Delta-neutral but still exposed to Gamma and Vega risks.
Theta decay may offset Vega gains in some situations.
Therefore, professional traders use multi-Greek hedging — balancing Delta, Gamma, and Vega together to minimize exposure to market fluctuations, volatility changes, and time decay.
8. Practical Hedging Strategies Using Option Greeks
Here are some common hedging approaches that rely on understanding and adjusting Greeks:
a. Delta Hedging
The most common form of hedging. Traders adjust their stock or futures positions to offset the Delta of their options portfolio. This ensures that small price moves in the underlying have minimal impact on total portfolio value.
b. Gamma Hedging
Used by professional traders to reduce the rate at which Delta changes. This typically involves adding options positions that balance out the portfolio’s Gamma exposure, keeping Delta more stable as prices move.
c. Vega Hedging
To manage volatility exposure, traders use spreads such as calendar or diagonal spreads. These involve buying and selling options with different expiration dates or strikes to neutralize Vega.
d. Theta Management
For option buyers, Theta is a cost that must be managed by timing trades or using longer expirations. For sellers, it is a profit mechanism — hence, they may hedge Delta exposure but keep Theta positive to benefit from time decay.
9. Real-World Example
Imagine a trader buys a NIFTY call option with a Delta of 0.5, Gamma of 0.03, Vega of 0.08, and Theta of –0.04.
If the NIFTY index rises by 100 points, the option’s price should increase by approximately 50 points due to Delta. However, because of Gamma, Delta itself will rise slightly, amplifying the next move.
If market volatility increases by 1%, the option gains another 8 points from Vega. But as time passes, the option loses 4 points per day due to Theta.
By analyzing these Greeks together, the trader can anticipate how the position will behave and decide whether to hedge using futures or additional options.
10. Importance of Greeks and Hedging in Risk Management
In modern trading, understanding Option Greeks is essential not only for speculation but for risk management. They transform options from gambling instruments into sophisticated financial tools.
Delta helps manage directional exposure.
Gamma ensures stability of hedging.
Theta highlights the cost of holding positions.
Vega monitors volatility risk.
Rho prepares for interest rate shifts.
Through hedging, traders can create positions that align with their risk appetite and market outlook. The goal is not to eliminate risk entirely, but to control and balance it.
Conclusion
Option Greeks are the heartbeat of options pricing and risk management. They allow traders to quantify and predict how market variables—price, time, volatility, and interest rates—affect their positions. Mastering these Greeks is the first step toward becoming a disciplined, professional trader.
By integrating Greeks into hedging strategies, traders can protect their portfolios from adverse movements, stabilize returns, and operate with confidence in volatile markets. In essence, Greeks transform options trading from speculation into a science of probability and precision — where managing risk is as important as chasing profits.

Types of Trading Strategies1. Scalping Strategy
Scalping is one of the fastest trading styles, where traders aim to profit from small price movements within very short timeframes — sometimes just seconds or minutes. Scalpers make multiple trades throughout the day, capturing small gains that can accumulate into significant profits over time.
Key Features:
Very short-term trades (seconds to minutes).
High number of trades per day.
Focus on liquidity and tight spreads.
Heavy reliance on technical indicators such as moving averages, Bollinger Bands, and volume indicators.
Advantages:
Quick results and high trading frequency.
Reduced exposure to overnight risk.
Disadvantages:
Requires constant monitoring and quick decision-making.
High transaction costs due to frequent trades.
Scalping is best suited for highly experienced traders with fast execution systems and access to low transaction fees.
2. Day Trading Strategy
Day trading involves buying and selling financial instruments within the same trading day to capitalize on intraday price movements. Traders close all positions before the market closes to avoid overnight risks like unexpected news or global events.
Key Features:
Positions last from minutes to hours.
No overnight holdings.
Heavy use of technical analysis and intraday charts like 5-minute or 15-minute timeframes.
Common Tools Used:
VWAP (Volume Weighted Average Price)
Relative Strength Index (RSI)
MACD (Moving Average Convergence Divergence)
Support and resistance levels
Advantages:
Avoids overnight market gaps and risks.
Multiple opportunities within a single session.
Disadvantages:
High emotional and mental pressure.
Requires significant time and attention during market hours.
Day trading is popular among retail traders and professionals who thrive in fast-paced environments.
3. Swing Trading Strategy
Swing trading is a medium-term strategy that aims to capture price "swings" within a trend. Traders hold positions for several days to weeks, seeking to benefit from short-term momentum.
Key Features:
Time horizon: few days to a few weeks.
Combination of technical and fundamental analysis.
Focus on trend reversals and continuation patterns.
Tools & Indicators:
Trendlines and channels
Moving averages (20, 50, 200 EMA)
Fibonacci retracement levels
Candlestick patterns
Advantages:
Less time-intensive than day trading.
Opportunity to capture larger price moves.
Disadvantages:
Exposure to overnight or weekend risks.
Requires patience and discipline.
Swing trading is ideal for part-time traders who cannot monitor the market all day but still want to actively participate in trading opportunities.
4. Position Trading Strategy
Position trading is a long-term approach where traders hold positions for weeks, months, or even years. It relies more on fundamental analysis—such as company earnings, interest rate trends, or macroeconomic indicators—than on short-term price patterns.
Key Features:
Long-term holding period.
Minimal monitoring compared to short-term trading.
Focus on underlying market fundamentals.
Examples:
Buying undervalued stocks for long-term appreciation.
Holding commodities or currencies based on economic cycles.
Advantages:
Lower transaction costs.
Reduced stress and less market noise.
Disadvantages:
Capital gets locked for longer periods.
Market reversals can lead to larger drawdowns.
Position trading suits investors with patience and a long-term vision.
5. Momentum Trading Strategy
Momentum traders aim to capture profits by trading stocks or assets showing strong price movement in one direction with high volume. The idea is to “ride the wave” of momentum until signs of reversal appear.
Key Features:
Focus on assets with strong trend and volume.
Technical indicators like RSI, MACD, and moving averages are crucial.
Entry often occurs after a breakout from key levels.
Advantages:
Can generate large profits in trending markets.
Simple concept based on market psychology.
Disadvantages:
Reversal risk: momentum can fade suddenly.
Requires strict stop-loss management.
Momentum trading is effective in volatile markets where price trends are strong and sustained.
6. Breakout Trading Strategy
Breakout trading focuses on entering trades when price breaks through a predefined support or resistance level with strong volume. The idea is that once a key level is broken, price tends to continue moving in that direction.
Key Features:
Entry upon confirmed breakout (above resistance or below support).
Stop-loss often placed near the breakout point.
Works well in trending markets.
Advantages:
Early entry in new trends.
High reward potential when breakouts are strong.
Disadvantages:
False breakouts can lead to losses.
Requires confirmation with volume and momentum indicators.
Breakout traders often use chart patterns such as triangles, flags, or rectangles to identify setups.
7. Mean Reversion Strategy
The mean reversion concept assumes that prices will eventually revert to their historical average or “mean.” Traders look for assets that have deviated significantly from their average and place trades expecting a correction.
Key Tools:
Bollinger Bands
Moving Averages
Z-score or Standard Deviation
Example:
If a stock trades far above its average price, a trader might short it expecting a pullback; if it’s below average, they might go long.
Advantages:
Works well in range-bound markets.
Statistically driven and often systematic.
Disadvantages:
Ineffective during strong trending periods.
Risk of extended deviations before mean reversion happens.
Mean reversion is popular in algorithmic and quantitative trading systems.
8. Arbitrage Strategy
Arbitrage trading exploits price differences of the same or related assets across different markets or platforms. It involves buying an asset at a lower price in one market and selling it at a higher price in another.
Types of Arbitrage:
Spatial arbitrage: Same asset on different exchanges.
Statistical arbitrage: Price inefficiencies identified through algorithms.
Merger arbitrage: Trading based on corporate event outcomes.
Advantages:
Low risk when executed properly.
Often provides consistent, small profits.
Disadvantages:
Requires large capital and fast execution systems.
Opportunities are short-lived due to market efficiency.
Arbitrage is mostly used by institutional and algorithmic traders.
9. Algorithmic (Algo) Trading Strategy
Algorithmic trading uses computer programs to execute trades automatically based on pre-defined rules and market conditions. It eliminates emotional bias and can process vast amounts of data quickly.
Key Aspects:
Quantitative models and statistical analysis.
Uses technical indicators, price action, and AI-based decision systems.
Can include high-frequency trading (HFT).
Advantages:
Precision and speed.
Emotion-free and backtestable strategies.
Disadvantages:
Requires programming knowledge and infrastructure.
High risk of system errors or overfitting.
Algo trading dominates institutional markets and is increasingly popular among advanced retail traders.
10. News-Based or Event-Driven Trading Strategy
News-based traders take advantage of volatility caused by economic releases, earnings reports, or geopolitical events. They analyze how markets react to new information and place trades accordingly.
Examples of Events:
Central bank rate decisions.
Corporate earnings announcements.
Political elections or wars.
Advantages:
High volatility offers quick profit opportunities.
Based on real-time data rather than chart patterns.
Disadvantages:
Extremely risky due to unpredictability.
Slippage and widening spreads can occur during volatile events.
This strategy requires sharp analytical skills and real-time information access.
Conclusion
Each trading strategy has its own risk, reward potential, and time commitment. Scalping and day trading suit active traders seeking quick profits, while swing and position trading cater to those preferring a more relaxed pace. Momentum and breakout strategies thrive in trending markets, while mean reversion and arbitrage strategies work in stable or range-bound conditions.
The key to successful trading lies not in using the most popular strategy, but in finding one that fits your personality, capital, time, and risk appetite. Consistent discipline, risk management, and continuous learning form the foundation of every profitable trading strategy.
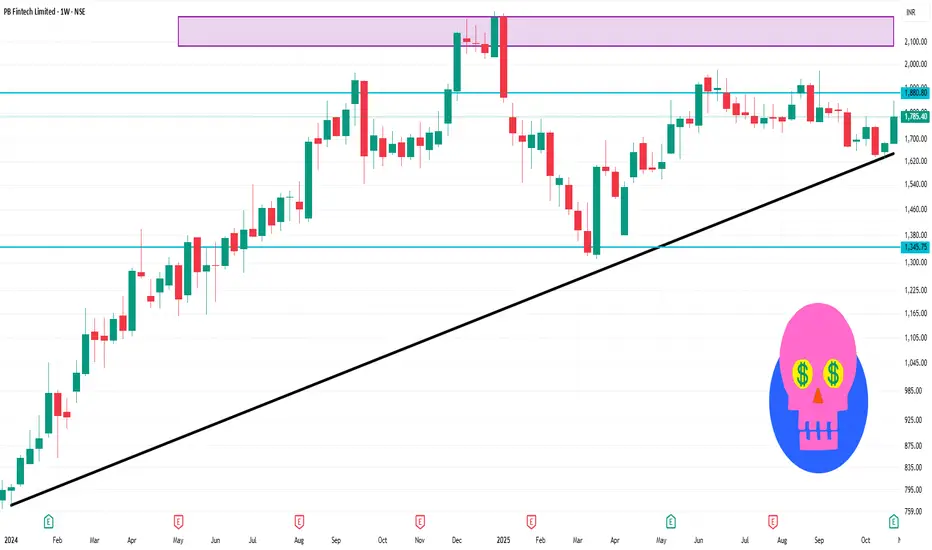
POLICYBZR 1 Week Time Frame 📊 Key levels & structure
Based on current weekly chart readings, recent pivot data and visible support/resistance zones:
Resistance zone: ~ ₹1,775-1,825 — price has been tested around this area, acting as a cap.
Support zone: ~ ₹1,650-1,620 — key lower bounds that have held in recent pullbacks.
Intermediate pivot / trigger area: ~ ₹1,700-₹1,740 — if this area gives way, next leg down could accelerate; if it holds, potential bounce.
Weekly trend: The stock is below its 50- and 200-week moving averages, signalling caution for bulls.
Momentum: RSI in mid‐range, ADX weak, so trend strength is moderate.
$HYPE/USDT Breakdown Confirmed: 30–60% Downside Incoming!$HYPE/USDT Breakdown Confirmed: 30–60% Downside Incoming!
Price broke critical support + completed a bearish retest. I'm positioning for a 30-60% correction from current levels.
TARGET ZONE: $20-$25
Why I'm Bearish Short-Term:
✅ Support turned resistance after break
✅ Already pumped 500%+ in 6 months - early holders are rotating out
✅ Clear distribution pattern forming
✅ Risk/Reward heavily favors shorts here
THE NUCLEAR WARNING: Almost $500M worth of tokens unlocking in the next 28 days.
This isn't FUD - this is math. That kind of supply hitting the market? You do the calculation.
Long-Term Perspective:
$20 zone could be THE generational entry for patient money. But right now? Let the distribution play out.
GETTEX:HYPE Distribution Phase Confirmed? 👇
NFA & DYOR

Divergence Secrets How Option Pricing Works
The price (premium) of an option is influenced by several factors, collectively known as the “Option Greeks”:
Delta: Measures how much the option price changes with a ₹1 change in the underlying asset.
Gamma: Indicates the rate of change of Delta.
Theta: Represents the time decay of the option’s value as it approaches expiry.
Vega: Measures sensitivity to volatility.
Rho: Indicates sensitivity to interest rate changes.
Additionally, the volatility of the underlying asset and time to expiry play crucial roles in determining option prices. Higher volatility increases the premium, as uncertainty boosts the potential for profit.

LiamTrading - XAUUSD: Outlook $5,000 USD and Priority BUY... LiamTrading - XAUUSD: Outlook $5,000 USD and Priority BUY Strategy at POC $3973
Hello traders community,
Gold is positioned between an extremely optimistic long-term outlook (forecast $5,000 USD in the next 12-18 months by Bank of America) and short-term technical adjustments.
Although Gold has broken the upward trendline, a sustainable downward trend has not been confirmed.
BUY positions are still prioritised!
🔥 LONG-TERM CONTEXT & INFLATION
Long-Term Push: Gold prices adjusted for inflation have DOUBLED in the past 4 years.
Highlight: Gold reinforces its role as an anti-inflation asset as real prices soar to all-time highs.
📊 DETAILED TRADING PLAN (ACTION PLAN)
Strategy: Buy at POC Zone to leverage liquidity advantage.
🟢 BUY Scenario (BUY Primary) - Buy at High Value Zone
Logic: The $3973 - 3975$ zone is right above the Buy POC (highest value zone).
Entry (BUY): $3973 - 3975$
SL: $3968$
TP1: $3988$ | TP2: $4000
Buy Up Target 2: Buy when price retests the trendline around $4002$.
🔴 SELL Scenario (SELL Scalping) - Preemptive strike at resistance zone
Entry (SELL): $4032 - 4034$
SL: $4040$
TP1: $4022$ | TP2: $4015
📌 SUMMARY & DISCIPLINE (Liam's Note)With the $5,000 USD forecast and inflation factors, the risk of SELL is increasing.
Focus on BUY at POC $3973$ and absolute SL.
Trade responsibly and with discipline!

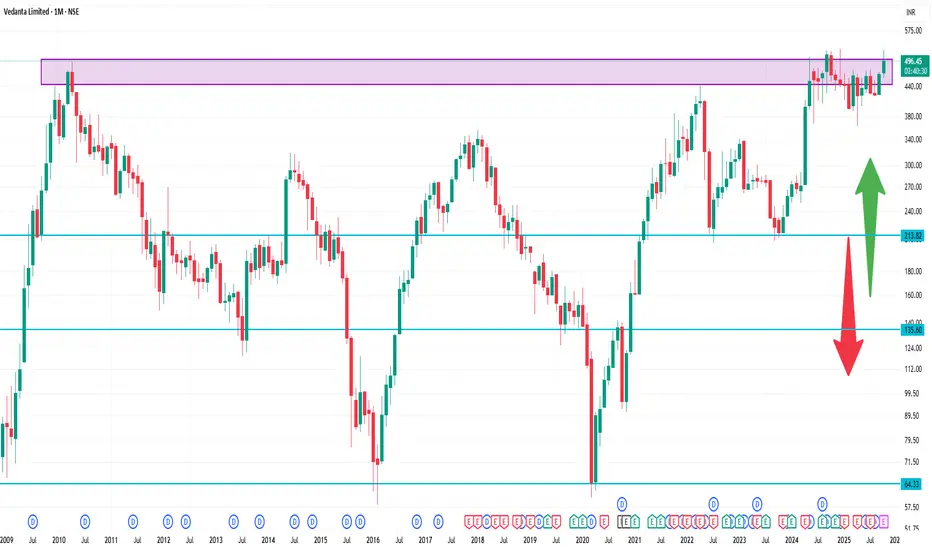
VEDL 1 Month Time Frame 🧭 Key levels to watch in the next ~4-5 weeks
Here are support and resistance levels relevant for the 1-month horizon:
🔷 Resistance
~ ₹501.40 — Monthly pivot/standard resistance level.
More immediate short-term resistance around ~ ₹497-₹500 zone based on recent highs.
🔻 Support
First key support around ~ ₹473.90 (short-term support) per technical charting site.
Secondary support near ~ ₹447.95 zone (medium term) per same source.
On a deeper drop scenario, support near ~ ₹380.15 (longer-term major support) is listed.
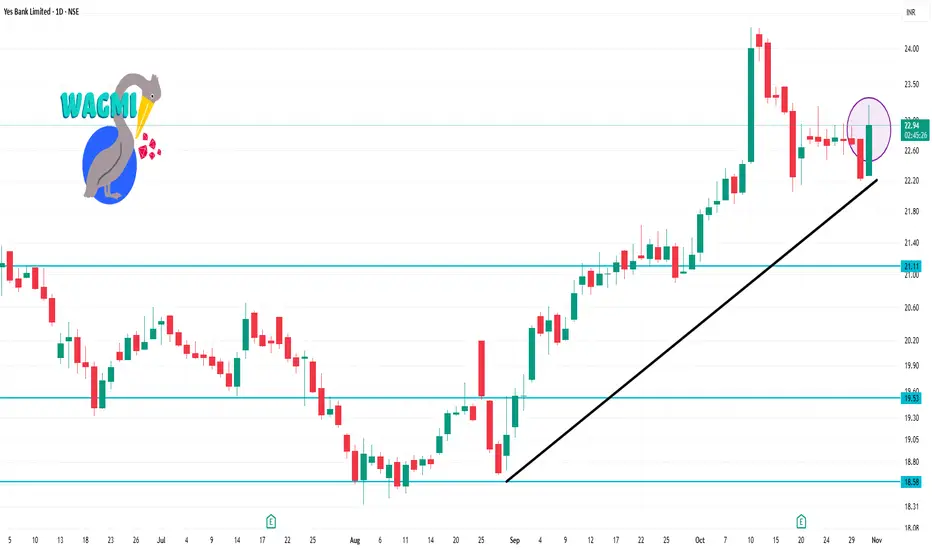
YESBANK 1 Day Time Frame ✅ Key Technical Levels & Indicators
Recent price around ₹22.60–₹22.70.
Support zones: ~ ₹22.22 (short term) and ~ ₹20.97 (medium term) according to MarketScreener.
Resistance: ~ ₹24.03 region.
Pivot (classic) for the day: ~ ₹22.58.
Daily technical indicator summary: Many moving averages show bullish (price above SMA/EMA) for 20/50/200 day on some sites.
Oscillators: RSI in mid-range (~46.6) signalling neither strongly overbought nor oversold.
Short-term trend: Many tools flag “bullish” in short, medium and long term.
The Rise of Jane Street in Global Finance1. Origins: A Humble Beginning with a Big Vision
Jane Street was founded in 2000 by a small group of traders — Tim Reynolds, Rob Granieri, Marc Gerstein, and Michael Jenkins — with a bold idea: to apply quantitative methods and technology-driven strategies to global trading. What set them apart from the start was their belief that trading was not just about speculation, but about solving complex mathematical problems efficiently.
Starting from a single office in New York City, the firm initially focused on exchange-traded funds (ETFs) — a market that was then in its infancy. ETFs were relatively new instruments, combining the flexibility of stock trading with the diversification of mutual funds. Many financial institutions did not yet understand their pricing complexities, but Jane Street’s founders recognized a goldmine of opportunity in the arbitrage and market-making potential of ETFs.
Through deep statistical analysis, coding expertise, and mathematical precision, Jane Street became one of the first firms to specialize in ETF arbitrage, helping create fair prices and efficient markets for these instruments.
2. Building the Quantitative Core
While most traditional Wall Street firms relied on intuition, experience, and aggressive speculation, Jane Street built its identity around quantitative rigor. Every trading decision was backed by data, models, and algorithms rather than mere hunches.
The firm recruited heavily from top universities, hiring mathematicians, physicists, and computer scientists instead of traditional finance professionals. This helped create a culture that was more akin to a research lab than a typical trading floor.
The use of probabilistic modeling, machine learning, and statistical arbitrage allowed Jane Street to find small inefficiencies in markets across thousands of instruments — equities, bonds, currencies, and derivatives — and trade them profitably.
What truly distinguished Jane Street was its technology-first philosophy. The company built nearly all its systems in-house, ensuring tight control, low latency, and adaptability. Its trading infrastructure allowed for lightning-fast execution — critical in markets where prices change in microseconds.
3. Mastering ETF Trading and Market Making
Jane Street’s early specialization in ETFs paid off enormously. As ETFs exploded in popularity worldwide, the firm became one of the largest ETF liquidity providers globally.
By constantly quoting buy and sell prices, Jane Street played a key role in ensuring that ETFs traded smoothly, even during volatile market conditions. It became the “invisible hand” behind countless trades — earning small margins but at massive volume.
During major market events, such as the 2008 financial crisis and the COVID-19 pandemic, Jane Street’s market-making capabilities were crucial in maintaining stability and liquidity. While many financial institutions pulled back, Jane Street stepped in — buying when others were fearful, providing prices when markets froze, and helping ensure continuous trading.
Their performance during crises cemented their reputation as a reliable backbone of modern markets.
4. Expansion into Global Markets
After conquering ETF trading, Jane Street expanded aggressively into new asset classes and regions. Offices were established in London, Hong Kong, and Amsterdam, transforming the firm into a truly global powerhouse.
The firm’s trading universe now includes:
Equities and ETFs across every major exchange
Fixed income instruments such as bonds and treasuries
Commodities and energy derivatives
Currencies (FX) and cryptocurrencies
Options and futures across various asset classes
Despite this diversification, Jane Street maintained a disciplined approach — only entering markets where its data-driven methods could yield a sustainable edge.
The company also became known for its cross-asset trading strategies — using correlations between asset classes to identify opportunities. For instance, changes in bond yields could signal moves in currencies or equity sectors, allowing Jane Street to capture value across interconnected markets.
5. The Technology Advantage
Technology is the beating heart of Jane Street’s rise. The firm’s internal systems are highly sophisticated, capable of handling massive data volumes in real-time. Every aspect — from pricing models and risk management to communication tools — is custom-built.
Jane Street uses the programming language OCaml for most of its systems, which is unusual in finance. OCaml allows for functional programming, helping the firm maintain robust, error-resistant, and efficient codebases. This gives them a stability advantage over competitors using more traditional financial software stacks.
Moreover, the firm’s automation and low-latency trading systems enable it to make decisions and execute orders faster than the human eye can blink. Yet, unlike many high-frequency trading (HFT) firms, Jane Street avoids reckless speed races. Instead, it uses technology strategically — focusing on smart execution, risk-adjusted returns, and long-term sustainability rather than pure velocity.
6. Culture: Collaboration and Intellectual Rigor
One of Jane Street’s most defining characteristics is its culture. Unlike the cutthroat environment typical of Wall Street, Jane Street emphasizes collaboration, transparency, and intellectual curiosity.
There are no large egos or “star traders” — everyone is encouraged to question, debate, and improve processes collectively. Meetings are analytical discussions rather than emotional arguments. Success is attributed to teams, not individuals.
The firm also has a flat organizational structure, where even junior employees are encouraged to contribute ideas. This approach fosters creativity and innovation — allowing new strategies to emerge from any level of the company.
Employees describe the culture as “academic yet pragmatic,” where curiosity is celebrated, and errors are treated as learning opportunities. This philosophy has helped Jane Street maintain consistency even as it scaled into a global enterprise.
7. The Role in Modern Market Liquidity
In today’s interconnected global markets, liquidity providers like Jane Street play an indispensable role. They ensure that buyers and sellers can transact efficiently without large price disruptions.
Jane Street’s algorithms continuously analyze order books, macroeconomic trends, and microstructure signals to offer tight bid-ask spreads — meaning better pricing for all market participants.
As markets have become more fragmented, with trades spread across dozens of exchanges, Jane Street’s ability to aggregate and balance liquidity across them gives it an enormous competitive advantage.
It’s estimated that the firm now trades trillions of dollars’ worth of securities annually, often accounting for a significant share of ETF trading volume globally.
8. Moving into Fixed Income and Cryptocurrencies
While equities and ETFs remain its backbone, Jane Street has successfully diversified into fixed income and digital assets — two of the most complex trading domains.
In fixed income markets, the firm became a major player in US Treasuries, corporate bonds, and interest rate derivatives. Its data-driven methods allow it to handle the opacity and illiquidity typical of bond markets more efficiently than many traditional banks.
Jane Street’s move into cryptocurrencies was another milestone. Unlike many firms that viewed crypto as speculative, Jane Street approached it with the same quantitative precision it applies to any asset. By becoming an early market maker for Bitcoin ETFs and crypto derivatives, it helped bring institutional stability to digital asset markets.
This adaptability — the ability to understand and trade emerging asset classes — showcases why Jane Street continues to stay ahead of the curve.
9. Risk Management and Discipline
For all its success, Jane Street’s longevity is built on one thing above all: risk control.
The firm operates on the principle that surviving bad days is more important than maximizing profits on good ones. Every trade is evaluated not just for potential return, but for its risk-adjusted value.
Sophisticated real-time risk management systems continuously monitor the firm’s positions across all markets, ensuring exposure stays within carefully defined limits.
Jane Street famously avoids “directional bets.” It doesn’t try to predict where markets will go — instead, it focuses on relative value trading, capturing small inefficiencies that exist between related securities. This disciplined, non-speculative philosophy has kept the firm stable even during turbulent times.
10. Jane Street’s Role in the 21st-Century Market Ecosystem
Today, Jane Street is more than a trading firm — it is a systemic player in global finance. Its algorithms help maintain efficient pricing across continents, its liquidity keeps ETFs and bonds flowing smoothly, and its risk discipline serves as a model for modern financial engineering.
Unlike investment banks, Jane Street doesn’t advise clients or manage portfolios; its business model is purely trading-based. Yet its impact rivals that of major banks.
As markets become increasingly electronic, data-driven, and cross-asset, firms like Jane Street are shaping the future architecture of global finance — where human intuition and machine intelligence coexist in harmony.
11. The Legacy and the Road Ahead
Jane Street’s rise reflects a broader transformation in finance — the shift from intuition-driven trading to algorithmic precision. It represents how intellectual humility, technological excellence, and a focus on long-term sustainability can outperform greed and speculation.
As artificial intelligence, blockchain, and decentralized finance (DeFi) evolve, Jane Street’s future will likely involve deeper integration of AI-powered models, quantum computing simulations, and global regulatory engagement.
But if its history is any guide, the firm will continue to adapt — quietly, intelligently, and effectively — without the need for flashy publicity or loud declarations.
Conclusion
The story of Jane Street is not just the story of a trading firm; it’s a story about the evolution of modern finance itself.
From its origins in ETF arbitrage to becoming one of the most dominant forces in global liquidity, Jane Street has shown that success in markets today comes not from speculation but from discipline, technology, collaboration, and continuous learning.
It stands as a testament to what finance can achieve when math meets markets, when data meets discipline, and when humility meets innovation.
In a world that often celebrates noise, Jane Street thrives in silence — executing billions in trades daily, quietly shaping the very structure of the global financial system.

Gold Continues to Struggle at 4000We're seeing a familiar story play out in gold as it makes multiple attempts to reclaim and hold above the 4000 level, but none of these efforts are showing the conviction we need to see from buyers. The price action on the hourly chart is particularly telling ,we're witnessing similar structural patterns repeating themselves, which often indicates indecision or a lack of strong directional commitment from either side. Once again, we've seen the rising support trendline get broken, which is not ideal for the bullish case in the short term.
However, there's a small silver lining worth noting. Today's CPR is showing an ascending structure, which typically carries some positive implications for intraday sentiment. It's not a game-changer by itself, but it does suggest that the technical setup isn't completely bearish. The key level to focus on for today's session is the CPR BC at 3971. This becomes our pivotal point ,if bulls can sustain trading above this level throughout the day, we could see another recovery attempt materialize toward the higher side. The ability to hold above 3971 would at least keep the door open for further upside exploration.
On the flip side, if we fail to maintain support at 3971 during the intraday session, it could trigger another leg down toward lower levels. Given the repetitive failed attempts at 4000 and the breakdown of support trendlines, the market is clearly at a crossroads here. We need to see some decisive action one way or the other to break out of this choppy, repetitive pattern.
As for my positioning, there's no change to my approach. I'm still holding my buy positions and actively managing the trades as this price action develops. The patience game continues, and while these repeated failures at 4000 are testing that patience, the broader picture still supports the long-term bullish thesis.
