CROMPTON 1 Week Time Frame 📉 1-Week Technical Outlook
Trend: The stock is currently in a "Strong Sell" position based on moving averages and other technical indicators, with 0 buy signals and 12 sell signals.
Relative Strength Index (RSI): The 14-day RSI stands at 28.72, indicating that the stock is in oversold territory.
Moving Averages:
5-day: ₹282.01
50-day: ₹287.02
200-day: ₹305.51
All moving averages suggest a bearish trend.
🔧 Key Support and Resistance Levels
Immediate Support: ₹281.32
Major Support: ₹274.88
Immediate Resistance: ₹296.02
Major Resistance: ₹304.28
A breakdown below ₹281.32 could lead to further declines, while a breakout above ₹296.02 may signal a reversal.
Trading

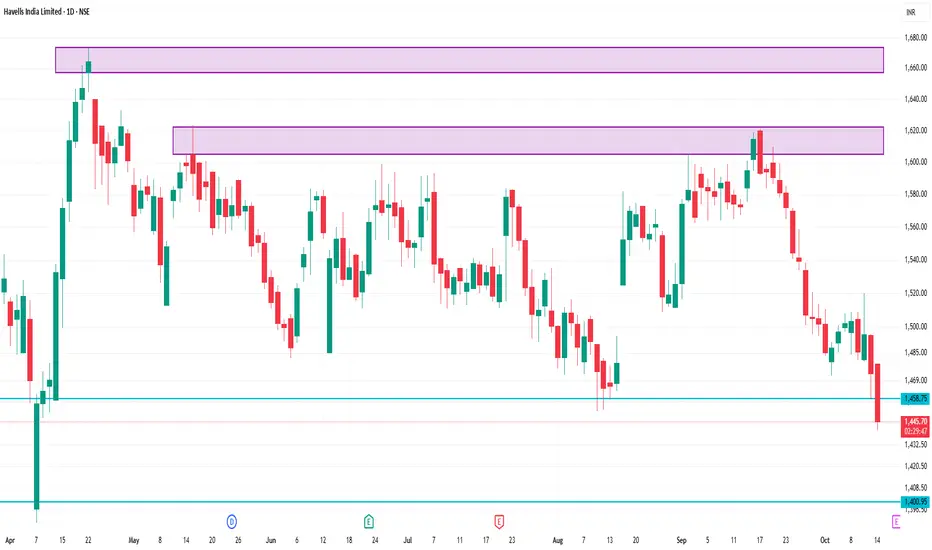
HAVELLS 1 Day Time Frame 📊 Key Support and Resistance Levels
Immediate Support: ₹1,477.53
Immediate Resistance: ₹1,527.85
Short-Term Support: ₹1,497.04
Short-Term Resistance: ₹1,538.60
Fibonacci Pivot Point: ₹1,462.70
These levels are derived from standard technical analysis tools and are relevant for intraday trading strategies.
📉 Technical Indicators
Relative Strength Index (RSI): 28.62 (indicating an oversold condition)
Moving Average Convergence Divergence (MACD): -9.64 (suggesting bearish momentum)
5-Day Moving Average: ₹1,465.36
50-Day Moving Average: ₹1,490.21
200-Day Moving Average: ₹1,547.08
These indicators collectively suggest a bearish trend in the short term.
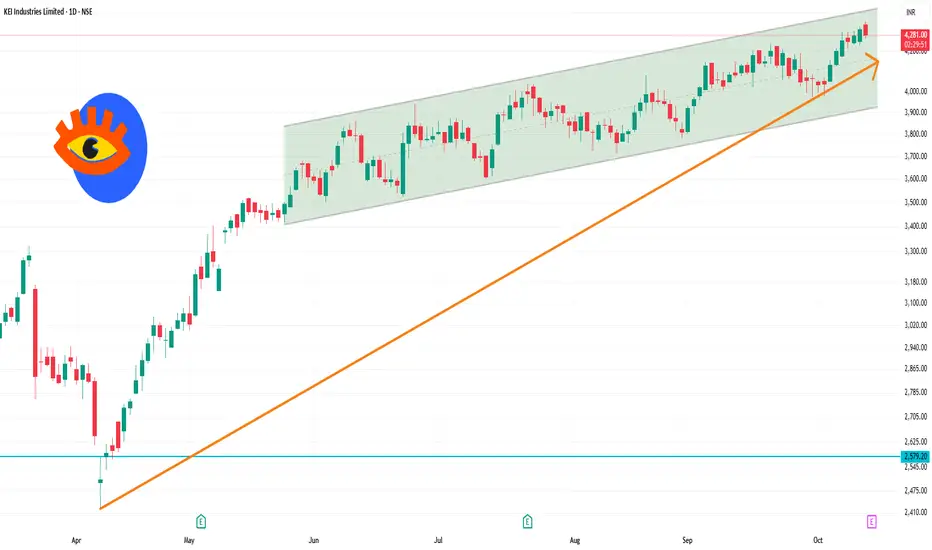
KEI 1 Day Time Frame 📊 Key Intraday Pivot Levels (Classic, Fibonacci, Camarilla)
Based on the previous day's price range, here are the calculated support and resistance levels:
Classic Pivot Points:
Pivot (P): ₹4,287.97
Resistance Levels:
R1: ₹4,348.63
R2: ₹4,385.67
R3: ₹4,446.33
Support Levels:
S1: ₹4,250.93
S2: ₹4,190.27
S3: ₹4,153.23
Fibonacci Levels:
Pivot (P): ₹4,287.97
Resistance Levels:
R1: ₹4,325.29
R2: ₹4,348.35
R3: ₹4,385.67
Support Levels:
S1: ₹4,250.65
S2: ₹4,227.59
S3: ₹4,190.27
Camarilla Levels:
Pivot (P): ₹4,287.97
Resistance Levels:
R1: ₹4,320.56
R2: ₹4,329.51
R3: ₹4,338.47
Support Levels:
S1: ₹4,302.64
S2: ₹4,293.69
S3: ₹4,284.73
These levels are derived from the previous day's high, low, and close prices and are widely used for intraday trading decisions.
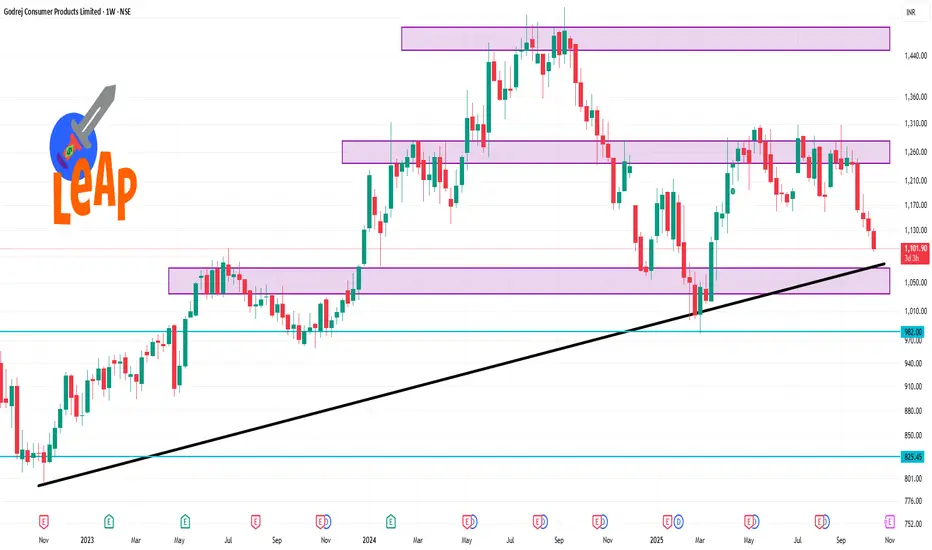
GODREJCP 1 Week Time Frame 📊 Weekly Support and Resistance Levels
Immediate Support: ₹1,112.83
Major Support: ₹1,095.87
Immediate Resistance: ₹1,153.93
Major Resistance: ₹1,178.07
Upper Range for the Week: ₹1,195.03
Lower Range for the Week: ₹1,071.73
📈 Technical Outlook
Trend: Bearish
RSI (14-day): 22.61 — indicating an oversold condition
MACD: -8.17 — suggesting a bearish trend
Moving Averages: All key moving averages (5-day to 200-day) are in a strong sell position, with no buy signals.
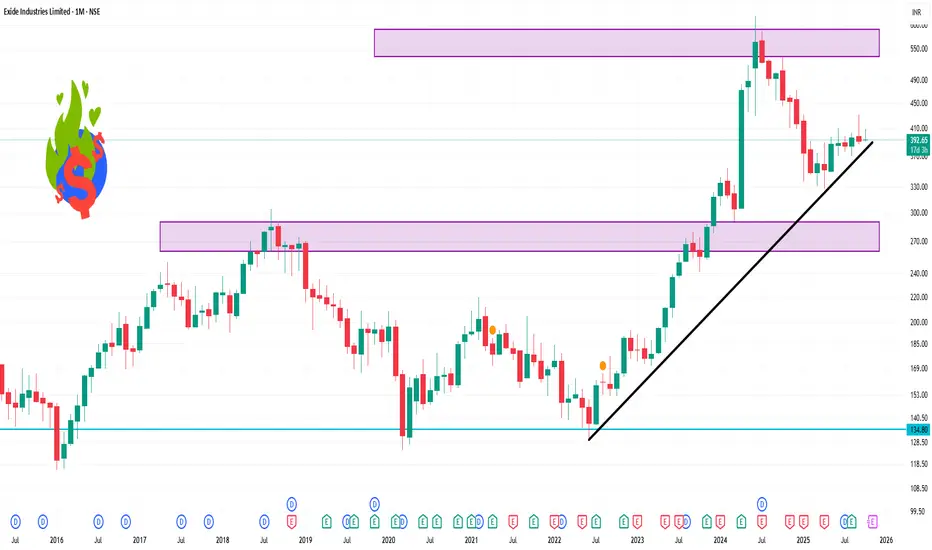
EXIDEIND 1 Month Time Frame 📊 1-Month Technical Overview
Price Performance:
Current Price: ₹393.15
1-Month Change: -5.73%
52-Week Range: ₹328.00 – ₹534.40
Technical Indicators:
RSI (14): 49.30 — Neutral
MACD: -1.72 — Buy Signal
ADX (14): 18.63 — Weak Trend
Pivot Points: Support at ₹385.58; Resistance at ₹409.28
Moving Averages:
5-Day EMA: ₹399.86 — Buy
20-Day EMA: ₹401.20 — Sell
50-Day EMA: ₹399.24 — Buy
100-Day EMA: ₹395.07 — Buy
200-Day EMA: ₹396.66 — Buy
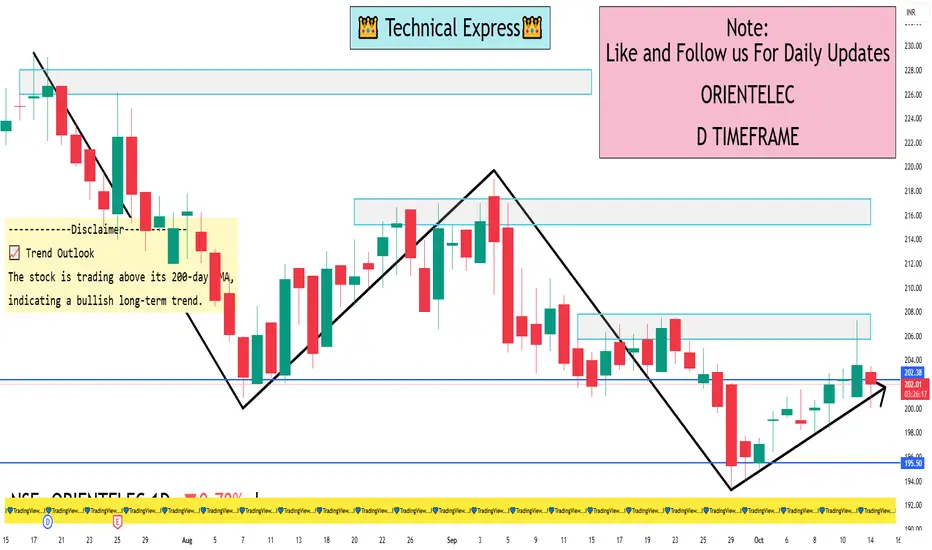
ORIENTELEC 1 Day View 📊 Intraday Support & Resistance Levels
Support Levels:
₹201.10
₹199.70
₹198.60
Resistance Levels:
₹203.50
₹204.70
₹206.00
These levels are derived from recent price action and pivot point analysis.
🔍 Technical Indicators
Relative Strength Index (RSI): 62.39 — indicates a bullish momentum without being overbought.
Moving Averages: The stock is above its 200-day exponential moving average (EMA), suggesting a positive long-term trend.
MACD: Neutral at 0.000, implying no strong directional momentum.
🔁 Pivot Points (Daily)
Central Pivot Point: ₹202.18
Resistance: ₹203.54 (R1), ₹204.65 (R2), ₹206.01 (R3)
Support: ₹201.07 (S1), ₹199.71 (S2), ₹198.60 (S3)
These levels are based on standard pivot point calculations and can help identify potential reversal zones.
Introduction and Types of Financial Markets1. Introduction to Financial Markets
A financial market is a marketplace where buyers and sellers engage in trading financial assets such as stocks, bonds, currencies, and derivatives. These markets play a crucial role in the financial system by ensuring the allocation of resources, facilitating liquidity, and enabling price discovery.
1.1 Definition
Financial markets can be defined as structured systems through which financial instruments are issued, bought, sold, or exchanged. These instruments represent claims on real assets or future income and include equities, debt instruments, currencies, and derivatives.
Key definitions:
Investopedia: "A financial market is any marketplace where trading of securities occurs, including the stock market, bond market, forex market, and derivatives markets."
Mishkin and Eakins: "Financial markets are markets where funds are transferred from savers to borrowers."
1.2 Importance of Financial Markets
Financial markets serve as a backbone for economic growth. Some of their major functions include:
Capital Formation: Financial markets channel funds from savers to investors, facilitating business expansion and economic development.
Liquidity: Investors can quickly buy or sell financial instruments, ensuring access to cash when needed.
Price Discovery: Financial markets determine the price of assets based on supply and demand dynamics.
Risk Management: Markets offer instruments such as derivatives to hedge against price fluctuations.
Efficiency: Efficient markets ensure optimal allocation of resources, reducing the cost of capital for businesses.
Economic Indicator: The performance of financial markets often reflects the health of an economy.
2. Key Functions of Financial Markets
Financial markets are not just for trading—they perform several vital functions that sustain the economy:
Mobilization of Savings: They attract individual and institutional savings and channel them into productive investments.
Facilitating Transactions: They enable the smooth transfer of funds between buyers and sellers.
Reducing Transaction Costs: Standardized processes reduce the cost of trading and make markets efficient.
Providing Marketability: Investors can sell securities quickly in liquid markets without significant losses.
Credit Availability: Financial markets provide mechanisms for borrowing and lending funds for various purposes.
Investment Opportunities: They provide diverse options for investing based on risk-return preferences.
Regulation and Stability: Well-regulated financial markets ensure transparency, fairness, and stability.
3. Classification of Financial Markets
Financial markets can be classified based on different criteria, such as the type of instrument traded, maturity period, and mode of trading. Broadly, they are divided into money markets and capital markets.
3.1 Money Market
The money market deals with short-term debt instruments that typically mature within one year. It is essential for managing liquidity in the economy.
Characteristics:
Short-term instruments
Low risk and low returns
High liquidity
Participants include commercial banks, corporations, and governments
Major Instruments in Money Market:
Treasury Bills (T-Bills): Government-issued short-term securities with maturities ranging from 91 to 364 days.
Commercial Paper (CP): Unsecured, short-term promissory notes issued by corporations to meet working capital needs.
Certificates of Deposit (CDs): Time deposits offered by banks, tradable in secondary markets.
Repurchase Agreements (Repos): Short-term borrowing using securities as collateral.
Significance: Money markets allow governments, banks, and corporations to efficiently manage short-term funding requirements.
3.2 Capital Market
The capital market deals with long-term securities with maturities beyond one year. It is divided into the primary market and the secondary market.
3.2.1 Primary Market
The primary market is where new securities are issued for the first time. It is crucial for capital formation.
Initial Public Offering (IPO): Companies raise funds from the public by issuing shares.
Follow-on Public Offer (FPO): Additional shares are issued by a company after an IPO.
Private Placements: Securities are sold directly to a limited number of institutional investors.
Rights Issue: Existing shareholders are offered new shares proportionate to their holdings.
Significance: The primary market provides the initial funding for companies, helping them expand operations and invest in growth.
3.2.2 Secondary Market
The secondary market is where previously issued securities are traded between investors.
Stock Exchanges: Organized platforms like NYSE, NASDAQ, and NSE facilitate trading of equities.
Over-the-Counter (OTC) Market: Securities are traded directly between parties without a centralized exchange.
Significance: Secondary markets provide liquidity, enabling investors to buy or sell securities easily, while also helping in price discovery.
4. Types of Financial Markets Based on Instruments
Apart from the money and capital market distinction, financial markets can also be classified based on instruments:
4.1 Stock Market (Equity Market)
Deals in company shares.
Provides investors ownership in corporations.
Helps companies raise equity capital for growth.
Examples: NYSE, NASDAQ, BSE, NSE.
4.2 Bond Market (Debt Market)
Deals in bonds and debentures issued by governments and corporations.
Investors lend money and receive periodic interest.
Less risky than equities but offer fixed returns.
Examples: Government bond markets, corporate bond markets.
4.3 Foreign Exchange Market (Forex)
Involves the trading of currencies.
Ensures liquidity for international trade and investment.
Influenced by macroeconomic factors like inflation, interest rates, and geopolitical events.
Participants: Central banks, commercial banks, multinational corporations, and retail traders.
4.4 Derivatives Market
Deals in contracts whose value is derived from underlying assets like stocks, bonds, currencies, or commodities.
Includes futures, options, swaps, and forwards.
Used for hedging risk and speculation.
Significance: Derivatives help investors manage financial risk efficiently.
4.5 Commodity Market
Trades raw materials like gold, silver, oil, and agricultural products.
Includes spot markets (immediate delivery) and futures markets (delivery at a future date).
Provides a platform for price discovery and risk management.
4.6 Cryptocurrency Market
Emerging digital asset market trading cryptocurrencies like Bitcoin, Ethereum, and stablecoins.
Operates 24/7 globally, often outside traditional financial systems.
High risk but offers significant opportunities for diversification and speculative trading.
5. Classification Based on Trading Mechanism
Financial markets can also be divided based on how trading occurs:
Organized/Exchange-Traded Markets: Regulated platforms with standardized contracts, like stock exchanges.
Over-the-Counter (OTC) Markets: Decentralized trading between two parties, e.g., Forex OTC markets.
Electronic/Online Markets: Internet-based platforms facilitating global trading with high efficiency and low costs.
6. Participants in Financial Markets
Financial markets include a wide range of participants who perform specific functions:
Investors: Individuals and institutions seeking returns.
Issuers: Companies and governments raising funds.
Intermediaries: Banks, brokers, and investment firms facilitating transactions.
Regulators: Authorities like SEBI, SEC, and RBI ensuring transparency and protecting investors.
Speculators: Traders aiming to profit from price fluctuations.
Hedgers: Participants managing risk using derivatives or other financial instruments.
7. Modern Trends in Financial Markets
Globalization: Markets are increasingly interconnected, enabling cross-border capital flows.
Technological Advancements: High-frequency trading, blockchain, and AI-driven analytics are transforming trading.
Sustainable Finance: ESG and green bonds are gaining importance.
Cryptocurrencies & Digital Assets: Digital currencies are expanding market opportunities.
Fintech Innovations: Mobile trading platforms and robo-advisors are democratizing access to markets.
8. Conclusion
Financial markets are the lifeblood of modern economies, facilitating the flow of capital, promoting investment, and enabling risk management. From money markets dealing with short-term debt instruments to capital markets providing long-term funding, each segment has a distinct role in economic development.
The evolution of financial markets—from traditional equity and debt instruments to sophisticated derivatives and digital assets—highlights their adaptability and centrality to global financial stability. Understanding these markets is essential for investors, policymakers, and businesses seeking to navigate the complex financial landscape efficiently.
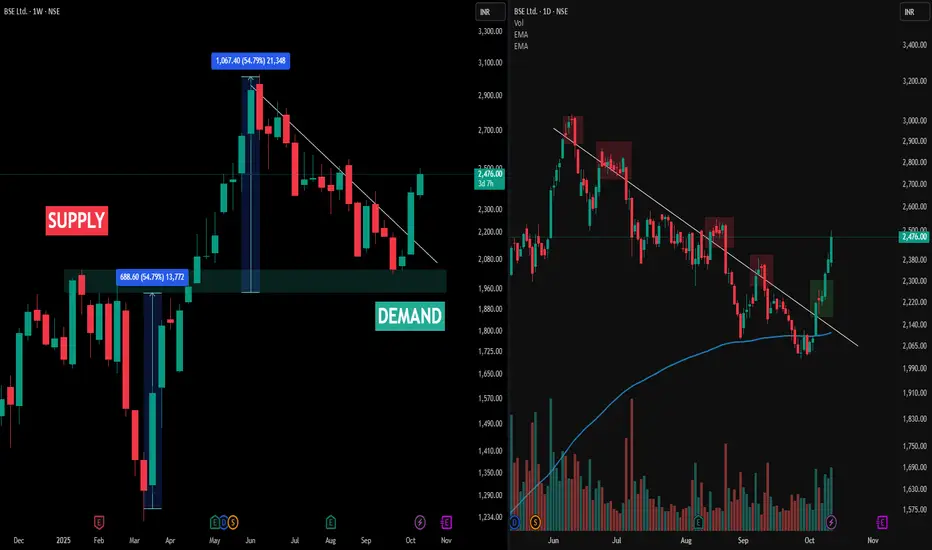
Multi-Timeframe Observation: BSE Ltd• The image above presents a multi-timeframe view of BSE Ltd (NSE), with the left side displaying the Weekly Timeframe (WTF) chart and the right side showing the Daily Timeframe (DTF) chart. The weekly chart highlights the main demand and supply zones, with large upward moves originating from demand and visible percentage swings marked for clarity.
• A key observation is the Change of Trend (CT) line. On the weekly chart (left), price action repeatedly challenged but never closed above the CT, indicating resistance at this structural level. This is confirmed on the daily chart (right), where each significant upward move into the CT region is marked by red boxes—showing failed attempts to sustain above the CT and repeated rejections.
• The green box on the daily chart points to a recent bounce from demand, but the price still faces resistance at the CT as per the weekly structure. Consistent volume activity and price response across both timeframes offer a crystal clear illustration of trend dynamics and supply-demand interplay. The post is strictly an analytical observation of price structure, not a prediction or recommendation.
Disclaimer
This post is intended for observational and educational purposes only. It does not constitute financial advice or recommend any trading action. Please consult a certified financial advisor and conduct your own research before making investment decisions.
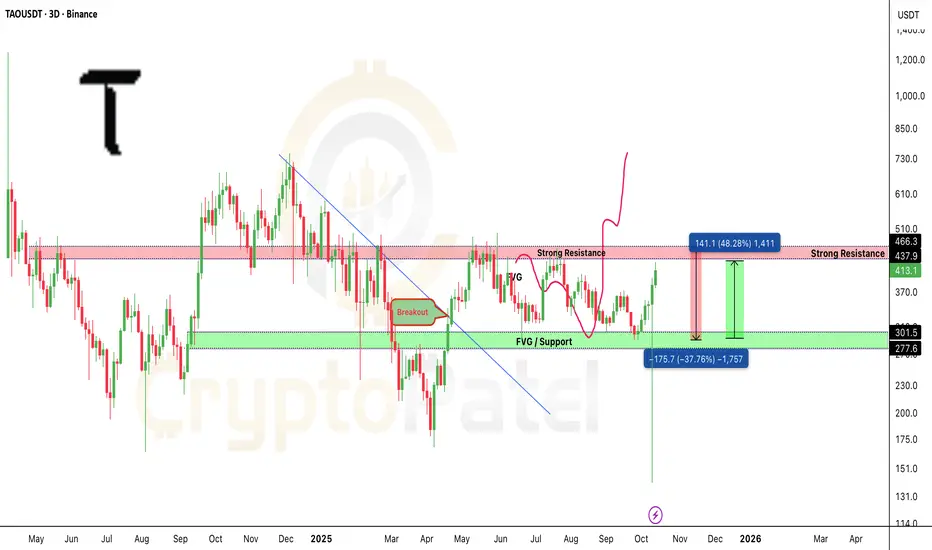
TAO/USDT did as I Mentioned and Now ready to $1000?GETTEX:TAO Update 🚀
Our $300–$250 entry got filled perfectly during the retracement, just as planned.
Now GETTEX:TAO is up 48% from our accumulation zone and momentum looks strong.
Technically, structure is still bullish:
✅ Strong Bounced Back
✅ Volume expansion
✅ FVG confirmation
I’m eyeing $1000 as my first major target in this bull run.
Smart Money bought the dip. Now the trend does the talking.
NFa & DYOR
Part 9 Trading Master Class With Experts Option Chain and Market Data
Traders analyze the option chain—a table showing available strikes, premiums, and open interest.
Key Insights from Option Chain:
Open Interest (OI):
High OI at a strike → strong support or resistance zone.
Change in OI:
Helps identify where traders are building positions.
Put-Call Ratio (PCR):
Indicator of market sentiment.
PCR > 1 → bullish sentiment; PCR < 1 → bearish.
Option chain analysis helps identify market bias, expected ranges, and potential breakout zones.

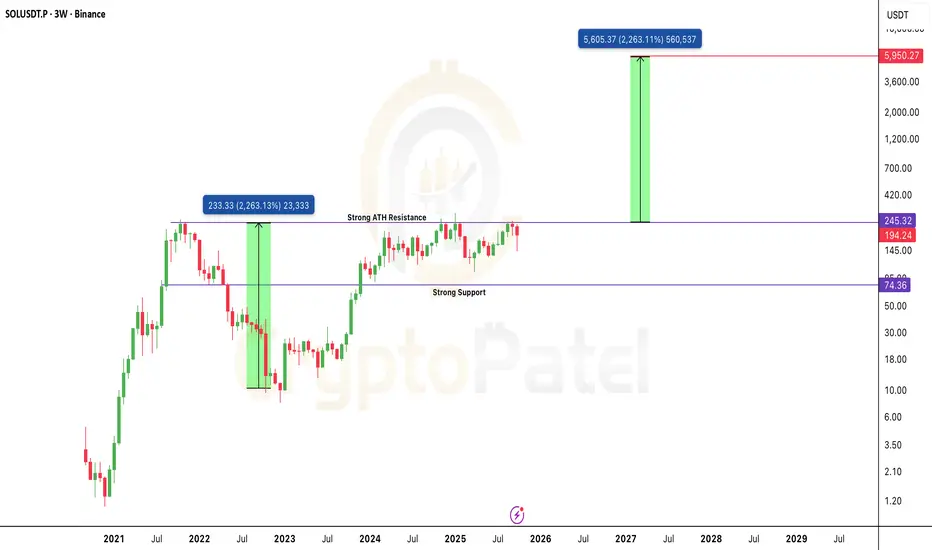
The Chart That Could Send $SOL to $6,000: Cup & Handle on 3W TFThe Chart That Could Send CRYPTOCAP:SOL to $6,000: Cup & Handle on 3W Timeframe
Solana is shaping one of the cleanest Cup & Handle patterns on the 3-Week chart, a formation that often signals the start of a massive long-term rally.
Technical Structure
🔹 Cup formed: $260 → $8 → back to $245 — a perfect rounded recovery base.
🔹 Handle forming: Price consolidating between $140–$245, building pressure before breakout.
🔹 Breakout trigger: Clean close above $245 (ATH zone) will confirm the move.
🔹 Targets:
– First target: $480–$500
– Extended target: $2,000–$6,000 if momentum mirrors the last 2200% run.
🔹 Major Support: $74–$90 zone.
What this really means: Solana is quietly preparing for its next macro expansion phase.
A confirmed breakout above ATH could kickstart one of the strongest alt rallies of this cycle.
Bias: Bullish on breakout confirmation
Timeframe: 3W / Long-Term Swing Setup
Plan: Watch $245 zone closely, breakout with volume = game on.
Note: NFA & DYOR
Part 3 Learn Institutional Trading Introduction to Option Trading
Option trading is one of the most powerful tools in the financial markets. It allows traders and investors to speculate on price movements, hedge risks, and generate income in various market conditions. Unlike traditional stock trading—where you buy or sell shares directly—option trading gives you the right but not the obligation to buy or sell an asset at a predetermined price within a specified period.
In simple words, options give you flexibility. You can profit whether the market goes up, down, or stays flat—if you know how to use them properly. However, this flexibility also brings complexity. To understand option trading deeply, one needs to grasp how options work, the factors affecting their price, and the strategies traders use to make consistent returns.

Part 2 Ride The Big Moves Advantages of Option Trading
Leverage:
A small premium can control a large amount of the underlying asset.
Flexibility:
You can profit in bullish, bearish, or neutral markets using different strategies.
Defined Risk:
Option buyers’ risk is limited to the premium paid.
Income Generation:
Selling options can create consistent income streams through premiums.
Hedging:
Options protect existing positions against adverse price movements.

Part 2 Intraday Master ClassThere are two main types of options — Call Options and Put Options.
a) Call Option
A Call Option gives the buyer the right (but not the obligation) to buy the underlying asset at a specified price (strike price) before the expiration date.
Buyers of call options are bullish — they expect the price of the asset to rise.
Sellers of call options are bearish or neutral — they believe the price will stay below the strike price.
b) Put Option
A Put Option gives the buyer the right to sell the underlying asset at a specific strike price before the expiration date.
Buyers of put options are bearish — they expect the price of the asset to fall.
Sellers of put options are bullish or neutral — they believe the price will stay above the strike price.

Part 1 Intraday Master ClassIntroduction to Option Trading
Option trading is one of the most dynamic, flexible, and powerful financial instruments in the modern market. It allows investors not only to profit from price movements but also to protect their portfolios, speculate, or earn regular income. Unlike buying stocks directly, options give traders the right but not the obligation to buy or sell an underlying asset (like a stock, index, or commodity) at a predetermined price within a certain time frame.

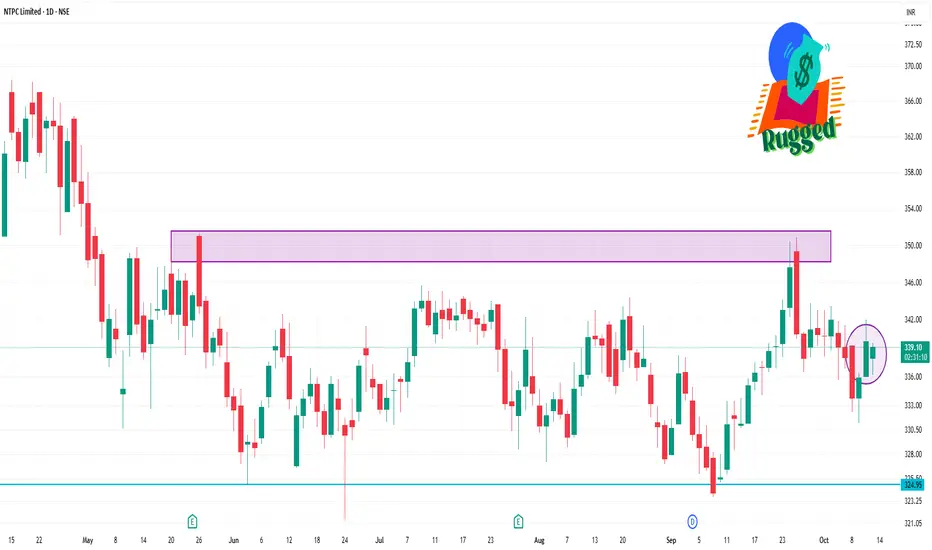
NTPC 1 Day Time Frame📈 Intraday Support & Resistance Levels
Immediate Support: ₹337.29
Immediate Resistance: ₹340.85
Key Pivot Point: ₹339.20
These levels are derived from standard pivot point calculations and are commonly used by traders for short-term strategies.
🔍 Technical Indicators
Relative Strength Index (RSI): 53.93 — indicating a neutral market condition.
Moving Average Convergence Divergence (MACD): 0.330 — suggesting a bullish trend.
5-Day Moving Average: ₹338.45 — supporting a bullish outlook.
50-Day Moving Average: ₹338.05 — reinforcing the bullish trend.
200-Day Moving Average: ₹336.12 — indicating long-term bullish sentiment.
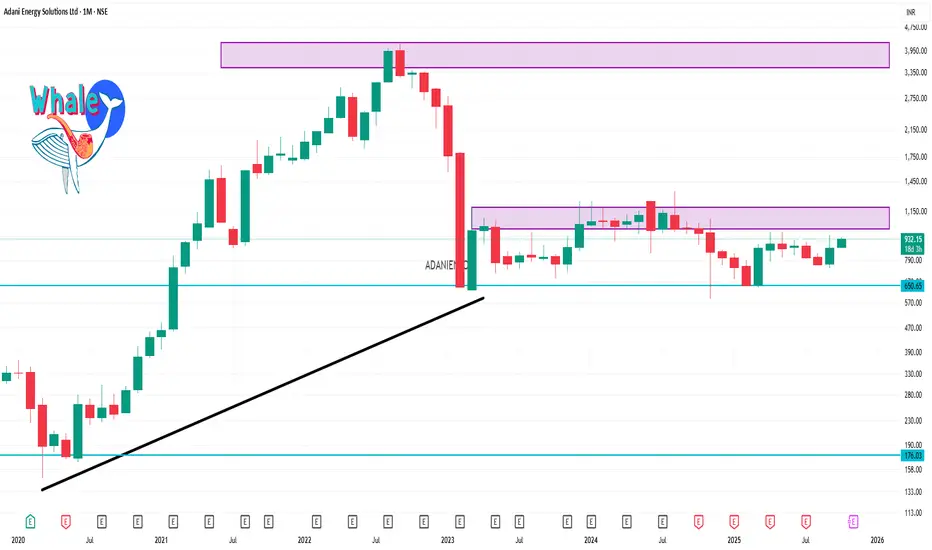
ADANIENSOL 1 Month Time Frame 📈 Current Stock Price (NSE)
Price: ₹925.85
Day Range: ₹920.85 – ₹934.00
52-Week Range: ₹588.00 – ₹1,090.95
Market Cap: ₹111,227 crore
P/E Ratio: 41.95
Dividend Yield: 0.00%
🔍 Technical Analysis (1-Month Outlook)
Trend Indicators
1-Month Rating: Buy
1-Week Rating: Buy
Overall Trend: Strong Buy
Key Technical Indicators
RSI (14-day): 52.97 (Neutral)
MACD: 2.12 (Buy Signal)
Moving Averages:
5-Day EMA: ₹920.80
10-Day EMA: ₹909.40
20-Day EMA: ₹886.80
Support & Resistance Levels
Resistance:
First: ₹934.20
Second: ₹942.55
Third: ₹952.15
Support: ₹920.85 (Day Low)
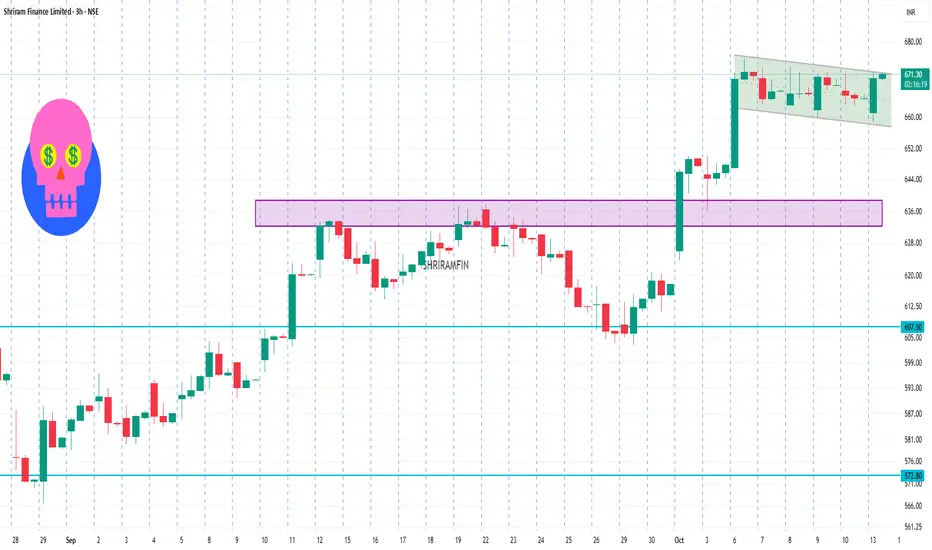
SHRIRAMFIN 3 Hour Time Frame📊 3-Hour Timeframe Technical Levels
Current Price: ₹669.70
Pivot Points:
S1: ₹666.48
Pivot: ₹669.97
R1: ₹674.88
R2: ₹678.37
R3: ₹682.87
Fibonacci Levels:
Retracement:
23.6%: ₹658.34
38.2%: ₹647.73
50%: ₹639.15
61.8%: ₹630.57
76.4%: ₹619.96
Projection:
23.6%: ₹682.21
38.2%: ₹692.82
50%: ₹701.40
61.8%: ₹709.98
76.4%: ₹720.59
Extension:
123.6%: ₹753.14
138.2%: ₹775.18
150%: ₹793.00
161.8%: ₹810.82
176.4%: ₹832.86
Camarilla Levels:
R4: ₹669.67
R3: ₹666.59
R2: ₹663.51
R1: ₹660.43
S1: ₹657.72
S2: ₹654.07
S3: ₹650.55
S4: ₹647.83
Woodie's Levels:
R1: ₹669.25
R2: ₹674.53
R3: ₹679.25
S1: ₹660.85
S2: ₹657.72
S3: ₹654.57
Demark Levels:
R1: ₹668.23
R2: ₹672.50
S1: ₹659.82
S2: ₹665.30
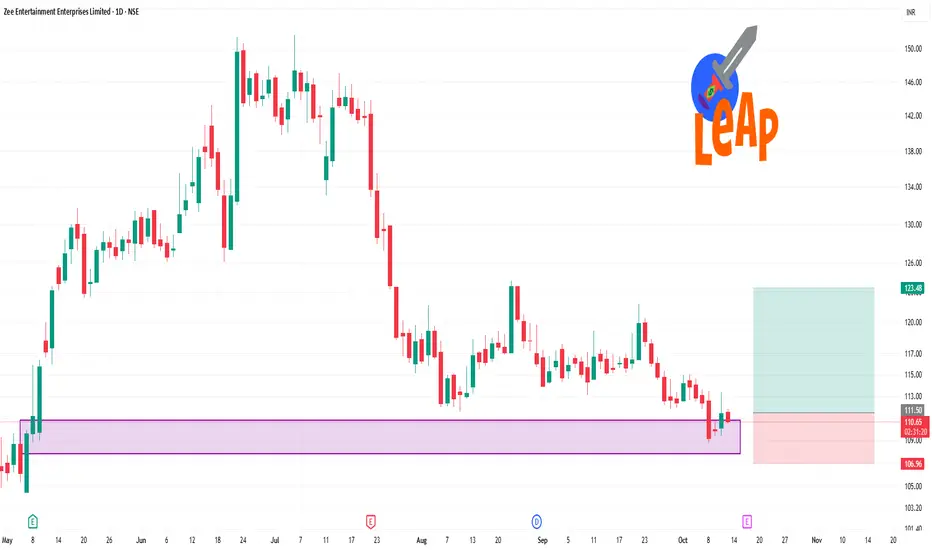
ZEEL 1 Day Time Frame 📊 Daily Technical Levels:
Pivot Point (CPR): ₹111.39
Support Levels:
S1: ₹109.43
S2: ₹107.44
S3: ₹105.48
Resistance Levels:
R1: ₹113.38
R2: ₹115.34
R3: ₹117.33
These levels are based on standard pivot point calculations and are useful for identifying potential reversal points.
📈 Market Sentiment:
The stock's recent performance has been influenced by factors such as a 14% year-on-year decline in revenue and a 16% quarter-on-quarter drop, primarily due to reduced advertising revenue.
Reuters
⚠️ Conclusion:
The current technical indicators and market sentiment suggest a cautious approach. Traders should monitor the support and resistance levels closely and consider the broader market conditions before making investment decisions.
SBIN 1 Month Time Frame📊 1-Month Technical Summary
Overall Rating: Strong Buy
Technical Indicators:
Relative Strength Index (RSI): 71.165 – Suggests the stock is in overbought territory but still indicates buying momentum.
Moving Averages:
5-Day: ₹883.14
50-Day: ₹868.70
200-Day: ₹845.81
MACD: 5.170 – Indicates a bullish trend.
🔄 Pivot Levels (Classic Method)
Resistance Levels:
R1: ₹883.35
R2: ₹884.85
R3: ₹887.20
Support Levels:
S1: ₹879.50
S2: ₹877.15
S3: ₹875.65
Pivot Point: ₹881.00

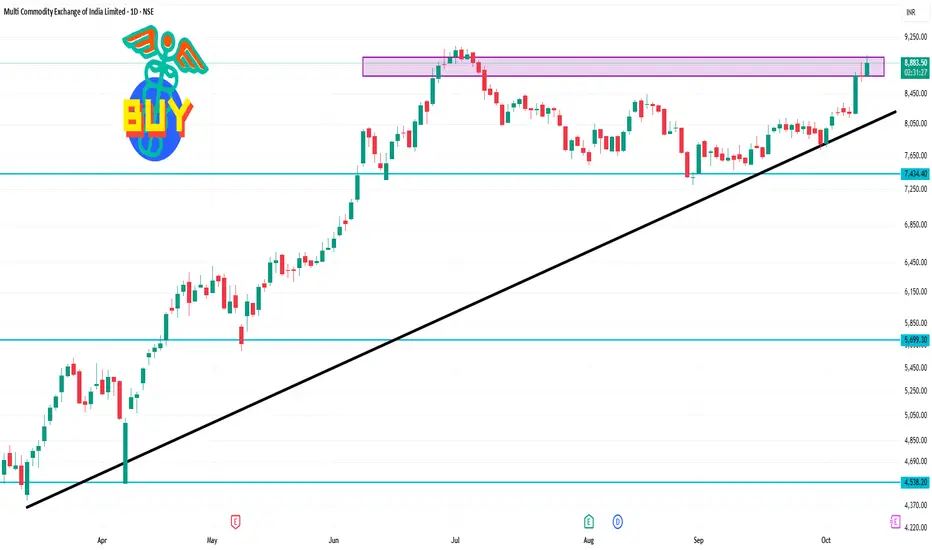
MCX 1 Day Time Frame Opening Price: ₹8,700.00
Day’s High: ₹8,988.00
Day’s Low: ₹8,700.00
Previous Close: ₹8,688.50
Volume: 610,010 shares traded
VWAP (Volume-Weighted Average Price): ₹8,893.80
Technical Indicators:
According to TradingView, the 1-day technical analysis for MCX indicates a strong buy signal, with the majority of indicators, including moving averages and oscillators, supporting this trend. However, the oscillator readings are currently neutral, suggesting a balanced market momentum.
LiamTrading – GOLD: Continuing the trend towards 4,130Gold has broken 4,060 and set a new historical peak thanks to the US-China trade tensions and the expectation of an early Fed rate cut. The main trend remains upward; the next target level according to the channel structure is 4,130.
Technical H4→H1
The upward channel has been maintained for several weeks; breaking 4,060 confirms continuation.
Nearest liquidity zone: 4,030–4,032.
Medium-term volume POC: ~3,988.
Target/resistance clusters by rhythm: 4,050 → 4,072 → 4,088 → 4,100 → 4,130.
Trading Plan
Buy 1 (retracing to the liquidity zone)
Entry: 4,030–4,032
SL: 4,025
TP: 4,050 → 4,072 → 4,088 → 4,100 → 4,130
Buy 2 (medium-term POC)
Entry: 3,988
SL: 3,980
TP: 4,022 → 4,050 → 4,088 → 4,100 → 4,130
Sell reaction (higher risk)
Entry: 4,130
SL: 4,140
TP: flexible according to price reaction; prioritize closing at 4,070 if a clear rejection candle appears.
Invalidation: short-term upward structure weakens if H1 closes below 3,980.
Quick Notes
Prioritize “buy-the-dip” at 4,03x and 3,988; sell orders are only reaction trades at 4,130.
When TP1 is reached, move SL to entry to protect the position.
Volatility around US data release times may create false breaks; maintain disciplined risk management.
I will provide immediate updates as price paths change, real-time trading is the best way to be accurate and successful.

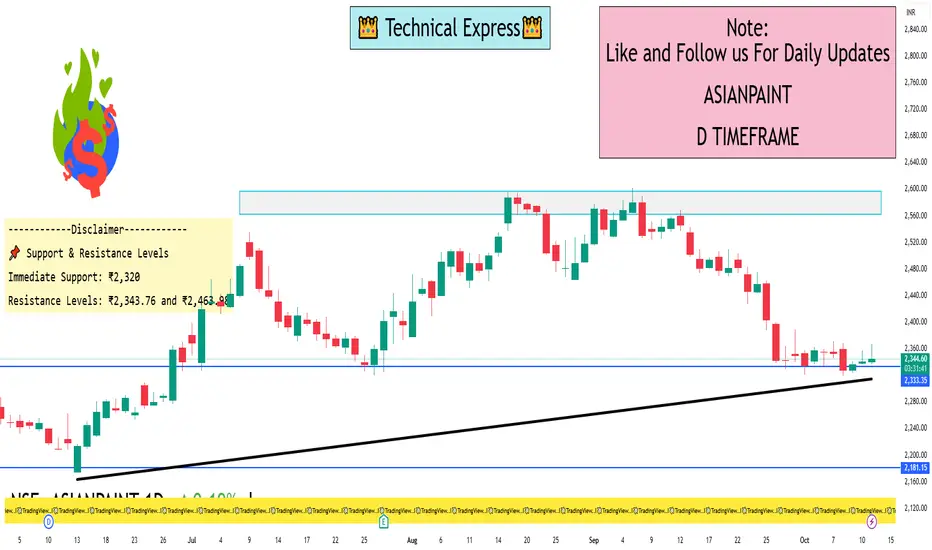
ASIANPAINT 1 Day View📈 Current Price & Trading Range
Current Price: ₹2,357.70
Day’s Range: ₹2,337.00 – ₹2,366.60
Previous Close: ₹2,340.20
52-Week Range: ₹2,124.75 – ₹3,103.55
📊 Technical Indicators
RSI (14-day): 38.17 — indicating a neutral to bearish condition.
MACD: -41.59 — suggesting bearish momentum.
Stochastic RSI: 10.76 — points to an oversold condition, possibly signaling a reversal.
Rate of Change (ROC): -1.93 — reflects downward momentum.
Commodity Channel Index (CCI): -1.93 — supports the bearish outlook.
Average Directional Index (ADX): 32.54 — indicates a strong trend, confirming the downtrend.
Parabolic SAR: ₹2,320 — suggests a bearish trend continuation.
Supertrend: ₹2,444 — aligns with the bearish trend.
📌 Summary
Asian Paints Ltd. is currently in a bearish phase on the 1-day timeframe. Key support at ₹2,320 is crucial; a breach could lead to further declines. Conversely, a rebound above ₹2,463.98 might indicate a potential trend reversal.