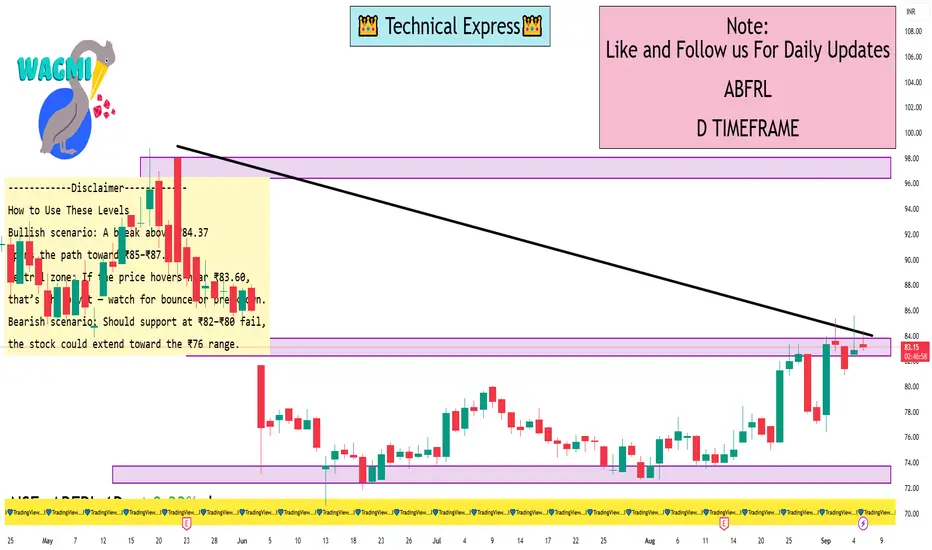
ABFRL 1 Day ViewKey Intraday Support & Resistance Levels (1-Day Timeframe)
Here’s a breakdown of the technical levels for ABFRL on a daily (1-day) timeframe:
Pivot Points & Fibonacci Levels (TopStockResearch as of Sept 5, 2025)
Standard daily pivots:
Support: S1 = ₹83.59, S2 = ₹81.59, S3 = ₹80.29, S4 = ₹78.29
Pivot: ₹84.89
Resistance: R1 = ₹86.89, R2 = ₹88.19
Camarilla pivots confirming nearby support/resistance zone
MunafaSutra Intraday Levels
One source reports:
Resistance: ₹78.09
Short-term support/resistance: ₹80.24 / ₹76.48
Another indicates:
Resistance: ₹77.42
Support/resistance: ₹78.26 / ₹75.82
These shorter-term numbers appear based on earlier data and may have shifted slightly. The pivot-based levels from TopStockResearch are likely more up-to-date and relevant for today’s intraday outlook.
Fibonacci Retracement Levels (from recent uptrends)
Retracement (support) zones from trend beginnings (e.g., June 13–Sept 4):
Near support areas: ₹79.85, ₹78.07, ₹76.30, ₹74.10
Projection (resistance) levels: ₹86.43, ₹88.63, ₹90.40, ₹92.18, ₹94.38
Gap Resistance & Candlestick Patterns
A gap resistance zone exists around ₹84, which may act as a near-term target if bullish momentum continues. Recent candlestick activity (inverted hammer, bullish pin bar) hints at potential short-term reversal strength
Trading
Macro Events: The Forces That Shape Global Markets1. Introduction to Macro Events
In financial markets, price movements are never random. Behind every rally, crash, or sideways trend lies a set of fundamental forces—commonly referred to as macro events. These events are large-scale, economy-wide developments that affect not just one company or sector, but entire markets, regions, and even the global economy. Traders, investors, policymakers, and institutions constantly monitor macro events because they set the tone for risk appetite, liquidity, and asset pricing.
Macro events may arise from economic data, central bank decisions, geopolitical tensions, or structural shifts like technological change. A trader who ignores them risks being blindsided by sudden volatility. On the other hand, a trader who understands them gains an edge in predicting sentiment and positioning portfolios.
To fully grasp their importance, let’s break down the types of macro events, their market impacts, and how history has demonstrated their power.
2. Types of Macro Events
2.1 Economic Data Releases
Economic data releases are the heartbeat of financial markets. Reports like GDP growth, inflation, employment, consumer spending, and manufacturing activity act as “check-ups” for the health of an economy.
Nonfarm Payrolls (U.S.) – Traders worldwide treat this monthly report as a market-moving event. A strong jobs number signals robust growth (positive for stocks but negative for bonds as rates may rise). A weak number fuels expectations of rate cuts.
Inflation Data (CPI, PPI) – Inflation is closely tied to central bank actions. Surging inflation pressures interest rates higher, hurting equities but boosting bond yields and commodities.
GDP Growth – A country’s output growth rate sets the long-term trajectory of corporate earnings, trade balances, and investor flows.
Markets move not only on the numbers themselves but also on how they compare with expectations. A surprise deviation often triggers sharp intraday volatility.
2.2 Central Bank Policies
Few macro events move markets as strongly as central bank decisions. Whether it’s the U.S. Federal Reserve, the European Central Bank, or the Reserve Bank of India, monetary policy sets the cost of capital and liquidity across the system.
Key tools include:
Interest Rate Decisions – Hikes cool inflation but dampen equity rallies; cuts stimulate growth but weaken currencies.
Quantitative Easing (QE) – Large-scale asset purchases inject liquidity, boosting risk assets like stocks and real estate.
Forward Guidance – Even a single phrase in a central banker’s speech can send bond yields or currencies into a tailspin.
For example, when the Fed cut rates aggressively in 2020 to support markets during COVID-19, U.S. equities staged a massive rebound despite the global health crisis.
2.3 Geopolitical Developments
Geopolitics introduces uncertainty—something markets dislike. Wars, conflicts, trade disputes, and diplomatic standoffs can all shake investor confidence.
Wars & Conflicts – The Russia-Ukraine war (2022) disrupted energy and food supplies, triggering global inflation.
Trade Wars – The U.S.-China trade war (2018–2019) raised tariffs and unsettled supply chains, causing market turbulence.
Diplomatic Summits – Agreements at events like G20 summits or OPEC meetings can shift global commodity prices overnight.
Geopolitical risks often push investors into safe havens such as gold, U.S. Treasuries, or the Swiss franc.
2.4 Commodity & Energy Shocks
Energy is the backbone of the global economy, making oil, natural gas, and key commodities highly sensitive to macro events.
Oil Price Shocks – OPEC’s 1973 embargo quadrupled oil prices, plunging the world into recession.
Food Commodity Shocks – Weather disruptions and supply bottlenecks cause spikes in wheat, rice, or soybean prices, fueling inflation and social unrest.
Metals & Rare Earths – Strategic minerals used in technology and defense often become geopolitical tools.
Traders in commodities often live and breathe macro headlines because supply disruptions or political moves can swing prices violently.
2.5 Fiscal Policies & Government Actions
Governments wield enormous influence over economies through taxation, spending, and reforms.
Budget Announcements – India’s Union Budget or the U.S. Federal Budget shapes growth expectations, subsidies, and corporate profitability.
Tax Reforms – Cuts often boost stock markets (short term), while hikes may dampen business sentiment.
Stimulus Packages – Large-scale spending, such as the U.S. CARES Act during COVID-19, directly fuels liquidity and consumption.
Fiscal actions usually complement or counterbalance central bank policies.
2.6 Global Trade & Supply Chain Events
Globalization has tightly interconnected economies, meaning a shock in one part of the chain can ripple worldwide.
Port Blockages – The 2021 Suez Canal blockage halted 12% of world trade in a matter of days.
Semiconductor Shortages – The 2020–2022 chip shortage disrupted auto and electronics sectors globally.
Pandemic Restrictions – Lockdowns and border closures caused logistical nightmares for exporters and importers.
For equity analysts, supply chain disruptions translate into earnings downgrades and margin pressures.
2.7 Financial Crises & Black Swan Events
Sometimes macro events come as shocks—rare, unpredictable, but catastrophic.
2008 Global Financial Crisis – Triggered by subprime mortgage collapse, this event nearly froze global credit markets.
COVID-19 Pandemic – A health crisis turned into an economic shock, shrinking global GDP and reshaping industries.
Currency Collapses – Hyperinflation in Venezuela or Turkey’s lira crash illustrates how quickly confidence can vanish.
Black swans emphasize the need for diversification, hedging, and scenario planning.
3. Impact of Macro Events on Markets
3.1 Equities
Stock markets reflect expectations of future earnings. Macro events shift those expectations:
Positive GDP growth → bullish equities.
Rate hikes → bearish for growth stocks.
Wars/conflicts → sectoral winners (defense, energy) but broad market losses.
3.2 Bonds
Bonds are highly sensitive to macro signals, especially inflation and interest rates.
Rising inflation → falling bond prices (yields up).
Recession fears → investors flock to bonds, pushing yields down.
3.3 Currencies (Forex)
Currencies react to both domestic and global macro events.
Higher interest rates → stronger currency.
Political instability → weaker currency.
Trade surpluses → long-term currency support.
For instance, the U.S. dollar strengthened massively during 2022 as the Fed hiked rates to tame inflation.
3.4 Commodities
Macro events often push commodities in opposite directions:
Inflation & war → gold up.
Supply disruptions → oil and gas spike.
Economic slowdowns → industrial metals (copper, aluminum) fall.
3.5 Cryptocurrencies
Though newer, crypto markets are also shaped by macro events:
Inflation & currency weakness → investors turn to Bitcoin as “digital gold.”
Regulatory crackdowns → sell-offs in crypto markets.
Liquidity waves → surging risk appetite drives crypto rallies.
4. Historical Examples of Macro Events
4.1 2008 Global Financial Crisis
Triggered by mortgage-backed securities collapse, the crisis wiped trillions from global markets. Central banks responded with QE, reshaping monetary policy forever.
4.2 COVID-19 Pandemic (2020)
Lockdowns froze economies, markets crashed 30% in weeks, but unprecedented stimulus sparked one of the fastest rebounds in history.
4.3 Russia-Ukraine War (2022)
Energy and food price shocks drove inflation worldwide. European economies struggled with gas shortages, while defense stocks surged.
4.4 OPEC Oil Price Shocks
From 1973 to 2020, OPEC decisions repeatedly caused energy volatility. Traders monitor these meetings as major macro events.
4.5 India’s Demonetization (2016)
The sudden removal of high-value currency notes disrupted businesses, retail demand, and the informal economy, while pushing digital payments adoption.
5. How Traders and Investors Should Respond
Risk Management Strategies
Use stop-loss orders to protect capital during volatile macro events.
Diversify across asset classes (equities, bonds, commodities, cash).
Hedging Instruments
Futures & options to hedge exposure.
Currency forwards for exporters/importers.
Gold as a safe haven during uncertainty.
Macro Trading Strategies
Top-down investing: Start with macro trends → sectors → individual stocks.
Event-driven trading: Position ahead of known announcements (jobs data, Fed meetings).
Safe-haven rotation: Shift to gold, Treasuries, or USD during crises.
Long-Term vs Short-Term
Long-term investors ride out volatility, focusing on structural growth.
Short-term traders exploit swings with tactical plays.
6. Future of Macro Events in a Changing World
6.1 Technology & AI
AI adoption will reshape productivity, labor markets, and monetary policy. Macro events will increasingly include technological disruptions.
6.2 Climate Change & Green Policies
Extreme weather and carbon policies will move commodity markets, insurance sectors, and energy investments.
6.3 Geopolitical Power Shifts
The U.S.–China rivalry, regional alliances, and conflicts will dominate macro headlines for decades.
6.4 Digital Currencies & Blockchain
Central Bank Digital Currencies (CBDCs) could redefine monetary systems, making them macro events in themselves.
7. Conclusion
Macro events are the invisible currents steering global markets. They influence risk perception, capital flows, and investment returns. Whether it’s a jobs report, a Fed rate decision, an oil shock, or a geopolitical crisis, markets react instantly and often violently.
For traders, the lesson is clear: ignore macro events at your peril. Success lies not only in technical charts or company fundamentals but also in recognizing the big picture. By staying informed, practicing risk management, and thinking globally, investors can turn macro volatility into opportunity.
Support & Resistance Levels for Today’s Market1. Introduction: Why Support & Resistance Matter
In trading, one of the most powerful and time-tested concepts is support and resistance (S&R). Whether you are a beginner exploring intraday charts or a seasoned trader looking at weekly setups, S&R levels act like the invisible walls of the market.
Support is a price zone where buyers step in, halting a decline.
Resistance is a zone where sellers emerge, stopping an advance.
These levels reflect the psychology of crowds, institutional behavior, and liquidity zones. Without them, trading would feel like driving without brakes or signals.
Every day, traders mark fresh S&R levels based on the previous day’s highs, lows, closes, option data, and market structure. That’s why they’re so critical in today’s market outlook.
2. The Psychology Behind Support & Resistance
To understand why these levels work, we need to dig into trader psychology:
Support Zones: Imagine a stock falling from ₹200 to ₹180. Many buyers who missed at ₹200 now feel ₹180 is a “cheap” price, so they step in. Short-sellers also book profits. This creates buying demand → market stabilizes.
Resistance Zones: Suppose the same stock climbs back from ₹180 to ₹200. Traders who bought late at ₹200 earlier may exit to break even. Short-sellers also re-enter. Selling pressure builds → market stalls.
Thus, S&R levels form from collective trader memory. The more times a level is tested, the stronger it becomes.
3. How to Identify Support & Resistance Levels for Today
For daily trading, traders usually rely on:
(a) Previous Day High & Low
Yesterday’s high often acts as resistance.
Yesterday’s low often acts as support.
Example: If Nifty made a high of 24,200 yesterday, that zone may cap today’s rallies.
(b) Opening Price & First 15-Minute Range
The opening levels define intraday sentiment.
A breakout above the first 15-min high = bullish bias.
A breakdown below the first 15-min low = bearish bias.
(c) Moving Averages
20 EMA (Exponential Moving Average) is a strong intraday S/R level.
50 & 200 EMAs act as swing-level S/R.
(d) Pivot Points
Calculated from (High + Low + Close) / 3.
Traders use them to mark Support (S1, S2, S3) and Resistance (R1, R2, R3) levels.
(e) Volume Profile Zones
High Volume Nodes (HVN) = strong support/resistance.
Low Volume Nodes (LVN) = possible breakout/breakdown areas.
(f) Option Chain Data (OI)
In index trading (Nifty, Bank Nifty), strike prices with highest Call OI = resistance.
Strike prices with highest Put OI = support.
4. Types of Support & Resistance
(a) Horizontal Levels
Flat lines connecting multiple swing highs or lows. Most commonly used.
(b) Trendline Support/Resistance
Drawn diagonally across rising lows (support) or falling highs (resistance).
(c) Fibonacci Levels
Retracement levels (38.2%, 50%, 61.8%) often act as S&R.
(d) Dynamic Levels
Moving averages, VWAP, Bollinger bands that shift daily.
(e) Psychological Levels
Round numbers like Nifty 24,000 or Bank Nifty 50,000 act as magnets for price.
5. Why Support & Resistance Work Better in Today’s Market
Today’s markets (2025) are highly algorithm-driven, but even algo models respect liquidity zones → which are essentially S&R levels.
Retail traders watch them → self-fulfilling prophecy.
Institutions place big buy/sell orders near S&R → liquidity builds.
Option writers defend key strikes → market reacts.
So, S&R remains relevant even in the era of algo trading.
6. Trading Strategies Using Support & Resistance
Let’s break down practical intraday and swing strategies:
Strategy 1: Bounce from Support
Wait for price to test support (yesterday’s low, pivot S1, etc.).
Look for bullish candlestick pattern (hammer, engulfing).
Enter long trade → Stop loss below support → Target = resistance.
Strategy 2: Reversal at Resistance
Price approaches strong resistance.
Look for bearish rejection (shooting star, Doji).
Enter short trade → Stop loss above resistance → Target = support.
Strategy 3: Breakout of Resistance
Resistance is tested multiple times.
Strong volume breakout = momentum trade.
Example: Nifty crossing 24,200 with OI shift confirms breakout.
Strategy 4: Breakdown of Support
If support breaks with volume, fresh shorts open.
Example: Bank Nifty falling below 50,000 with heavy Put unwinding.
Strategy 5: Range Trading
If market is sideways, trade between support & resistance.
Buy near support → Sell near resistance.
7. Support & Resistance in Different Timeframes
1-Min / 5-Min Charts → For scalpers, short-term S&R.
15-Min / 1-Hour Charts → Best for intraday.
Daily Charts → Strong S&R for swing & positional trades.
Weekly Charts → Long-term zones watched by institutions.
For today’s market, intraday traders focus mainly on 15-min & hourly charts.
8. Common Mistakes Traders Make
Blindly Buying at Support / Selling at Resistance
Always confirm with volume & candlestick pattern.
Ignoring Breakouts & Breakdowns
Many traders keep waiting for a bounce but miss the trend.
Using Only One Tool
Combine pivots, moving averages, and OI for better accuracy.
Forgetting Stop Loss
S&R levels can break – never trade without a plan.
9. Case Study: Support & Resistance in Nifty (Example)
Suppose Nifty closed yesterday at 24,050 with a high of 24,200 and low of 23,950.
Support Zones for Today:
23,950 (yesterday’s low)
23,900 (Put OI support)
23,850 (pivot S1)
Resistance Zones for Today:
24,200 (yesterday’s high)
24,250 (Call OI buildup)
24,300 (pivot R1)
Trading Plan:
If Nifty sustains above 24,200 with volume → Buy for 24,300.
If Nifty falls below 23,950 → Short for 23,850.
This is exactly how professionals set up today’s market trade plan.
10. Advanced Insights: Volume Profile + Options Data
A modern trader should combine:
Volume Profile → Where most trading occurred yesterday.
Options OI Shifts → Which strikes are defended/attacked today.
Price Action Confirmation → Candlestick rejections, breakouts.
This 3-way approach increases accuracy.
Conclusion: Why Support & Resistance Will Never Die
Markets evolve – from floor trading to electronic, from manual to algo. But one thing remains timeless: human behavior. Fear, greed, profit-taking, and FOMO all play out at support and resistance levels.
For today’s market, S&R acts as your trading compass.
They guide your entries and exits.
They highlight where risk is lowest and reward is highest.
They help you trade with discipline instead of emotion.
Whether you are an intraday trader, a swing trader, or an investor, mastering support and resistance is like mastering the grammar of market language. Without it, you can’t construct profitable trades.

Breakouts & Fakeouts in Trading🔹 Introduction
Financial markets are like living organisms – constantly moving, adjusting, and reacting to news, emotions, and liquidity. For traders, one of the most exciting moments is when a stock, currency pair, commodity, or cryptocurrency seems to break out of its range. Breakouts often lead to big, sharp moves, offering opportunities for quick profits.
But here’s the catch: not every breakout is real. Many are fakeouts (false breakouts) designed by market dynamics, liquidity hunters, or big players to trap traders. The difference between making money and losing money often lies in identifying whether a breakout is genuine or false.
This article dives into:
What breakouts are
Why fakeouts happen
Chart examples (conceptually explained)
Tools to confirm breakouts
Trading strategies to avoid traps
Risk management for breakout traders
🔹 Part 1: What is a Breakout?
A breakout occurs when the price of an asset moves outside a defined support or resistance level with increased momentum.
✅ Common Types of Breakouts
Resistance Breakout – Price moves above a previously strong ceiling.
Support Breakout – Price falls below a previously strong floor.
Trendline Breakout – Price breaks out of a rising or falling trendline.
Chart Pattern Breakout – Price escapes from patterns like triangles, flags, rectangles, or head & shoulders.
Volatility Breakout – When price explodes after a period of consolidation (Bollinger Band squeeze).
Why traders love breakouts?
They indicate a new trend may begin.
They provide clear entry and exit levels.
They often come with higher volume, confirming market interest.
Example: If Nifty is stuck between 19,500–20,000 for weeks and suddenly crosses 20,000 with heavy volume, that’s a bullish breakout.
🔹 Part 2: What is a Fakeout?
A fakeout (false breakout) happens when price temporarily breaks a level, lures traders into positions, but then reverses back into the range.
Fakeouts are dangerous because:
Traders enter aggressively expecting a trend, but get stopped out.
Big players use fakeouts to hunt stop-losses of retail traders.
They often happen during low liquidity or news events.
Example: Price breaks above 20,000, attracts buyers, but quickly reverses to 19,800. That’s a bull trap fakeout.
🔹 Part 3: Why Do Fakeouts Happen?
Fakeouts are not random; they are part of market psychology and structure.
Liquidity Hunting (Stop Loss Hunting)
Smart money knows retail traders place stop-losses above resistance or below support.
They push prices just beyond those levels, trigger stop-losses, then reverse.
Low Volume Breakouts
If breakout happens without strong participation, it’s usually unsustainable.
News & Events
A sudden announcement can cause sharp moves, but once news fades, price falls back.
Algorithmic Manipulation
High-frequency traders may push price beyond levels to create artificial breakouts.
Market Sentiment & Greed
Traders chase breakouts blindly, creating temporary momentum before exhaustion.
🔹 Part 4: Spotting Genuine Breakouts vs Fakeouts
✅ Clues for Real Breakouts
High Volume: Breakouts with above-average volume are stronger.
Retest of Levels: After breakout, price pulls back to test old support/resistance, then resumes trend.
Strong Candle Closes: Large body candles closing beyond the level.
Market Context: Aligns with larger trend or macroeconomic strength.
❌ Signs of Fakeouts
Breakout with low or declining volume.
Long wicks (shadows) beyond resistance/support but weak closes.
Breakouts during off-market hours or thin liquidity.
Price immediately snaps back into range after breakout.
🔹 Part 5: Chart Patterns & Fakeouts
Range Breakouts
Markets consolidate between two levels.
Breakouts beyond range are powerful but also prone to fakeouts.
Triangle Breakouts
Symmetrical/ascending/descending triangles show compression.
Fakeouts are common before the “real” breakout.
Head & Shoulders Pattern
A breakdown below the neckline should confirm trend reversal.
Many times, price breaks below neckline but quickly recovers.
Flag & Pennant Patterns
Strong continuation patterns, but fake breakouts happen if volume is missing.
🔹 Part 6: Strategies to Trade Breakouts & Avoid Fakeouts
1. Wait for Candle Close Confirmation
Don’t jump in immediately; wait for the candle to close above/below the level.
2. Use Volume as Filter
Only trade breakouts with above-average volume.
3. Retest Strategy
Enter on pullback to old support/resistance (safer entry).
4. Multi-Timeframe Confirmation
If breakout is visible on both 1-hour and daily charts, it’s stronger.
5. Combine with Indicators
RSI divergence can warn of false breakout.
Moving averages can confirm trend direction.
6. Avoid News-Driven Breakouts
Trade technical breakouts, not temporary news spikes.
🔹 Part 7: Risk Management in Breakout Trading
Even the best trader cannot avoid fakeouts completely. That’s why risk management is key.
Position Sizing: Risk only 1–2% of account per trade.
Stop Loss Placement:
For upside breakout: place SL below breakout level.
For downside breakout: place SL above breakdown level.
Use Partial Profits: Book some profit early, trail the rest.
Don’t Chase Breakouts: If you miss the first entry, don’t enter late.
🔹 Part 8: Real-Life Examples
Example 1: Stock Breakout
Stock consolidates between ₹500–₹520 for 2 weeks.
Breaks ₹520 with high volume, rallies to ₹550. (Real breakout)
Example 2: Crypto Fakeout
Bitcoin breaks $30,000 resistance but fails to sustain.
Falls back to $29,000 within hours. (Bull trap fakeout)
Example 3: Forex False Breakdown
EUR/USD breaks below 1.1000, triggering short trades.
Reverses sharply to 1.1050. (Bear trap fakeout)
🔹 Part 9: Psychology Behind Breakouts & Fakeouts
Retail Traders: Chase price blindly.
Institutions: Create liquidity zones by triggering retail stop-losses.
Fear & Greed: Traders either fear missing out (FOMO) or panic at reversals.
Patience vs Impulsiveness: Successful traders wait for confirmation, while impulsive ones fall for fakeouts.
🔹 Part 10: Advanced Tips for Professionals
Volume Profile Analysis
See if breakout aligns with high-volume nodes (strong support/resistance).
Order Flow Tools (Level II Data, Footprint Charts)
Helps spot whether breakout is supported by real buying/selling.
Breakout with Trend Alignment
Always trade in direction of higher-timeframe trend.
Market Timing
Breakouts during main sessions (like US market open) are more reliable.
🔹 Conclusion
Breakouts & fakeouts are two sides of the same coin. While real breakouts can deliver powerful moves, fakeouts are equally common and dangerous. The key lies in:
Confirming with volume, retests, and candle closes.
Avoiding emotional FOMO trades.
Protecting capital with risk management.
If you understand the psychology behind breakouts and fakeouts, use confirmation tools, and trade with patience, you can avoid traps and capture the big trend moves that follow genuine breakouts.
The Art of Position SizingIntroduction: Why Position Sizing is the Silent Weapon
When most people think about trading success, they picture things like stock picking, finding the next multibagger, or timing the market perfectly. But the truth is, none of these alone will make you a consistently profitable trader. The difference between traders who survive and thrive versus those who blow up their accounts often comes down to one thing: position sizing.
Position sizing is the art and science of deciding how much to risk on a trade. It’s not glamorous. It doesn’t make headlines like “XYZ stock doubled in a week.” But it’s the most powerful tool you have for controlling risk, managing emotions, and growing capital over the long term.
Think of trading like sailing. The market is the ocean — unpredictable, sometimes calm, sometimes stormy. Your strategy is the ship. But position sizing? That’s the steering wheel. Without it, even the strongest ship can sink.
In this article, we’ll dive deep into the art of position sizing, explore different methods, psychological aspects, and real-world applications, and by the end, you’ll understand why smart traders say: “It’s not about being right, it’s about surviving long enough to grow.”
What is Position Sizing?
In simple terms, position sizing answers the question:
“How many shares (or contracts/lots) should I buy or sell on this trade?”
Let’s take an example. Suppose you have ₹1,00,000 as trading capital. You see a stock trading at ₹500 and want to buy. Should you buy 20 shares, 100 shares, or go all-in with 200 shares? The answer depends on:
Your risk tolerance per trade (how much you’re comfortable losing if it goes wrong).
Your stop-loss level (the price at which you’ll exit if the trade fails).
Market conditions (volatility, liquidity, trend strength).
Two traders can take the exact same trade setup — same entry and exit — but one could lose 50% of his account, while the other loses just 1%. That’s the power of position sizing.
The Role of Risk Management in Position Sizing
Before we dive into methods, let’s lay the foundation: risk management.
The golden rule in trading: Never risk more than a small fraction of your capital on a single trade.
Commonly used: 1% Rule or 2% Rule.
Risk 1% of your account per trade.
Example: If you have ₹1,00,000, risk only ₹1,000 per trade.
Now, here’s the beauty: By limiting risk per trade, even if you face a losing streak, you can still survive.
Imagine you risk 10% of your capital per trade. After just 10 losing trades, your account is wiped out. But if you risk 1% per trade, you’d need 100 consecutive losing trades to lose everything. That’s survival power.
Position Sizing Methods
There’s no one-size-fits-all approach. Traders use different methods depending on style, psychology, and goals. Let’s go through the major ones:
1. Fixed Dollar Method
Decide a fixed amount to risk on every trade.
Example: “I’ll risk ₹2,000 per trade no matter what.”
Simple but not flexible. Works for beginners.
2. Fixed Percentage Method
Risk a set percentage of account equity per trade.
Example: 2% risk rule. If account = ₹1,00,000 → risk = ₹2,000.
Dynamic: As account grows, risk amount grows.
3. Kelly Criterion
A mathematical formula to maximize long-term growth by balancing win rate and risk-reward.
Powerful, but aggressive.
Example: If you win 60% of trades with 2:1 reward/risk, Kelly suggests a certain % of capital to risk.
Many traders use half-Kelly for safety.
4. Volatility-Based Position Sizing
Position size adjusts to stock volatility.
Use ATR (Average True Range) or standard deviation.
More volatile stocks → smaller size.
Less volatile → larger size.
Helps normalize risk across different stocks.
5. Risk/Reward-Driven Sizing
Position based on expected reward vs. risk.
Example: If reward:risk is 3:1, you may size slightly larger.
Ensures high probability trades get priority.
6. Scaling In & Out
Scaling in: Enter gradually, adding positions as trade confirms.
Scaling out: Reduce position as profit builds, locking gains.
Useful in trending or uncertain markets.
Mathematical Foundations
Let’s go step by step:
Formula:
Position Size = (Account Risk per Trade) ÷ (Trade Risk per Share)
Account Risk per Trade = % of account × account size.
Trade Risk per Share = Entry Price – Stop Loss.
Example:
Account = ₹1,00,000.
Risk per trade = 2% = ₹2,000.
Stock entry = ₹500, Stop loss = ₹490 → Risk per share = ₹10.
Position size = ₹2,000 ÷ ₹10 = 200 shares.
This formula keeps every trade within safe limits, regardless of stock price.
Psychology of Position Sizing
This is where most traders fail. Even with formulas, emotions creep in:
Greed: “This setup looks perfect, let me double my size.”
Fear: “I just had three losses; let me reduce my size drastically.”
Overconfidence: After a winning streak, traders often oversize.
Revenge trading: Going all-in after losses to “win it back.”
The art of position sizing isn’t just math — it’s discipline. Sticking to your rules despite emotions is what separates pros from amateurs.
Position Sizing in Different Trading Styles
Day Trading: Smaller time frames, quick exits. Use tight stop-loss → often larger position sizes.
Swing Trading: Wider stop-loss, overnight risks. Position size smaller to balance.
Long-Term Investing: Position sizing matters less per trade, but diversification becomes key.
Options & Futures: Leverage complicates sizing. Need margin-based calculations and higher discipline.
Adapting Position Sizing to Market Conditions
High Volatility Markets: Reduce position size. Survive turbulence.
Calm/Trending Markets: Increase size cautiously to capture trends.
During Losing Streaks: Reduce size temporarily to preserve confidence and capital.
During Winning Streaks: Carefully increase size, but avoid over-leverage.
Position Sizing Mistakes to Avoid
All-in mentality.
One bad trade can end your career.
Averaging down blindly.
Throwing good money after bad.
Ignoring correlations.
Buying 3 different banking stocks = concentration risk.
Sizing based on gut feel, not rules.
Leads to inconsistency.
Case Studies & Practical Examples
The Blow-Up Trader
Started with ₹2,00,000. Risked 20% per trade. After 5 losses, wiped out.
Lesson: Poor position sizing = fast death.
The Survivor Trader
Started with ₹2,00,000. Risked 1% per trade = ₹2,000.
Even after 10 losses, only down 10%. Account intact.
Lesson: Survival > glory.
The Professional Fund Manager
Doesn’t risk more than 0.5%–1% per trade.
Manages billions, but each trade is just a small piece.
Lesson: Longevity and risk control matter most.
Position Sizing as an Art
So far, we’ve discussed the science — formulas, rules, risk percentages. But in real life, position sizing is also an art.
It requires judgment — when to size up, when to stay small.
It requires psychological control — sticking to plans.
It requires adaptability — markets change, volatility changes.
Great traders think of position sizing like a volume knob: turning risk up and down depending on conditions, but never letting it break the system.
Conclusion
At its core, position sizing is about survival first, profits second. You can have the best strategy in the world, but without proper sizing, you’ll blow up before you can reap the rewards.
The art of position sizing is:
Mathematical discipline (formulas, risk per trade).
Psychological discipline (controlling greed/fear).
Strategic flexibility (adapting to markets).
So next time you’re about to hit “buy” or “sell,” ask yourself:
How much am I risking?
Is this within my rules?
If I lose, can I survive to trade another day?
Because in trading, the ultimate goal isn’t to win one big trade.
The ultimate goal is to stay in the game long enough to let compounding work its magic.

Entry to Exit: Step-by-Step Trade Management1. Introduction
Trading is not only about finding the right entry point—it’s about how you manage your trade once you’re inside the market. Many beginners spend countless hours searching for the “perfect” entry strategy, but professionals know that trade management is where the real game is won or lost.
Think of trading as a journey. Entry is the start, exit is the destination, and trade management is the road that connects the two. Without proper management, even the best entry signals can turn into losing trades. On the other hand, with disciplined management, even an average entry can become profitable.
In this guide, we’ll break down the entire trade lifecycle—from preparation to execution, from entry to exit—step by step.
2. Pre-Trade Preparation
Before entering a trade, preparation is key. Just like a pilot runs through a checklist before takeoff, a trader should have a trade checklist.
🔹 Market Research & Analysis
Study broader market trends (bullish, bearish, sideways).
Check fundamentals (earnings reports, economic news, sector performance).
Perform technical analysis (support/resistance levels, chart patterns, moving averages).
🔹 Building a Trade Plan
A trade without a plan is like sailing without a map. A strong trade plan includes:
Entry criteria – What signals will you wait for before entering?
Stop-loss level – Where will you cut the trade if it goes against you?
Target level – Where will you take profit?
Position size – How much capital will you risk?
🔹 Defining Risk per Trade
Professional traders don’t risk everything in one trade. A common rule is the 1-2% risk rule. For example:
If you have ₹1,00,000 capital and risk 1% per trade → max loss = ₹1,000.
This ensures survival even after multiple losing trades.
3. Entry Strategies
Your entry is the first step into the battlefield. A good entry maximizes reward while minimizing risk.
🔹 Types of Entries
Breakout Entries – Entering when price breaks a key resistance/support.
Pullback Entries – Waiting for price to retrace to a support/resistance level before entering.
Reversal Entries – Entering when trend shows signs of changing direction.
🔹 Confirmation Tools
Candlestick patterns (engulfing, hammer, doji).
Indicators (RSI for momentum, MACD for trend confirmation).
Volume analysis (rising volume = strong move).
🔹 Avoiding FOMO Entries
Jumping into trades without confirmation leads to poor risk-reward setups. Always stick to your predefined entry signals.
4. Stop Loss & Risk Management
Stop-loss is your insurance policy. Without it, one bad trade can wipe out weeks of profits.
🔹 Types of Stops
Hard Stop – Pre-set level, automatically exits trade.
Mental Stop – Decided in mind, but dangerous if emotions take over.
ATR Stop – Based on volatility (Average True Range).
🔹 Break-Even Adjustment
When trade moves in your favor, shift stop-loss to entry point → removes risk.
🔹 Risk-Reward Ratio (RRR)
Only take trades with minimum 1:2 or 1:3 ratio. Example: risk ₹1,000 for potential ₹2,000–₹3,000 gain.
5. Trade Monitoring & Mid-Trade Adjustments
Once in a trade, your job is to manage it intelligently.
🔹 When Market Moves in Your Favor
Use trailing stop-loss to lock profits.
Scale out gradually (book partial profits at key levels).
🔹 When Market Moves Against You
Never widen stop-loss (it increases risk).
Accept the loss gracefully—capital preservation is priority.
🔹 Scaling In & Out
Scaling in: Add to your position as trade confirms in your favor.
Scaling out: Reduce position gradually, booking partial profits while still staying in.
6. Trade Psychology
Emotions are the biggest enemy of traders. Fear and greed often sabotage good strategies.
🔹 Common Emotional Traps
Fear of Missing Out (FOMO) – Chasing trades without signals.
Fear of Loss – Closing positions too early.
Greed – Holding too long, ignoring exit plan.
🔹 Discipline Rules
Follow your plan, not your emotions.
Accept that losses are part of the game.
Think in terms of probabilities, not certainties.
7. Exit Strategies
A trade is not complete until you exit. Profits exist only when booked.
🔹 Exit Types
Target-Based Exit – Close trade when it hits your planned profit target.
Trailing Stop Exit – Ride trend while protecting profits.
Time-Based Exit – Exit if price doesn’t move within certain time.
🔹 Letting Profits Run
The hardest skill is to hold winners long enough while not giving back gains. Trailing stops help balance safety & profit.
🔹 Avoid Early Exits
Many traders exit too soon because of emotions. Always follow your planned exit rule, not short-term market noise.
8. Post-Trade Review
Every trade—win or lose—is a learning opportunity.
🔹 Trading Journal
Record every trade:
Entry, exit, stop-loss.
Reasons for trade.
Emotions felt.
Lessons learned.
🔹 Review Process
Analyze losing trades → were they due to bad setup or bad discipline?
Analyze winning trades → did you follow your plan, or was it luck?
Constantly refine your strategy.
9. Conclusion
Trade management is the bridge between analysis and profitability. The entry may give you the opportunity, but it’s management that determines the outcome.
Prepare before you trade.
Enter only with clear signals.
Manage risk with position sizing and stop-loss.
Control emotions during the trade.
Exit with discipline.
Learn from every trade.
By mastering trade management, you shift from gambling to professional trading. In the end, trading isn’t about predicting the market perfectly—it’s about managing uncertainty profitably, from entry to exit.
Managing Risk in Trading1. Understanding Risk in Trading
Before managing risk, it’s crucial to define what “risk” means in trading.
Risk is the possibility of losing money when market moves go against your position.
Every trade has two outcomes: profit or loss. Risk is essentially the probability and magnitude of that loss.
Types of Risks in Trading
Market Risk – Prices moving unfavorably due to volatility, economic events, or news.
Liquidity Risk – Not being able to exit a trade quickly at a fair price.
Leverage Risk – Excessive use of borrowed funds magnifying both gains and losses.
Emotional Risk – Poor decision-making under stress, fear, or greed.
Systematic Risk – Broader economic or geopolitical factors affecting all markets.
Idiosyncratic Risk – Specific risks tied to one stock, sector, or currency pair.
The goal of risk management is not to eliminate risk but to control exposure, minimize downside, and maximize the probability of long-term profitability.
2. The Core Principles of Risk Management
Principle 1: Capital Preservation Comes First
The golden rule: Protect your trading capital before chasing profits.
If you lose too much capital, recovering becomes mathematically harder. For example:
A 10% loss requires 11% gain to break even.
A 50% loss requires 100% gain to break even.
Principle 2: Never Risk More Than You Can Afford to Lose
Traders must only invest money that won’t impact essential life expenses. This ensures psychological balance and prevents desperate decisions.
Principle 3: Position Sizing Matters
The size of your trade must reflect the amount of risk you are comfortable taking. Over-leveraging is one of the fastest ways traders blow up accounts.
Principle 4: Accept That Losses Are Part of the Game
No strategy wins 100% of the time. Even top hedge funds experience losing streaks. Successful traders don’t avoid losses—they limit them.
Principle 5: Consistency Over Jackpot
Risk management is about steady, compounding growth rather than chasing one big win.
3. Practical Risk Management Tools
3.1 Stop-Loss Orders
A stop-loss order automatically exits your position once the price hits a pre-defined level.
Example: If you buy a stock at ₹100, you might place a stop-loss at ₹95, limiting potential loss to 5%.
Benefits:
Removes emotional decision-making.
Limits catastrophic losses.
Provides a clear risk-to-reward framework.
3.2 Take-Profit Levels
Just like limiting losses, pre-deciding where to book profits is essential. Greed often prevents traders from closing positions, only to see profits vanish.
3.3 Risk-Reward Ratio
The ratio compares potential profit versus potential loss.
Example: Risking ₹100 to make ₹300 means a 1:3 risk-reward ratio.
Professional traders often only take trades with at least 1:2 or higher ratios.
3.4 Diversification
Avoid putting all money in one trade, sector, or asset class.
Example: If you’re trading equities, also balance with forex, commodities, or bonds.
3.5 Hedging
Using instruments like options or futures to reduce risk.
Example: If you own a stock, buying a put option can protect against downside risk.
3.6 Leverage Control
Leverage magnifies returns but also magnifies losses.
Conservative traders limit leverage to manageable levels (like 2x or 5x), while reckless use (50x or 100x leverage in forex/crypto) can wipe out accounts quickly.
3.7 Volatility Adjustment
Adjusting position size based on market volatility.
Higher volatility → smaller position sizes to avoid large swings.
4. Position Sizing Strategies
Position sizing determines how much of your capital you allocate per trade.
4.1 Fixed Percentage Rule
Risk only a small percentage of capital per trade (commonly 1–2%).
Example: With ₹1,00,000 account, risking 1% = ₹1,000 per trade.
4.2 Kelly Criterion
A formula-based approach to maximize long-term growth while avoiding overexposure.
Balances win probability and risk-reward ratio.
4.3 Volatility-Based Position Sizing
Larger positions in stable markets, smaller ones in volatile conditions.
5. Psychological Risk Management
Emotions are often a bigger risk than the market itself.
5.1 Fear and Greed
Fear prevents traders from entering good trades or causes early exits.
Greed leads to overtrading or holding on too long.
5.2 Discipline
Following a trading plan strictly, regardless of emotions, is crucial.
Consistency beats emotional improvisation.
5.3 Avoid Revenge Trading
After losses, many traders try to “win it back” quickly. This often leads to bigger losses.
5.4 Patience
Waiting for high-probability setups rather than forcing trades is key.
5.5 Mindset
Think like a risk manager first, trader second.
Your job is not to predict markets perfectly but to manage outcomes effectively.
6. Building a Risk Management Plan
A written plan brings discipline and removes impulsive decisions.
Components of a Risk Plan:
Capital at Risk – Decide max loss per trade and per day/week.
Stop-Loss Strategy – Where and how you’ll place stops.
Position Sizing – Percentage risk rules.
Diversification Rules – How to spread trades.
Risk-Reward Criteria – Minimum acceptable ratios.
Review & Journal – Record every trade and analyze mistakes.
7. Real-World Examples
Example 1: Stock Trading
Trader has ₹5,00,000 capital.
Risks 1% per trade = ₹5,000.
Buys shares worth ₹1,00,000 with stop-loss at 5%.
Max loss = ₹5,000 (within plan).
Example 2: Forex Trading
Account size = $10,000.
Risk per trade = 2% ($200).
Chooses 50-pip stop-loss.
Lot size adjusted so each pip equals $4 → max loss $200.
Example 3: Options Trading
Owns stock worth ₹2,00,000.
Buys protective put for ₹5,000 premium.
If stock crashes, loss is capped at strike price.
8. Common Mistakes in Risk Management
Overleveraging – Betting too big.
Moving Stop-Loss – Hoping market turns back.
Ignoring Correlation – Owning multiple assets that move together.
Risking Too Much Too Soon – Overconfidence after small wins.
No Trading Journal – Failing to learn from mistakes.
9. Advanced Risk Management Techniques
Value-at-Risk (VaR) – Statistical measure of max loss at a given confidence level.
Monte Carlo Simulations – Stress testing strategies under random conditions.
Drawdown Analysis – Limiting maximum decline from peak capital.
Trailing Stops – Locking in profits while allowing trades to run.
Options Strategies – Spreads, straddles, collars for advanced hedging.
10. Long-Term Survival Mindset
Trading is not a sprint, it’s a marathon. The objective is to stay in the game long enough to let skill and discipline compound profits.
Think like a casino: Casinos don’t know individual outcomes, but they manage probabilities and always win in the long run.
Compounding works slowly: Preserving capital and growing steadily beats chasing overnight riches.
Final Thoughts
In trading, you cannot control the market, but you can control your exposure, your decisions, and your discipline. Risk management transforms trading from a gamble into a professional endeavor. Without it, even the best strategies fail. With it, even modest strategies can compound wealth over time.
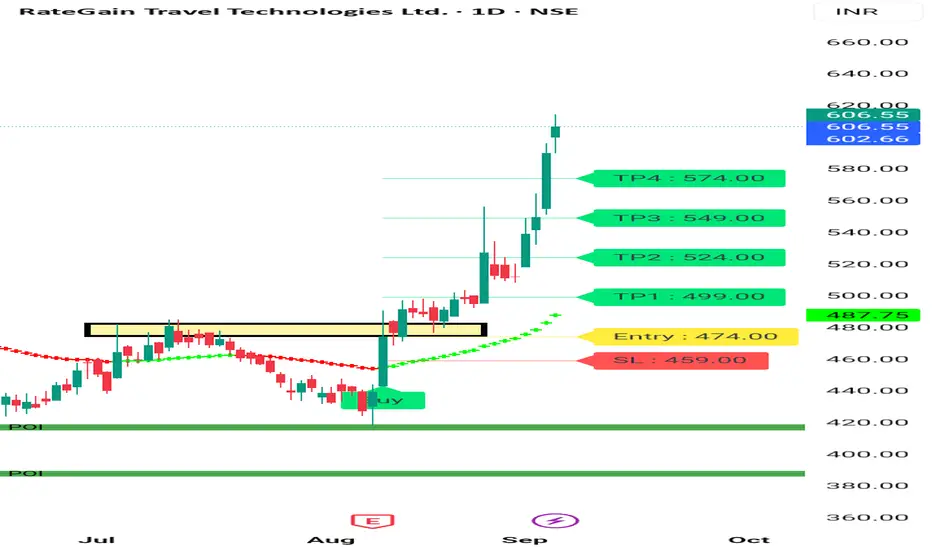
RATE Gain Bullish Structure Rate Gain is Given Good Breakout Above 485 From 485 it's moved to 600 . It's All Time High is 897 . It's given Weekly Breakout also . Ist Daily Rsi above 80 , it has to take Retracement Before Further Movement. It may move to 800 Levels in next 3 -6 months . Wait for Good Risk Reward. At Current price not good entry .who have already they can Trial SL .
For more information Watch my Profile . Always Trade with SL. No trade without Stoploss.
Consult your financial advisor before making any position in stock market.
Part 9 Trading Master Class With ExpertsOption Greeks in Depth
To truly master options, one must understand the Greeks. These mathematical tools describe how options react to different market factors.
Delta (Δ) – Price Sensitivity
Measures how much an option price changes if stock moves ₹1.
Call options: Delta between 0 and +1.
Put options: Delta between 0 and -1.
Example: If a call has delta = 0.5, and stock rises ₹10, option rises ₹5.
Gamma (Γ) – Acceleration of Delta
Delta itself changes as stock moves. Gamma measures this.
High gamma = higher sensitivity, riskier.
Near expiry, gamma becomes extreme.
Theta (Θ) – Time Decay
Options lose value as time passes (all else equal).
Theta tells how much an option loses daily.
Example: If theta = -5, option loses ₹5/day.
Sellers love theta (they earn decay). Buyers fear it.
Vega (ν) – Volatility Sensitivity
Measures how option reacts to 1% change in volatility.
High volatility = high premium.
Example: If Vega = 10, and implied volatility rises 1%, option price rises ₹10.
Rho (ρ) – Interest Rate Sensitivity
Measures impact of interest rate changes.
Less important in short-term trading.
📌 Takeaway: Greeks are like the dashboard of a car. Without them, you’re driving blind.

Part 7 Trading Master Class With ExpertsOptions vs. Futures vs. Stocks
Stocks: Simple ownership.
Futures: Obligation to buy/sell at a future date.
Options: Rights without obligation.
Options are less risky than futures (for buyers) but more complex.
Real-World Examples
Example 1: You buy Nifty 20,000 Call at ₹100 premium. Lot size = 50.
Cost = ₹5,000.
If Nifty rises to 20,200, your profit = ₹10,000 - ₹5,000 = ₹5,000.
If Nifty stays below 20,000, you lose only premium = ₹5,000.
Psychology & Risk Management
Options are not just math, they need psychology:
Don’t over-leverage.
Accept losses early.
Use stop-loss.
Stick to defined strategies.
Manage emotions of greed and fear.

Part 6 Learn Institutional Trading Deep Dive into Option Strategies
One of the biggest advantages of options is the ability to combine them into structured strategies. Let’s expand on some common and advanced ones:
A. Single-Leg Strategies
These involve buying or selling just one option.
Long Call: Buy a call option expecting prices to rise.
Low risk (limited to premium paid).
High reward if stock surges.
Long Put: Buy a put option expecting prices to fall.
Best for bearish outlook.
Acts as portfolio insurance.
Short Call (Naked Call): Sell a call without owning stock.
You receive premium.
Unlimited risk if stock rises sharply.
Short Put (Naked Put): Sell a put option.
You receive premium.
Big risk if stock collapses.
B. Multi-Leg Strategies (Spreads & Hedging)
Bull Call Spread: Buy a lower strike call & sell a higher strike call.
Profits if stock rises moderately.
Lower risk than naked call.
Bear Put Spread: Buy higher strike put & sell lower strike put.
Works in moderately bearish markets.
Covered Call: Own stock + sell call option.
Generates steady income.
Capped upside potential.
Protective Put: Own stock + buy put option.
Insurance against stock falling.

Part 3 Learn Institutional Trading Option Pricing & Premiums
The premium (price of option) is determined by many factors:
Intrinsic Value – Difference between current stock price and strike price. Example: If stock = ₹200, strike = ₹180 (call), intrinsic value = ₹20.
Time Value – Extra premium because of time left until expiry. More time = higher premium.
Volatility – Higher volatility increases premium (uncertainty = higher value).
Interest rates & dividends – Also affect option pricing slightly.
The most famous model for pricing options is the Black-Scholes Model, used worldwide.
Moneyness (ITM, ATM, OTM)
Options are classified as:
In The Money (ITM): Option already has intrinsic value. (Example: Stock = ₹250, Call strike = ₹240).
At The Money (ATM): Stock price = strike price.
Out of The Money (OTM): Option has no intrinsic value yet. (Example: Stock = ₹250, Call strike = ₹280).
OTM options are cheaper, but riskier. ITM options are costlier, but safer.

Part 1 Ride The Big MovesIntroduction to Options
In the world of financial markets, people look for different ways to make money, reduce risk, or take positions on where they think markets are headed. Apart from buying and selling stocks directly, one of the most powerful tools available is options trading.
Options are a type of derivative contract. This means their value is derived from an underlying asset like a stock, index, currency, or commodity. They give traders and investors flexibility because they can be used for speculation (betting on price movements), hedging (protecting against risks), or even for generating steady income.
Unlike stocks where ownership is straightforward (you buy a share, you own part of the company), options are contracts with special terms, conditions, and expiry dates. This makes them more complex but also more versatile.
For example: If you believe a stock price will rise in the next month, you don’t necessarily need to buy the stock. Instead, you can buy a call option, which gives you the right to buy that stock at a certain price later. Similarly, if you think the stock will fall, you can buy a put option, which gives you the right to sell at a certain price.
This flexibility makes options attractive to professional traders, institutions, and even retail traders who want to manage risk or boost returns.
But with power comes responsibility—options can be risky if not understood properly. That’s why it’s important to study them in depth.
Types of Options (Call & Put)
Call Option (Bullish bet):
If you expect the stock price to go up, you buy a call. Example: Reliance stock is ₹2,500. You buy a call option with strike price ₹2,600. If stock rises above ₹2,600, your option gains value.
Put Option (Bearish bet):
If you expect the stock price to fall, you buy a put. Example: Infosys stock is ₹1,500. You buy a put option with strike price ₹1,400. If stock falls below ₹1,400, your option gains value.
Both call and put can be bought or sold (written). Selling options means you take on obligations, which is riskier but gives you upfront premium income.

Gold Trading Strategy XAUUSD September 4, 2025Gold Trading Strategy XAUUSD September 4, 2025: New all-time high of $3,578, gold eases to $3,536/oz as US ADP data takes center stage.
Fundamentals: Spot gold hit a record high on Wednesday as weaker-than-expected US jobs data weighed on the US dollar. Gold bulls are betting on further gains. The US Department of Labor's Bureau of Labor Statistics released its Job Openings and Labor Turnover Survey (JOLTS) report on Wednesday, showing that job vacancies, an indicator of labor demand, fell by 176,000 to 7.181 million on the last day of July. Economists surveyed by Reuters had previously forecast the number of vacant jobs in the United States at 7.378 million in July.
Technical analysis: After creating the latest ATH of 3578, the gold price corrected strongly to the 3511 area and then continued to increase; this can be considered a short-term profit-taking wave of the gold price. However, the selling pressure is still not strong. The multi-frame RSI is in the overbought area and shows signs of entering the buying zone. We continue to wait at the support areas combined with MA, Fib and FVG zones.
Important price zones today: 3495 - 3500 and 3475 - 3480.
Today's trading trend: BUY.
Recommended order:
Plan 1: BUY XAUUSD zone 3495 - 3497
SL 3492
TP 3500 - 3510 - 3530 - 3550 - OPEN.
Plan 2: BUY XAUUSD zone 3475 - 3477
SL 3472
TP 3480 - 3490 - 3520 - 3550 - OPEN.
Plan 3: SELL XAUUSD zone 3549 - 3551
SL 3554
TP 3546 - 3536 - 3516 - 3500. (small volume, effective before US session).
Wish you a safe, effective and profitable trading day.🌟🌟🌟🌟🌟

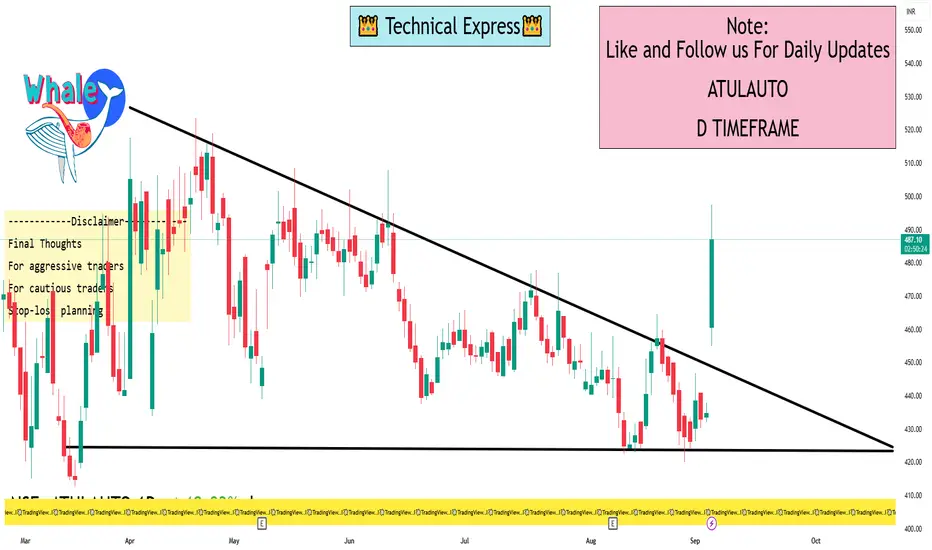
ATULAUTO 1 Day ViewIntraday Support & Resistance (1-Day Level)
MunafaSutra reports:
Short-term Resistance: ₹434.01 and ₹438.97
These levels are cited as valid for intra-day trading scenarios
ICICI Direct shows:
First Support: ₹422.5
Second Support: ₹418.7
Third Support: ₹413.2
Second Resistance: ₹437.2
Third Resistance: ₹441.0
Summary of intraday levels:
Support zone: ~₹422–₹419
Resistance zone: ~₹437–₹441
Current Price Context
ICICIdirect shows a day high of ₹499.05 and day low of ₹449.00, with a last traded price around ₹490.20 as of September 4, 2025
Investing.com also confirms this high volatility range: day’s range ~₹454.95 to ₹497.60
This suggests the stock has already experienced a significant intraday rally, trading well above the traditional short-term resistance levels noted by analysts.
Technical Ratings (Daily Basis)
TradingView categorizes the 1-day timeframe technical summary for Atul Auto as "Neutral" across both Oscillators and Moving Averages
Final Thoughts
For aggressive traders: A breakout above the ₹495–₹503 zone could spark further upside.
For cautious traders: Watch for potential consolidation and hold above ₹475–₹484 as signs of strength. A dip to ₹434–₹444 still maintains bullish structure for now.
Stop-loss planning: Consider trailing protection below key support levels, e.g., around the pivot zone (₹475) or lower support (₹434).
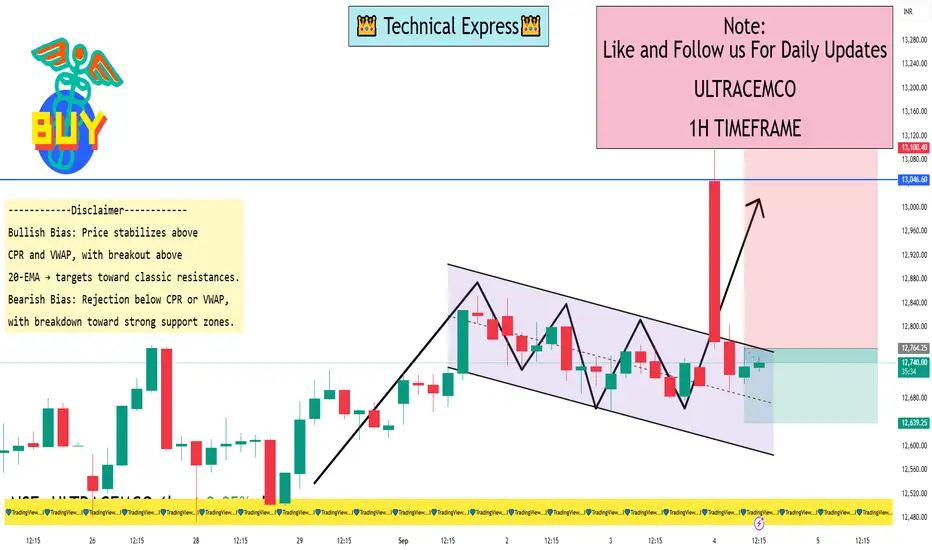
ULTRACEMCO 1 Hour View1-Hour Intraday Support & Resistance Levels
While exact 1-hour pivot levels can vary by provider, here are actionable intraday targets based on recent sources:
Munafasutra suggests a lower intraday target near ₹12,772 and an upper target around ₹12,888, with an immediate level at approximately ₹12,739
These are useful for identifying short-term trading bands.
Summary: Key Levels to Monitor on 1-Hour Chart
Immediate Support: ₹12,772 (Munafasutra)
Lower Intraday Band: ₹12,607 – ₹12,670 (classic pivot S2/S1 levels)
Pivot Zone: Around ₹12,720
Resistance Range: ₹12,783 – ₹12,896 (classic R1–R3), plus Munafasutra upper target near ₹12,888
How to Use These Levels
Use the ₹12,772 level as your lower threshold. A drop below may open up the S2/S1 zone for further downside.
Treat ₹12,720 – ₹12,783 as the core pivot/resistance zone; a break above may validate continuation toward the upper range.
Watch ₹12,888 – ₹12,896 as a potential upper resistance, where intraday rally may pause or reverse.
Final Take
For short-term intraday trades, focus on:
Watch zones: Support at ₹12,772–₹12,720 and resistance at ₹12,783–₹12,888.
Use the pivot range (~₹12,720) as your benchmark for bias—below hints bearish pressure, above signals upside potential.
Monitor technical momentum via trading platforms (e.g., RSI, MA crossovers) to confirm directional moves.
Options vs Buying & Selling in TradingPart 1: Basics of Buying & Selling in Trading
1.1 How It Works
Buying (going long): The trader purchases an asset, expecting its price to rise. Profit comes from selling it later at a higher price.
Selling (going short): The trader sells an asset they don’t own (borrowing it from a broker), expecting its price to fall. Profit comes from buying it back later at a lower price.
Example:
If you buy 100 shares of Tata Steel at ₹120 and sell at ₹150, your profit = ₹30 × 100 = ₹3,000.
If you short 100 shares of Infosys at ₹1,500 and later buy them back at ₹1,400, your profit = ₹100 × 100 = ₹10,000.
1.2 Characteristics of Traditional Trading
Ownership: When you buy, you actually own the asset.
Unlimited upside, unlimited downside (in shorting): Long trades can theoretically go up infinitely, but short trades carry unlimited loss potential.
Capital intensive: You must pay the full value of the asset (unless using margin).
Time horizon: No expiry date; you can hold as long as you want.
1.3 Advantages
Simple and easy to understand.
Ownership benefits like dividends, voting rights in stocks.
No expiry pressure.
1.4 Risks
Large capital required.
Losses can be significant if the market goes against you.
Limited flexibility in terms of strategy.
Part 2: Basics of Options Trading
2.1 What Are Options?
Options are derivative contracts that derive value from an underlying asset (like stocks, indices, commodities, or currencies).
Call Option: Right to buy the asset at a fixed price (strike price).
Put Option: Right to sell the asset at a fixed price.
Options are rights, not obligations. The buyer of an option can choose whether to exercise it, while the seller (writer) is obligated to honor it.
2.2 Example of Options
Suppose Nifty is at 20,000.
You buy a Nifty 20,000 Call Option for a premium of ₹200.
If Nifty rises to 20,500 at expiry, the option’s value = 500. Profit = (500 – 200) = ₹300 per unit.
If Nifty falls to 19,500, you lose only the premium = ₹200.
2.3 Key Features
Leverage: Small premium controls a large value of the asset.
Limited risk for buyers: Maximum loss = premium paid.
Variety of strategies: Options allow profit from up, down, or sideways markets.
Time-bound: Every option has an expiry date.
2.4 Advantages
Cost-efficient way to take positions.
Hedging tool for managing risk.
Flexibility in designing strategies.
Defined risk when buying options.
2.5 Risks
For buyers: Premium decay (time value erosion).
For sellers: Potential unlimited losses.
Complexity compared to direct buying and selling.
Part 3: Options vs Buying/Selling – A Direct Comparison
Feature Traditional Buying/Selling Options Trading
Ownership Yes (when buying) No, it’s a contract
Capital Requirement High Low (premium only)
Leverage Limited (margin needed) Built-in leverage
Risk Unlimited (in shorting) Limited for buyers, unlimited for sellers
Profit Potential Unlimited upside (long) Defined, depending on strategy
Expiry None Always has expiry
Complexity Simple Complex
Uses Investing, long-term holding Hedging, speculation, income strategies
Part 4: Practical Use Cases
4.1 When to Use Traditional Buying & Selling
Long-term investing in stocks.
When you want ownership (e.g., dividends).
When you want simple exposure to price movements.
4.2 When to Use Options
Hedging: An investor holding a stock portfolio buys put options to protect against a fall.
Speculation: A trader buys calls when expecting a sharp rally.
Income generation: Selling options (like covered calls) to earn premiums.
Event trading: Using straddles/strangles during earnings announcements.
Part 5: Risk Management
5.1 In Buying/Selling
Use stop-loss orders.
Diversify portfolio.
Avoid over-leverage.
5.2 In Options
Stick to defined-risk strategies (like spreads).
Understand implied volatility.
Avoid naked option selling without capital cushion.
Part 6: Psychological Differences
Buying & Selling: Feels straightforward, intuitive. Less cognitive load.
Options: Requires strong understanding of Greeks (Delta, Gamma, Theta, Vega). Traders must accept probability-based outcomes.
Part 7: Real-Life Example Comparison
Imagine you expect Reliance to rise from ₹2,500 to ₹2,700.
Method 1 – Buying Shares:
Buy 100 shares @ ₹2,500 = ₹2,50,000 invested.
If price hits ₹2,700 → Profit = ₹20,000.
Risk: If it falls to ₹2,300 → Loss = ₹20,000.
Method 2 – Buying Call Option:
Buy Reliance 2,500 Call @ ₹50 premium = ₹5,000 invested.
If Reliance rises to ₹2,700, intrinsic value = ₹200. Profit = (200 – 50) × 100 = ₹15,000.
If Reliance falls to ₹2,300, loss = only premium ₹5,000.
Here, options gave higher percentage return with limited risk.
Part 8: Long-Term Perspective
Investors prefer buying & holding stocks, as they represent ownership in a growing business.
Traders often use options for short-term moves, hedging, and leverage.
Smart portfolios often combine both: owning core assets while using options for risk management.
Conclusion
Traditional buying and selling is like owning the road—it’s direct, long-term, and stable. Options are like renting a sports car for a specific race—cheaper, faster, but requiring skill and timing.
Neither is inherently better. It depends on:
Risk appetite
Capital available
Market view
Time horizon
Experience level
For beginners, direct buying and selling is a solid foundation. For advanced traders, options open new horizons of creativity and control.
Open Interest Chain Analysis1. Basics of Open Interest
Open Interest refers to the total number of outstanding derivative contracts (futures or options) that are currently active and not closed or settled. Unlike stock trading, where the number of shares is fixed, derivatives can be created and extinguished through contracts.
If a new buyer and new seller enter a contract → OI increases by 1.
If an existing contract holder closes their position (buy vs sell) → OI decreases by 1.
If an existing position shifts hands (buyer sells to a new buyer) → OI remains unchanged.
Key Points:
OI is reported at the end of the trading day.
OI gives a measure of liquidity and market participation.
Higher OI means greater trader interest and tighter spreads.
2. Difference Between Open Interest and Volume
Many beginners confuse volume with open interest.
Volume: Number of contracts traded during the day (can include multiple trades of the same contract).
Open Interest: Number of outstanding contracts still open at the end of the day.
Example:
Trader A buys 1 lot of Nifty call option from Trader B.
Volume = 1
OI = 1 (new contract created)
If Trader A sells that contract to Trader C:
Volume = 2 (two trades happened)
OI = 1 (still one open contract, just transferred)
So, volume measures activity, while OI measures positions outstanding.
3. Mechanics of Open Interest Creation and Reduction
Understanding how OI increases or decreases helps in interpreting market activity:
New Buyer + New Seller → OI Increases.
Old Buyer + Old Seller Square Off → OI Decreases.
Old Position transferred (buyer sells to new buyer) → OI unchanged.
This is why OI analysis is powerful—it helps in distinguishing between fresh positions and unwinding.
4. Importance of OI in Options and Futures
Open Interest matters because:
It reflects market participation (are traders interested?).
Identifies support/resistance levels (through strike-wise OI).
Highlights trend confirmation or rejection.
Reveals institutional footprints (big money creates large OI).
Useful for strategy adjustments (hedging, spreads, straddles).
5. Open Interest Chain (OI Chain) Explained
An OI Chain is essentially a table of strike-wise option contracts, displaying:
Strike Price
Call OI (with changes)
Put OI (with changes)
Volume
Last Traded Price (LTP)
By analyzing this chain, traders can:
Spot which strikes have maximum call OI (resistance).
Spot which strikes have maximum put OI (support).
Track shift in OI to see if market is building bullish or bearish sentiment.
6. Techniques of OI Chain Analysis
A. Call vs Put OI Analysis
High Call OI at a strike → resistance level.
High Put OI at a strike → support level.
If Call OI increases and price falls → bearish confirmation.
If Put OI increases and price rises → bullish confirmation.
B. Change in OI (Intraday vs Daily)
Rising OI + Rising Price = Long Build-up (Bullish).
Rising OI + Falling Price = Short Build-up (Bearish).
Falling OI + Rising Price = Short Covering (Bullish).
Falling OI + Falling Price = Long Unwinding (Bearish).
C. Put-Call Ratio (PCR)
PCR = Total Put OI ÷ Total Call OI.
PCR > 1 = more puts than calls → bullish sentiment.
PCR < 1 = more calls than puts → bearish sentiment.
Extreme PCR values indicate overbought/oversold conditions.
D. OI Concentration Zones
Maximum Call OI → major resistance.
Maximum Put OI → major support.
These act like psychological barriers where option writers defend positions.
7. Bullish, Bearish, and Neutral Interpretations
Bullish Signs:
Put OI increasing at higher strikes.
Call OI unwinding.
PCR rising above 1.
Long build-up observed in futures.
Bearish Signs:
Call OI increasing at lower strikes.
Put OI unwinding.
PCR falling below 1.
Short build-up in futures.
Neutral/Range-Bound:
Balanced OI between calls and puts.
High OI at both nearest call and put strikes → “straddle zone.”
PCR around 1.
8. Combining OI with Price Action and Volume
Open Interest Chain Analysis is powerful only when combined with price and volume.
Price Up + OI Up + Volume Up → Strong bullish momentum.
Price Down + OI Up + Volume Up → Strong bearish momentum.
Price Sideways + OI Up → Range formation.
Price Up + OI Down → Short covering rally.
Thus, OI confirms whether a price move is genuine or just short-term volatility.
9. Institutional vs Retail Perspective
Institutions (FIIs, DIIs) often write options (sell calls/puts) to collect premium, leading to high OI concentrations.
Retail traders usually buy options, creating temporary OI spikes but often losing to time decay.
Hence, smart traders watch where institutions build OI—those levels become critical.
10. Limitations and Misinterpretations
Lagging Indicator – OI data is end-of-day in many markets.
False Signals – OI can rise due to hedging, not directional bets.
Expiry Week Noise – OI shifts rapidly as contracts near expiry.
Market Structure Differences – In US, OI behaves differently due to weekly expiries vs Indian markets.
Not Standalone – Should be used with price, volume, and broader trend.
11. Practical Case Studies
Case Study 1: Bullish Setup
Nifty at 20,000.
Max Put OI at 19,800, Max Call OI at 20,200.
PCR = 1.2.
Price rising with Put OI addition.
👉 Interpretation: Support strong at 19,800, resistance at 20,200. Bullish bias.
Case Study 2: Bearish Setup
Bank Nifty at 45,000.
Call OI rising at 45,500, Put OI unwinding at 44,800.
Futures showing short build-up.
👉 Interpretation: Resistance building overhead, downside likely.
Case Study 3: Range-Bound Setup
Stock XYZ trading at ₹1000.
Equal OI at 980 Puts and 1020 Calls.
PCR = 1.
👉 Interpretation: Market makers expect sideways movement, straddle possible.
12. Conclusion
Open Interest Chain Analysis is a window into the psychology of derivative markets. It reveals where big players are positioning, what levels they defend, and whether price action has strength behind it.
Key Takeaways:
OI measures open contracts, not trading volume.
Call OI = Resistance, Put OI = Support.
Change in OI + Price helps identify long/short build-ups.
PCR gives overall sentiment.
Best used with price action and volume.
A disciplined trader does not rely solely on OI but combines it with technical analysis, market structure, and macro events to refine decisions. With practice, OI Chain Analysis becomes a powerful tool for forecasting and risk management.
Intraday vs Swing Trading1. Understanding Intraday Trading
Definition
Intraday trading means entering and exiting positions within the same trading day. A trader does not hold any position overnight to avoid overnight risks such as news announcements, earnings reports, or global market volatility.
Characteristics of Intraday Trading
Short Holding Period: Minutes to hours, always squared-off before market close.
High Frequency: Multiple trades per day depending on opportunities.
Focus on Liquidity: Traders choose highly liquid stocks or instruments.
Leverage Usage: Intraday traders often use margin to amplify profits.
Technical Analysis Driven: Relies heavily on charts, price action, and indicators.
Goals of Intraday Traders
Capture small price movements (scalping 0.5–2% moves).
Consistent daily profits rather than waiting for big gains.
Quick decision-making, discipline, and risk management.
2. Understanding Swing Trading
Definition
Swing trading refers to holding positions for a few days to weeks, aiming to capture medium-term price swings. Traders ride upward or downward trends without reacting to every tick.
Characteristics of Swing Trading
Longer Holding Period: From 2–3 days up to several weeks.
Lower Frequency: Fewer trades, but larger profit targets.
Combination of Technical & Fundamental Analysis: Uses chart patterns, moving averages, and sometimes earnings or macroeconomic events.
Tolerance for Overnight Risk: Accepts gaps due to news or global events.
Less Screen Time: Traders analyze at the end of the day and monitor broadly.
Goals of Swing Traders
Catch larger moves (5–20% swings).
Trade with the trend, not intraday noise.
Balance between active trading and long-term investing.
3. Key Differences Between Intraday and Swing Trading
Aspect Intraday Trading Swing Trading
Holding Period Minutes to hours, closed same day Days to weeks
Frequency Many trades daily Few trades monthly
Capital Requirement Lower due to leverage Higher, requires holding without leverage
Risk Level Very high (market noise, leverage) Moderate (overnight risk, but less noise)
Profit Target Small per trade (0.5–2%) Larger per trade (5–20%)
Tools Intraday charts (1-min, 5-min, 15-min) Daily/weekly charts
Time Commitment Full-time, glued to screen Part-time, end-of-day monitoring
Stress Level High, fast decisions needed Lower, patience-based
Best for Aggressive, disciplined traders Patient, trend-following traders
4. Tools & Techniques
Tools for Intraday Trading
Short-term Charts – 1-min, 5-min, 15-min candles.
Indicators – VWAP, RSI, MACD, Bollinger Bands.
Order Types – Market orders, stop-loss, bracket orders.
News Feeds – Corporate announcements, economic data.
Scanners – For identifying stocks with volume and volatility.
Tools for Swing Trading
Daily/Weekly Charts – Identify broader trends.
Indicators – Moving averages (50, 200), RSI, Fibonacci retracement.
Patterns – Head & shoulders, flags, double tops/bottoms.
Fundamentals – Earnings reports, sector trends.
Portfolio Management – Diversification across sectors.
5. Risk & Reward
Intraday Trading Risks
Sudden intraday volatility.
High leverage leading to amplified losses.
Emotional stress leading to overtrading.
Market manipulation in low-volume stocks.
Swing Trading Risks
Overnight gaps due to news or events.
Holding during earnings or geopolitical announcements.
Misjudging long-term trend direction.
Reward Potential
Intraday: Small but frequent gains.
Swing: Fewer but larger gains.
6. Psychology Behind Each Style
Intraday Trader Psychology
Must be quick, disciplined, unemotional.
Can’t afford hesitation; seconds matter.
Needs mental stamina for long hours.
Swing Trader Psychology
Requires patience and conviction in the analysis.
Should handle overnight anxiety calmly.
Avoids micromanaging every tick.
7. Which Style Suits You?
Intraday Trading Suits If:
You can dedicate 6–7 hours daily.
You thrive in fast decision-making.
You handle stress well.
You prefer quick profits.
Swing Trading Suits If:
You have a job or business, can’t sit full-time.
You are patient and prefer analyzing trends.
You’re comfortable holding overnight risk.
You seek balanced trading with less stress.
8. Real-World Example
Imagine Stock XYZ at ₹1000:
Intraday Trader: Buys at ₹1000, sells at ₹1010 same day, booking 1% profit. May repeat 5–10 trades.
Swing Trader: Buys at ₹1000, holds for a week till ₹1150, booking 15% profit. Only 1 trade, but larger reward.
9. Pros & Cons
Pros of Intraday Trading
Quick returns.
Leverage available.
Daily learning experience.
No overnight risk.
Cons of Intraday Trading
Extremely stressful.
High brokerage costs.
Demands full-time attention.
High failure rate for beginners.
Pros of Swing Trading
Less screen time.
Larger profits per trade.
Flexibility to combine with job.
Trend-friendly.
Cons of Swing Trading
Overnight risk.
Requires patience.
Slow capital turnover.
Emotional swings if market gaps down.
10. Conclusion
Intraday and swing trading are two distinct paths to profit from markets. Neither is inherently better — it depends on one’s personality, risk appetite, and lifestyle.
If you thrive in fast-paced environments, can manage stress, and want quick daily profits, intraday trading is suitable.
If you prefer patience, less stress, and bigger swings, and don’t want to monitor markets constantly, swing trading is more fitting.
Ultimately, the best traders often experiment with both, learn their strengths, and settle into the style that complements their psychology. Success depends not just on the strategy, but on discipline, money management, and continuous learning.
Risk Smart, Grow Fast in TradingIntroduction
Trading has always been seen as a path to quick money, fast success, and even financial freedom. But the truth is that trading is not a get-rich-quick game. For every successful trader who grows fast, there are hundreds who lose money because they ignore the most important foundation of trading: risk management.
“Risk Smart, Grow Fast” is not just a catchy phrase. It’s a principle, a mindset, and a strategy. It means that if you manage your risks wisely, protect your capital, and make decisions with discipline, you can grow faster and more sustainably than if you blindly chase high returns. In fact, smart risk management is the engine that powers growth in trading.
This essay explores the philosophy, strategies, tools, and psychology behind trading with a “Risk Smart, Grow Fast” approach.
Part 1: Why Risk Management Is More Important Than Profit
Most new traders focus on one question: “How much can I make?” The right question, however, is: “How much can I lose if I’m wrong?”
In trading, risk always comes before reward. Here’s why:
Capital Preservation – Without capital, there’s no trading. Losing 50% of your account requires a 100% gain to break even. Protecting your downside ensures you stay in the game.
Compounding Effect – Smaller drawdowns allow compounding to work more efficiently. Even modest profits can grow exponentially when losses are controlled.
Emotional Stability – Large losses trigger fear, stress, and revenge trading. Smart risk control keeps emotions in check, enabling rational decision-making.
Sustainable Growth – Fast growth through reckless risk-taking often ends in collapse. True fast growth comes from controlled risk that compounds over time.
Key Idea: You cannot grow fast unless you manage risk smartly.
Part 2: What Does “Risk Smart” Really Mean?
Being risk smart doesn’t mean avoiding risk altogether. Trading is risk by nature; without risk, there is no reward. Instead, it means taking calculated risks that are aligned with your trading strategy, capital, and goals.
Core principles of being Risk Smart:
Position Sizing – Risking only a small percentage of your capital on each trade (usually 1–2%).
Stop Loss Discipline – Always knowing where you will exit if the trade goes wrong.
Diversification – Not putting all capital into one stock, sector, or instrument.
Risk/Reward Ratio – Ensuring potential reward is at least 2–3 times the risk.
Capital Allocation – Spreading money between short-term trades, long-term investments, and safe reserves.
Think of being risk smart like wearing a seatbelt while driving fast. You may enjoy the thrill of speed, but the seatbelt ensures survival if things go wrong.
Part 3: The Growth Mindset in Trading
While being risk smart focuses on protection, “grow fast” focuses on maximizing opportunities. Growth in trading is not just about profits, but also about knowledge, experience, and adaptability.
Components of the Growth Mindset:
Learning from Losses – Every loss is tuition. Smart traders don’t fear losses; they analyze them to refine strategies.
Adapting to Market Conditions – Markets change; strategies must evolve. What works in a trending market may fail in a choppy one.
Scaling Up Gradually – Growing fast doesn’t mean doubling your risk overnight. It means compounding small consistent gains until you can trade larger with confidence.
Leveraging Technology – Using charting tools, algo trading, backtesting, and data analytics to grow faster than traditional traders.
Mind and Body Discipline – Growth requires sharp focus, emotional control, and physical health. Trading is mental warfare; stamina matters.
Part 4: Balancing Risk and Growth
The challenge is balancing risk smart and grow fast. Too much focus on risk may lead to over-caution, missing opportunities. Too much focus on growth may cause reckless risk-taking.
Here’s how to strike the balance:
Risk Small, Scale Big – Start by risking 1–2% per trade. As your capital grows, absolute profits grow faster.
Compound Gains – Reinvest profits strategically instead of withdrawing all earnings.
Optimize Position Sizing – Adjust size based on volatility, conviction, and account size.
Use Asymmetric Setups – Look for trades where upside is significantly greater than downside.
Review Weekly, Act Daily – Analyze risk exposure weekly while executing growth trades daily.
Part 5: Practical Risk Smart Techniques
The 1% Rule – Never risk more than 1% of account value on a single trade.
Example: With $10,000 capital, maximum risk per trade = $100.
The 2:1 or 3:1 Rule – For every $1 risked, aim to make $2–$3.
Stop Loss & Trailing Stops – Set stop losses for protection and use trailing stops to lock profits as the trade moves in your favor.
Risk Diversification –
Across asset classes (stocks, forex, commodities, crypto).
Across sectors (IT, pharma, banking).
Across time horizons (scalping, swing, long-term).
Hedging with Options – Using protective puts or covered calls to cap downside risk.
Volatility Awareness – Adjusting position size based on market volatility (e.g., smaller trades during high VIX).
Part 6: Strategies to Grow Fast
Trend Following – Capturing large moves in trending markets. “The trend is your friend” until it bends.
Breakout Trading – Entering when price breaks major support/resistance levels with volume confirmation.
Swing Trading – Exploiting short- to medium-term price swings for consistent growth.
Position Trading – Holding positions for weeks/months based on macro or sectoral trends.
Leverage Smartly – Using moderate leverage to accelerate growth, but only when risk is tightly controlled.
Scaling In and Out – Adding to winning trades (pyramiding) and reducing exposure on uncertainty.
Part 7: Psychology of Risk Smart Growth
Trading success is 20% strategy and 80% psychology. To “risk smart, grow fast,” a trader must master their mind.
Discipline Over Impulse – Following the plan, not emotions.
Patience to Wait – Avoiding overtrading. Opportunities will always come.
Resilience to Losses – Viewing losses as part of the game, not personal failure.
Confidence Without Arrogance – Trusting your system but staying humble before markets.
Growth Mindset – Believing that skills improve with practice, not fixed by talent.
Part 8: Case Studies
Case 1: The Reckless Trader
Rahul had ₹5 lakhs and doubled it in 3 months by taking huge leveraged bets on penny stocks. But one wrong move wiped out 80% of his capital. His fast growth collapsed because he was not risk smart.
Case 2: The Risk Smart Trader
Anita had ₹5 lakhs too. She risked only 1% per trade, focused on high R/R setups, and compounded profits. In one year, she grew her account to ₹7.5 lakhs steadily. She didn’t double it overnight, but her growth was sustainable and replicable.
Lesson: Fast reckless growth often leads to collapse. Risk smart growth compounds wealth.
Part 9: Tools for Risk Smart Growth
Trading Journal – Records trades, mistakes, emotions, and improvements.
Risk Calculators – To determine position size before placing a trade.
Charting Platforms – TradingView, MetaTrader, NinjaTrader.
Backtesting Software – To validate strategies before applying real capital.
News & Data Feeds – For staying ahead of market-moving events.
AI & Algo Tools – Automating discipline and minimizing emotional decisions.
Part 10: The Roadmap to “Risk Smart, Grow Fast”
Foundation – Learn basics, risk management, and trading psychology.
System Development – Build and backtest your own trading strategy.
Capital Protection – Apply strict stop losses and position sizing.
Small Scale Trading – Start with small capital or paper trading.
Gradual Scaling – Increase trade size as consistency improves.
Compounding Phase – Reinvest profits to accelerate growth.
Mastery & Automation – Use technology and delegation for efficiency.
Conclusion
“Risk Smart, Grow Fast” is not just a slogan—it’s the essence of long-term trading success. The markets will always remain uncertain, volatile, and risky. But if you respect risk, embrace discipline, and use smart strategies, you can not only survive but thrive.
Fast growth in trading doesn’t come from reckless gambling—it comes from the slow magic of compounding, powered by smart risk management.
In the end, trading is like sailing. The winds of the market are unpredictable, but if you set your sails wisely, control your risks, and ride the waves with patience, you can reach your destination faster than you ever imagined.
Inflation Nightmare1. Introduction: Understanding Inflation
Inflation is one of the most powerful forces shaping economies, markets, and daily life. It refers to the general increase in prices of goods and services over time, reducing the purchasing power of money. While moderate inflation is normal in growing economies, an inflation nightmare occurs when prices spiral out of control, destabilizing societies and threatening livelihoods.
To visualize:
If a loaf of bread cost ₹50 last year but now costs ₹100, people feel the direct pinch.
If wages don’t rise as fast as prices, living standards fall.
If inflation expectations rise, people rush to buy today rather than tomorrow, fueling more inflation.
An inflation nightmare is not just about economics; it is also about psychology, politics, and survival.
2. Normal Inflation vs. Inflation Nightmare
Mild/healthy inflation (2–4% per year): Supports growth, encourages spending and investment.
High inflation (6–10% per year): Hurts savings, reduces confidence, and strains households.
Hyperinflation (50%+ per month): Total collapse of currency value, leading to social unrest and chaos.
An inflation nightmare lies in the last two categories—when price rises become unbearable and unpredictable.
3. Causes of Inflation Nightmare
(a) Demand-Pull Inflation
“Too much money chasing too few goods.” When demand surges faster than supply, prices rise. Example: booming economies after wars.
(b) Cost-Push Inflation
When production costs (wages, raw materials, oil, transport) rise, businesses pass costs to consumers. Example: Oil price shocks in the 1970s.
(c) Monetary Expansion
Excessive printing of money by central banks dilutes value. Example: Zimbabwe (2008), Venezuela (2010s).
(d) Supply Chain Disruptions
Pandemic lockdowns, trade wars, and shipping crises push prices higher. Example: Global supply crunch during COVID-19.
(e) Geopolitical Conflicts
Wars and sanctions disrupt trade flows, raising energy and food costs. Example: Russia-Ukraine war impacting wheat, oil, and gas prices globally.
(f) Inflation Expectations
If people believe inflation will rise, they demand higher wages, buy goods early, and businesses raise prices preemptively—creating a self-fulfilling spiral.
4. The Anatomy of an Inflation Nightmare
An inflation nightmare often unfolds in three stages:
Warning Signs – Rising food, rent, and fuel prices, currency weakening, fiscal deficits.
Acceleration Phase – Prices rise monthly, people lose trust in currency, hoarding begins.
Crisis & Collapse – Hyperinflation, barter trade, dollarization, social unrest, political change.
5. Global Case Studies of Inflation Nightmares
(a) Weimar Germany (1920s)
Reparations after WWI and money printing caused hyperinflation.
At peak, prices doubled every 3 days.
Workers were paid twice daily, rushing to buy bread before prices rose.
(b) Zimbabwe (2008)
Government printed excessive money.
Inflation reached 79.6 billion % in one month.
100 trillion Zimbabwean dollar notes became worthless.
(c) Venezuela (2013–2019)
Oil crash + political instability.
Inflation crossed 1,000,000%.
Shortages of medicine, food, and essentials.
(d) Turkey (2021–2023)
Currency crisis and unorthodox monetary policy.
Inflation surged above 80%.
People shifted savings to dollars and gold.
(e) Argentina (Recurring crises)
Chronic fiscal deficits and weak currency.
Inflation near 100% in 2022–2023.
Savings eroded, economy dollarized unofficially.
These examples show how inflation nightmares devastate middle-class savings, destroy business confidence, and topple governments.
6. Impact of Inflation Nightmare
(a) On Households
Shrinking purchasing power.
Rising food, rent, and utility costs.
Erosion of savings and pensions.
Decline in living standards.
(b) On Businesses
Rising input costs.
Uncertainty in planning and investment.
Pressure to increase prices, risking demand collapse.
(c) On Investors
Bonds and fixed deposits lose value.
Stock markets volatile.
Safe havens like gold and real estate gain.
(d) On Governments
Pressure to increase subsidies and social spending.
Difficulty in borrowing as bond yields rise.
Risk of political instability and protests.
(e) On Global Trade
Exchange rate volatility.
Higher import bills for energy and food.
Capital flight to stable economies.
7. Why Inflation Nightmares are Dangerous
Uncertainty: People don’t know future prices, making planning impossible.
Wealth Destruction: Savings, pensions, and salaries evaporate in real terms.
Inequality: Rich hedge via assets, poor suffer most.
Loss of Trust: Citizens lose faith in government and currency.
Social Chaos: Strikes, protests, and riots often follow.
8. Inflation Nightmare in the 2020s Context
COVID-19 pandemic: Stimulus packages + supply bottlenecks fueled inflation.
Russia-Ukraine War: Spikes in oil, gas, and food prices globally.
Climate Change: Crop failures push food inflation higher.
De-dollarization debates: Weakening confidence in traditional reserve currencies.
Countries like Sri Lanka (2022) faced an inflation nightmare with shortages of fuel, medicine, and food—leading to political collapse.
9. Coping Mechanisms during an Inflation Nightmare
(a) Individual Level
Shift savings to inflation-protected assets (gold, real estate, equities).
Cut discretionary spending.
Focus on skills that secure wage growth.
(b) Business Level
Hedge raw material costs.
Diversify suppliers.
Innovate with technology to reduce costs.
(c) Government Level
Tight monetary policy (raise interest rates).
Fiscal discipline (reduce deficit spending).
Strengthen currency reserves.
Subsidies for essentials to protect poor households.
10. Lessons from History
Prevention is better than cure: Once hyperinflation starts, it is hard to stop.
Trust is key: Currency depends on people’s confidence.
Independent central banks are vital for credibility.
Diversification of economy prevents over-dependence (like Venezuela on oil).
Conclusion
An inflation nightmare is more than rising prices—it is the collapse of trust in money itself. History shows how devastating it can be, destroying middle-class security, collapsing businesses, and reshaping politics.
While moderate inflation is a sign of growth, uncontrolled inflation can become a nightmare—haunting economies for decades. The key lies in responsible policies, diversified economies, and resilient households.
Just like nightmares disturb our sleep, inflation nightmares disturb the dream of economic stability.
Healthy Pause in Gold’s Rally, Bulls Still in ControlGold has finally started to show a healthy daily correction after its sharp rally and breakout above 3500. This pullback was not unexpected, as intraday charts were looking overstretched in the last sessions. Despite today’s dip, the broader structure remains strong with momentum still favoring the upside as long as key supports hold. For the short term, 3500 (previous high) will be the immediate level to watch, followed by 3450 as secondary support. Holding above these levels will keep the bullish trend intact, and any stabilization here can set the stage for another leg higher. Overall, the correction looks more like a consolidation phase rather than a reversal, keeping the bigger picture positive.

Trading Master Class With ExpertsBeginner-Friendly Option Trading Strategies
Let us now study some beginner-friendly option trading strategies in detail.
Covered Call Strategy
Best for: Investors who already own shares.
Market Outlook: Neutral to slightly bullish.
How it works:
Buy or hold 100 shares of a company.
Sell (write) a call option on the same stock.
Example:
You own Infosys shares bought at ₹1600.
You sell a call option at strike ₹1700 for ₹30 premium.
Outcomes:
If Infosys stays below ₹1700, you keep the ₹30 premium (profit).
If Infosys rises above ₹1700, you must sell shares at ₹1700. You still make profit because your cost was ₹1600.
Pros:
Generates steady income.
Low risk.
Cons:
Your profit is capped if stock rises sharply.
Educational takeaway: A covered call is like earning rent on a property you own.
Protective Put Strategy
Best for: Investors who want insurance for their portfolio.
Market Outlook: Bullish, but with fear of downside risk.
How it works:
Buy shares of a company.
Buy a put option for protection.
Example:
You buy TCS shares at ₹3600.
You purchase a put option with strike ₹3500 for ₹50.
If TCS falls to ₹3300, your shares lose ₹300. But your put option gains value, limiting your losses.
Pros:
Acts like insurance.
Protects against big losses.
Cons:
Premium cost reduces net return.
Educational takeaway: A protective put is like buying health insurance—you hope not to use it, but it provides safety.
