Trading with AI: Revolutionizing Financial Markets1. Understanding AI in Trading
AI in trading refers to the use of machine learning algorithms, deep learning, natural language processing, and other advanced computational methods to analyze market data and make trading decisions. Unlike traditional trading, which relies heavily on human intuition and manual analysis, AI trading systems can process massive datasets, detect patterns, and execute trades with minimal human intervention.
Key aspects include:
Machine Learning Models: Used to forecast price movements, volatility, and trading volume.
Algorithmic Trading: AI systems can automate order placement, optimizing timing and pricing.
Predictive Analytics: Historical market data is analyzed to predict future trends.
AI-powered trading aims to reduce human biases, improve decision speed, and increase profitability by leveraging data-driven insights.
2. Types of AI Trading Strategies
AI trading encompasses multiple strategies depending on market objectives and risk tolerance. Some of the most common strategies include:
Algorithmic Trading: AI algorithms execute high-frequency trades based on predefined rules and patterns.
Sentiment Analysis Trading: AI systems analyze news, social media, and financial reports to gauge market sentiment and predict price movements.
Predictive Modeling: Machine learning models predict asset prices using historical and real-time data.
Reinforcement Learning: AI agents learn optimal trading strategies through trial and error in simulated environments.
Each strategy has its own strengths and challenges. For instance, high-frequency trading (HFT) requires extremely low-latency systems, whereas sentiment analysis relies on natural language processing and advanced data scraping.
3. AI in Market Data Analysis
The financial market generates enormous volumes of structured and unstructured data daily, including stock prices, order books, news articles, social media posts, and economic indicators. Human traders cannot efficiently process this volume in real-time. AI excels in:
Pattern Recognition: Identifying recurring price patterns and anomalies.
Correlation Analysis: Detecting relationships between assets or markets that humans may overlook.
Event Impact Analysis: Evaluating how geopolitical events, policy changes, or corporate announcements affect markets.
By leveraging AI, traders gain actionable insights from complex datasets that improve the accuracy of predictions and reduce reaction time.
4. Risk Management and AI
Effective risk management is crucial in trading, and AI can significantly enhance it by:
Real-Time Monitoring: AI models track portfolio risks continuously and alert traders to potential exposure.
Dynamic Position Sizing: Algorithms can adjust trade sizes based on volatility and market conditions.
Predictive Risk Assessment: Machine learning models forecast potential losses and drawdowns using historical data.
AI reduces human error in risk assessment and allows traders to maintain discipline even during highly volatile market conditions.
5. Benefits of AI Trading
AI-driven trading offers several advantages over traditional methods:
Speed and Efficiency: AI systems can process data and execute trades in milliseconds, outperforming human reaction times.
Data-Driven Decisions: Trading decisions are based on analytics and predictive modeling rather than emotions or intuition.
Consistency: AI executes strategies consistently without being influenced by fear or greed.
Adaptive Learning: Machine learning models evolve and improve over time with more data.
Cost Reduction: Automated AI trading reduces the need for large trading teams and manual intervention.
These benefits make AI an indispensable tool for hedge funds, institutional traders, and increasingly, retail investors.
6. Challenges in AI Trading
Despite its advantages, AI trading comes with challenges:
Model Overfitting: AI models may perform well on historical data but fail in real market conditions.
Data Quality Issues: Inaccurate or incomplete data can lead to wrong predictions.
Market Impact: High-frequency AI trades can contribute to market volatility.
Regulatory Risks: Financial regulators are increasingly scrutinizing AI trading to prevent market manipulation and ensure transparency.
Technical Complexity: Developing, testing, and maintaining AI trading systems requires expertise in data science, finance, and computing infrastructure.
Traders must balance AI capabilities with careful oversight and risk management to mitigate these challenges.
7. AI in Retail Trading
Traditionally, AI trading was limited to institutional players due to high infrastructure costs. However, advances in cloud computing, APIs, and AI platforms have democratized access:
Robo-Advisors: AI-driven advisory platforms provide portfolio management, asset allocation, and personalized investment advice for retail investors.
AI Trading Bots: Retail traders can leverage automated bots to execute trades based on algorithms.
Sentiment-Based Trading Apps: Apps analyze social media sentiment and news to provide trading signals.
Retail adoption of AI trading has grown exponentially, allowing smaller investors to compete more effectively in financial markets.
8. The Future of AI in Trading
The future of trading is intertwined with AI. Key trends likely to shape AI trading include:
Integration of Quantum Computing: Accelerating AI model training and improving prediction accuracy.
Hybrid Models: Combining human judgment with AI analytics for optimal decision-making.
Ethical AI and Transparency: Regulators will demand explainable AI models to prevent unfair advantages and ensure market integrity.
Cross-Market AI Systems: AI will simultaneously analyze equities, commodities, forex, and crypto markets to identify arbitrage and hedging opportunities.
AI in ESG Investing: AI can assess environmental, social, and governance factors to guide sustainable investment decisions.
As AI continues to evolve, it will not only enhance trading efficiency but also reshape how markets operate globally.
Conclusion
AI trading represents a paradigm shift in financial markets, transforming how data is analyzed, trades are executed, and risks are managed. By combining speed, precision, and predictive power, AI allows traders—both institutional and retail—to make smarter, more informed decisions. However, successful AI trading requires robust infrastructure, high-quality data, careful risk management, and continuous monitoring to navigate challenges effectively.
The ongoing convergence of AI, big data, and financial markets promises a future where trading is faster, smarter, and increasingly automated, while still requiring human oversight to ensure ethical and strategic decision-making.
Trading

XAUUSD – Price Channel Rising Towards 4000 USD Next Week
Hello Traders,
Every day I share scenarios for you to refer to and build your own strategy. And here is the perspective for next week – as gold is in a sustainable uptrend, approaching the psychological mark of 4000 USD.
Technical Perspective
On the H4 frame, gold continues to move within a clear upward price channel.
Every time the price touches the support trendline, a strong rebound reaction appears, indicating that buying pressure still dominates.
This price channel has remained stable for many weeks, providing a basis for us to prioritise buying in line with the trend.
The target of 4000 USD is not far away, especially when the fundamental context continues to support the upward trend.
Fundamental Context
The market is expecting the Fed to continue cutting interest rates in October, creating momentum for gold.
Current US financial-economic news is limited, as the US Government remains shut down.
Geopolitical factors have somewhat cooled down, but gold still holds its position as an important safe-haven asset.
Trading Scenario
1. Buy (main priority):
Entry: 3860 – 3865 (at the rising trendline).
TP: 3960 – 4000.
SL: manage below the trendline.
2. Sell (backup if the channel breaks):
Condition: 3853 is breached.
At that point, a new trend will form and the Sell scenario will be activated.
Conclusion
Main trend: Buy in line with the rising channel, aiming for 4000 USD next week.
Sell should only be considered if there is confirmation of a break below 3853.
The market is in a critical phase, so be patient and wait for a good entry point to trade safely and effectively.

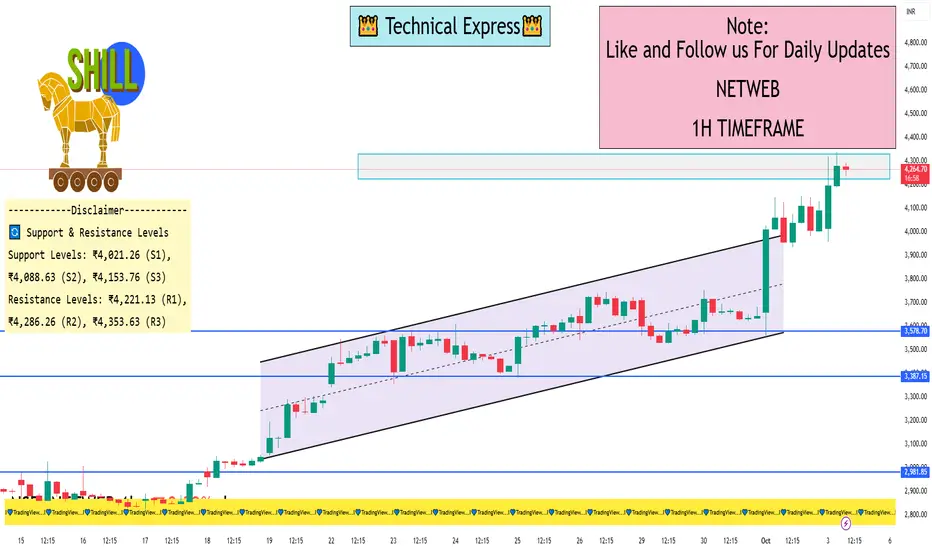
NETWEB 1 Hour ViewNETWEB is trading at ₹4,216.00, reflecting a 3.79% increase from the previous close.
📈 1-Hour Technical Analysis (as of 10:43 AM IST)
Based on intraday data, here are the key technical indicators for NETWEB on the 1-hour timeframe:
Relative Strength Index (RSI): 81.37 — indicates the stock is in the overbought zone, suggesting potential for a short-term pullback.
Moving Average Convergence Divergence (MACD): 395.90 — confirms a strong bullish momentum.
Average Directional Index (ADX): 60.55 — suggests a strong trend in the market.
Stochastic Oscillator: 89.93 — indicates the stock is in the overbought zone.
Super Trend: ₹3,386.37 — supports the current upward movement .
Williams %R: -4.50 — suggests the stock is in the overbought zone.
🔄 Support & Resistance Levels
According to pivot point analysis, the key support and resistance levels for NETWEB are:
Support Levels: ₹4,021.26 (S1), ₹4,088.63 (S2), ₹4,153.76 (S3).
Resistance Levels: ₹4,221.13 (R1), ₹4,286.26 (R2), ₹4,353.63 (R3).
The current price of ₹4,216.00 is near the R1 resistance level, indicating potential for a breakout if the price surpasses this level.
📊 Trend Analysis
The stock is exhibiting strong bullish indicators across multiple timeframes, including the 1-hour chart. The RSI, MACD, and ADX all suggest a continuation of the upward trend. However, the overbought conditions indicated by the RSI, Stochastic Oscillator, and Williams %R suggest that traders should be cautious of potential short-term pullbacks.
LiamTrading – Gold Plan: Wide Range + US Politics Exert PressureLiamTrading – Gold Plan: Wide Range + US Politics Exert Pressure
Gold continues to fluctuate within a wide range as market sentiment is heavily influenced by news from the United States. On 3rd October, the US Senate is expected to re-vote on the temporary budget bill. If it fails, the federal government could shut down, extending into the next week. This will undoubtedly have a significant impact on safe-haven flows, making gold more sensitive to key technical resistance zones.
📊 Technical Analysis – Chart H1
Gold is moving within a wide sideways structure, oscillating around strong resistance – support zones.
Fibonacci Resistance + Psychological level around 3878–3881 → suitable for short-term Sell scalping.
Confluence support (Retest + Volume) around 3828–3830 → ideal zone to watch for Buy, expecting a recovery wave.
The larger trend still leans towards an increase, however, in the short term, the market will experience several liquidity sweeps.
🎯 Trading Scenario
Sell (short-term – prioritise on M15):
Entry: 3878–3881
SL: 3886
TP: 3860 – 3855 – 3840 – 3822 – 3810
Buy (retest support + volume):
Entry: 3828–3830
SL: 3822
TP: 3845 – 3860 – 3877 – 3890
📌 Conclusion
Today's range is quite wide, suitable for scalping according to psychological resistance zones.
Short-term Sell at Fibonacci resistance points.
Buy when price retests confluence support with volume.
Political news from the US will be a catalyst causing significant gold volatility, so it's crucial to maintain disciplined capital management.
👉 Keep a close watch on the scenarios, I will update regularly as the market experiences new movements.

XAUUSD – Prioritise Sell After Breaking Trendline
Hello Traders,
Gold has experienced a strong upward movement for several consecutive days, but currently, the market is showing significant reversal signals. The upward trendline on H4 has been broken, confirming the weakening buying momentum. In the medium term, the preferred scenario will be selling rather than continuing to chase buys.
Basic Context
The US Treasury has just repurchased an additional 2 billion USD in bonds, raising the total repurchase this week to 4.9 billion USD. This move indicates an effort to stabilise the bond market but also reflects significant pressure on the USD and the US financial situation.
In the short term, the injection of additional bond liquidity makes gold's movement more unpredictable, and the trendline break at this time is an important warning signal.
Technical Perspective
Breaking the upward trendline → confirms a structural change.
MACD signals weakening, with buyers losing clear strength.
The 3865 – 3868 zone is a beautiful resistance retest point to Sell.
If the price falls deeply, the support zones around 3830 – 3810 – 3790 will be the next targets.
Today's Trading Scenario
Sell (main priority):
Entry: 3865 – 3868
SL: 3875
TP: 3855 – 3832 – 3810 – 3790
Buy Scalping (counter-trend – high risk):
Entry: 3803 – 3805
SL: 3795
TP: 3822 – 3835 – 3850
Conclusion
Gold has broken the trendline, prioritising Sell in the short and medium term.
News from the US bond market further emphasises the risk of instability, making counter-trend Buy moves suitable only for short-term Scalping.
Follow me for the earliest updates on scenarios as price paths change.

Gold Holds Above 3850 But Faces Resistance at 3890–95 ZoneAfter printing a rejection candle on Wednesday, gold followed up with further weakness yesterday, but once again bulls managed to defend and push the price back above 3850, securing a daily close above this level. This makes 3850 the immediate support to watch, and only a confirmed H4 close below it could open the door for a deeper test of the 3810–3800 zone, which remains the next key support area. The current price action suggests that the much-expected pullback is underway, though it looks more like a healthy cooldown rather than a reversal, as the broader structure remains bullish. On the upside, the 3890–3895 zone is acting as immediate resistance and will be the key hurdle for bulls in the short term.

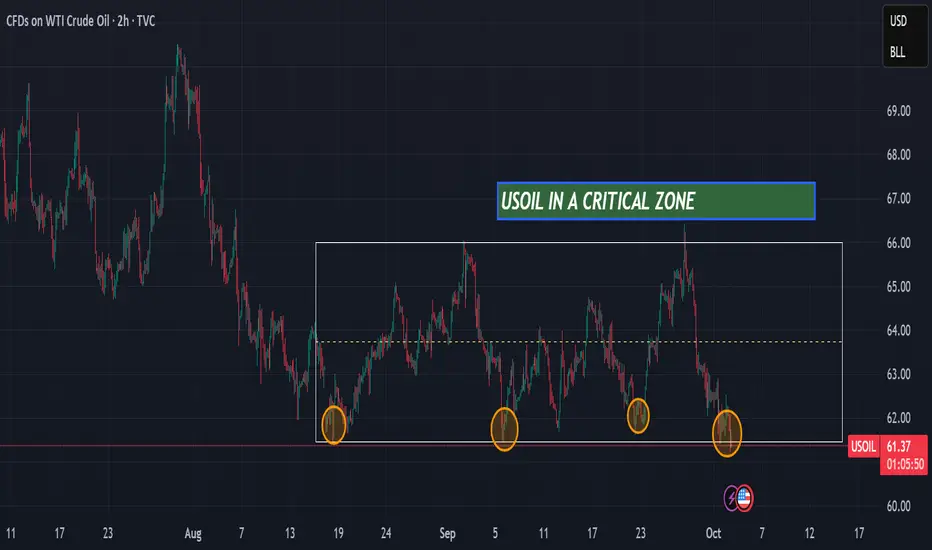
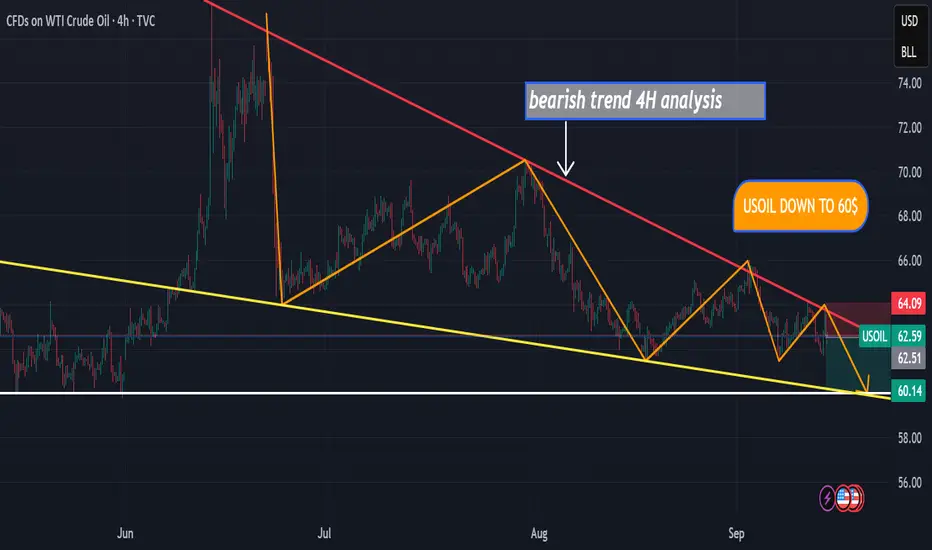
USOIL is in a critical zoneHello,
USOIL is currently at a major support level that has held for the past 2 months. There are two possible scenarios: either the support holds and USOIL bounces back toward the resistance at $66, or the support breaks and the price moves down to the next level at $60,
Ibrouri Abdessamad
Option Trading SecretsPart 1: Understanding Options – The Foundation of Secrets
1.1 What Are Options?
Options are financial derivatives that give the holder the right, but not the obligation, to buy or sell an asset at a predetermined price (strike price) before a certain date (expiry). There are two main types:
Call Options: Right to buy.
Put Options: Right to sell.
Secret Insight: Many traders fail because they focus on “predicting direction” rather than understanding the time value and volatility embedded in options prices.
1.2 Components of an Option
Strike Price – The predetermined price of the underlying asset.
Expiry Date – The date the option contract expires.
Premium – The price paid to buy the option.
Intrinsic Value – The value if exercised today.
Time Value – Additional value due to the time left until expiry.
Secret Insight: Time decay (Theta) is often overlooked. Successful option traders exploit time decay instead of fighting against it.
1.3 Why Trade Options?
Leverage: Small capital controls large positions.
Flexibility: Can profit in bullish, bearish, or neutral markets.
Hedging: Protects your stock portfolio against losses.
Income Generation: Selling options (writing calls/puts) can create steady cash flow.
Secret Insight: Most beginners try to predict market direction, while pros focus on probability, risk management, and strategic positioning.
Part 2: Core Option Trading Secrets
2.1 Volatility – The Hidden Force
Volatility is the heartbeat of option pricing.
Implied Volatility (IV): Market’s forecast of future volatility.
Historical Volatility (HV): Past price movement.
Secret Insight: Options are more expensive when IV is high. Selling options in high IV periods and buying in low IV periods can increase success probability.
2.2 The Greeks – Your Secret Weapons
Understanding the Greeks is crucial:
Delta: Sensitivity to underlying price.
Gamma: Rate of change of Delta.
Theta: Time decay effect.
Vega: Sensitivity to volatility.
Rho: Sensitivity to interest rates.
Secret Insight: Most traders obsess over price prediction. Successful traders control risk by managing Greeks, not just by buying/selling calls or puts.
2.3 The Myth of Directional Trading
While buying calls in a bullish market or puts in a bearish market is intuitive, it’s often a losing strategy if done without:
Timing
Volatility awareness
Strike price selection
Secret Insight: Many profits come from neutral strategies that capitalize on time decay or volatility changes.
Part 3: Advanced Option Strategies – Secrets of the Pros
3.1 Spreads – Reducing Risk and Cost
Vertical Spread: Buy and sell options of the same type and expiry but different strikes.
Horizontal/Calendar Spread: Exploit time decay differences.
Diagonal Spread: Combines vertical and horizontal spreads for advanced hedging.
Secret Insight: Spreads reduce cost and risk while keeping profit potential. Many retail traders ignore them, chasing naked options for huge gains and ending up in losses.
3.2 Iron Condors & Butterflies – Secrets for Range-Bound Markets
Iron Condor: Sell OTM calls and puts, buy further OTM options to hedge risk.
Butterfly Spread: Profit from minimal movement around a target price.
Secret Insight: The real secret is managing position size and probability. Profitable options trading often comes from small, consistent wins rather than rare big wins.
3.3 Protective Strategies – Hedging Like a Pro
Protective Puts: Own stock but buy puts to limit downside.
Covered Calls: Own stock and sell calls to generate income.
Secret Insight: The best traders treat options primarily as insurance and income tools, not just speculation.
Part 4: Risk Management Secrets
4.1 Position Sizing
Never risk more than 1–2% of capital on a single trade.
Adjust size based on volatility and Greeks.
Secret Insight: Even the best strategies fail without disciplined capital management.
4.2 Avoiding Common Traps
Buying deep OTM options as “lottery tickets.”
Ignoring IV crush after earnings.
Over-leveraging and underestimating Theta decay.
Secret Insight: Most traders fail psychologically before failing technically. Emotional control is a secret weapon.
4.3 The Power of Probability
Options trading isn’t gambling—it’s about stacking probabilities in your favor.
Favor high probability setups with defined risk.
Accept small consistent profits over chasing massive gains.
Part 5: Market Timing Secrets
5.1 Earnings and Events
Options react violently to earnings, FOMC, or geopolitical events.
Secret Insight: Use spreads or iron condors around events rather than naked buying. This controls risk while keeping upside potential.
5.2 Using Technical Analysis
Support/resistance levels, trend lines, and moving averages can guide strike selection.
Combine technicals with implied volatility for high-probability trades.
Secret Insight: Pros don’t blindly buy calls and puts—they combine technical triggers with probability and volatility analysis.
5.3 Psychological Edge
Patience beats impulsiveness.
Accept losses quickly; let winners run within limits.
Secret Insight: Trading psychology, discipline, and emotional control are the ultimate secrets that most books don’t emphasize.
Part 6: Building a System – From Secrets to Strategy
6.1 Developing a Personal Edge
Track historical trades and analyze winning patterns.
Identify setups where probability favors you.
Stick to trades that fit your risk tolerance.
6.2 Journaling & Review
Record each trade: entry, exit, rationale, and outcome.
Evaluate mistakes objectively.
Secret Insight: The market doesn’t care about your emotions. Your edge grows from systematic review and refinement.
6.3 Continuous Learning
Study options pricing models, volatility surfaces, and macro events.
Attend webinars, read research reports, and adapt strategies.
Conclusion
Option trading secrets are not magic formulas; they are disciplined habits:
Understanding volatility and Greeks.
Using spreads and hedges to control risk.
Managing position sizes and emotions.
Timing trades around probability and technical setups.
Constant learning and adaptation.
By mastering these secrets, traders can transform options trading from risky speculation to a high-probability, strategic, and disciplined pursuit.
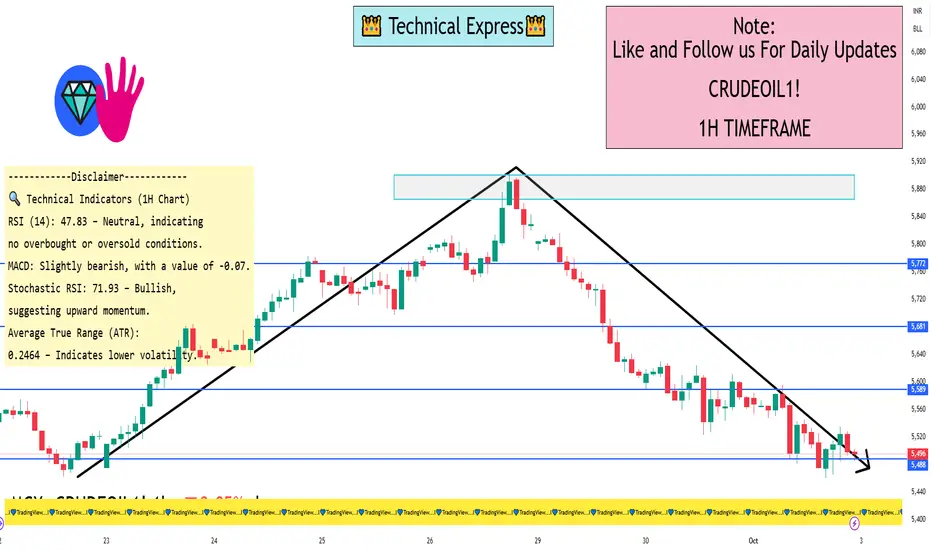
ITC 1 Day View📉 Key Support Levels (1H Timeframe)
₹5,436.67 – Immediate support level.
₹5,357.00 – Next support zone.
📈 Key Resistance Levels (1H Timeframe)
₹5,629.00 – Immediate resistance level.
₹5,708.67 – Next resistance zone.
🔍 Technical Indicators (1H Chart)
RSI (14): 47.83 – Neutral, indicating no overbought or oversold conditions.
MACD: Slightly bearish, with a value of -0.07.
Stochastic RSI: 71.93 – Bullish, suggesting upward momentum.
Average True Range (ATR): 0.2464 – Indicates lower volatility.
Overall, the 1-hour chart shows a neutral to slightly bullish trend, with price action confined between ₹5,436.67 and ₹5,629.00. A breakout above ₹5,629.00 could target ₹5,708.67, while a drop below ₹5,436.67 may lead to retesting lower support levels.
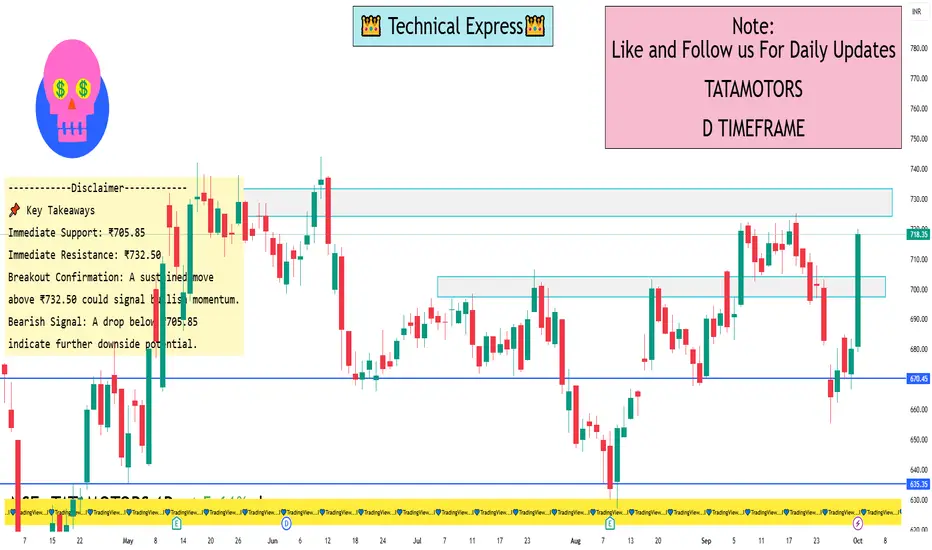
TATAMOTORS 1 Day View📈 Daily Support & Resistance Levels
Immediate Support: ₹705.85
Immediate Resistance: ₹732.50
Pivot Point: ₹705.85
These levels are derived from the Classic Pivot Point analysis, indicating that the stock is trading near its pivot point, suggesting a neutral bias with potential for breakout or pullback depending on market momentum.
🔁 Fibonacci Retracement Levels
Key Support Levels:
23.6%: ₹694.85
38.2%: ₹664.45
50%: ₹639.88
61.8%: ₹615.30
Key Resistance Levels:
23.6%: ₹767.50
38.2%: ₹797.90
50%: ₹822.47
61.8%: ₹847.05
These Fibonacci levels provide potential support and resistance zones, useful for identifying entry and exit points.
📉 Technical Indicators
Relative Strength Index (RSI): Approximately 42.6, indicating early bullish momentum.
Moving Averages: The stock is trading below its 5-day and 13-day moving averages, suggesting a bearish trend.
🧭 Trend Analysis
The stock is currently trading near its pivot point, indicating a neutral bias. A breakout above ₹732.50 could signal bullish momentum, while a drop below ₹705.85 may indicate further downside potential.
📌 Key Takeaways
Immediate Support: ₹705.85
Immediate Resistance: ₹732.50
Breakout Confirmation: A sustained move above ₹732.50 could signal bullish momentum.
Bearish Signal: A drop below ₹705.85 may indicate further downside potential.
Indian SME IPOs: High Rewards Amidst High RisksPart 1: Introduction to SME IPOs in India
Small and Medium Enterprises (SMEs) are the backbone of India’s economy, contributing significantly to employment, GDP, and innovation. Recognizing their importance, the Indian government and capital markets have encouraged SMEs to access public funding through Initial Public Offerings (IPOs). Unlike traditional IPOs on the main board, SME IPOs are specifically designed to allow smaller companies to raise capital efficiently while offering retail and institutional investors opportunities to participate in potentially high-growth ventures.
Definition and Characteristics of SME IPOs
SME IPOs are offerings of equity by small and medium enterprises listed on the SME segment of recognized stock exchanges, primarily the BSE SME and NSE Emerge platforms. The eligibility criteria for SMEs include:
Minimum net worth and profitability standards.
A track record of at least two years of operations.
Compliance with corporate governance standards.
SME IPOs typically have a lower investment size compared to mainboard IPOs, making them accessible to retail investors. The minimum application amount is often around ₹1–2 lakh, while the maximum may vary depending on the issue size.
Why SMEs Go Public
SMEs pursue IPOs for several reasons:
Capital for Expansion: SME IPOs provide companies with funds to expand operations, invest in new technology, or enter new markets.
Brand Visibility: Listing enhances a company’s visibility and credibility among clients, suppliers, and investors.
Liquidity and Exit Opportunities: Founders, early investors, and venture capitalists gain a structured exit route.
Attract Talent: A public listing makes it easier to offer stock options and attract skilled professionals.
Potential for High Rewards
SME IPOs are high-risk, high-reward opportunities. Unlike established companies, SMEs operate in niche markets or emerging sectors, meaning a successful IPO can yield significant returns. Historically, some SME IPOs have delivered returns of 50–200% within a year of listing, attracting speculative and growth-focused investors. However, it’s important to note that the risks are also higher, including market volatility, limited liquidity, and operational challenges.
Conclusion of Part 1
The SME IPO segment offers a unique avenue for investors seeking exposure to high-growth, smaller companies in India. With regulatory support, increasing investor awareness, and improved market infrastructure, SME IPOs are becoming a mainstream avenue for wealth creation.
Part 2: Regulatory Framework and Listing Process
The growth of SME IPOs in India has been facilitated by clear regulatory frameworks established by SEBI (Securities and Exchange Board of India) and the stock exchanges. These frameworks ensure investor protection while promoting SME participation in public markets.
SEBI Guidelines for SME IPOs
SEBI has set distinct rules for SMEs to streamline the IPO process:
Companies must have a post-issue capital of at least ₹10 crore.
Mandatory appointment of a merchant banker to manage the issue.
Submission of a prospectus detailing financials, business model, risks, and future plans.
Listing on SME platforms like BSE SME or NSE Emerge, not the mainboard initially.
The IPO Process for SMEs
The process for an SME IPO typically includes:
Appointment of Merchant Banker: To ensure compliance with SEBI regulations and guide the company through the listing process.
Preparation of Draft Prospectus: Includes financial statements, growth plans, risk factors, and use of IPO proceeds.
SEBI Approval: Draft prospectus is submitted to SEBI for review and approval.
Pricing and Marketing: The IPO can be priced via fixed price or book-building route. SMEs often use book-building to determine fair value.
IPO Launch and Subscription: Investors, including retail and institutional, subscribe to the shares during the IPO period.
Listing: Once shares are allotted, they get listed on SME platforms, enabling trading and liquidity.
Investor Protection Measures
Despite being high-growth, high-risk investments, SME IPOs incorporate measures for investor protection:
Disclosure of risk factors and financials.
Requirement of a market maker to maintain liquidity.
SEBI guidelines for lock-in periods for promoters, reducing the risk of sudden sell-offs.
Conclusion of Part 2
A strong regulatory framework ensures transparency, investor confidence, and orderly growth of the SME IPO market. Understanding this framework helps investors evaluate the potential risks and rewards before committing capital.
Part 3: Factors Driving High Returns in SME IPOs
High returns in SME IPOs are driven by a combination of market dynamics, company fundamentals, and investor sentiment.
1. Growth Potential of SMEs
Many SMEs operate in emerging sectors such as technology, renewable energy, healthcare, and specialty manufacturing. These sectors have higher growth potential compared to mature industries, making them attractive for investors seeking exponential returns.
2. Market Inefficiencies and Speculation
SME stocks often have lower liquidity, creating price inefficiencies. Early investors who identify strong companies can benefit from rapid price appreciation after listing.
3. Promoter Credibility and Track Record
A promoter’s experience, credibility, and operational success significantly influence investor confidence. Companies with visionary leadership tend to perform better post-IPO, often rewarding early investors.
4. Favorable Economic Conditions
Macroeconomic factors like GDP growth, low interest rates, and government incentives for SMEs can amplify returns. For instance, policies promoting Make in India or technology adoption can increase SME valuations.
5. Undervalued Offerings
SME IPOs often carry lower valuations compared to mainboard companies. Investors with careful fundamental analysis can identify undervalued opportunities poised for growth.
6. Role of Market Makers
BSE and NSE mandate market makers for SME stocks, ensuring continuous buying and selling, which can reduce volatility and provide price support during initial trading days.
Conclusion of Part 3
High returns in SME IPOs are a result of the interplay between intrinsic company value, sector growth potential, market sentiment, and regulatory mechanisms. However, investors must exercise caution and due diligence to avoid speculative pitfalls.
Part 4: Risks and Challenges in Investing in SME IPOs
While SME IPOs promise high rewards, they are accompanied by unique risks that investors must understand.
1. Limited Operational Track Record
SMEs often have shorter business histories. Any operational misstep, market slowdown, or competitive threat can significantly impact profitability and share price.
2. Lower Liquidity
SME stocks trade on smaller platforms with fewer participants, leading to thin order books. This can result in higher price volatility and difficulty in exiting positions quickly.
3. Market Volatility
SME IPOs are more sensitive to broader market swings. Even positive company performance may not prevent stock prices from falling during bearish market conditions.
4. Regulatory and Compliance Risks
Although SEBI regulates SME IPOs, non-compliance, reporting delays, or governance lapses can affect investor confidence and share performance.
5. Sector-Specific Risks
Many SMEs operate in niche sectors that may face rapid technological changes, policy shifts, or demand fluctuations, affecting long-term sustainability.
6. Overvaluation at Listing
Due to hype, some SME IPOs may be overpriced relative to fundamentals, exposing investors to short-term losses post-listing.
Risk Mitigation Strategies
Diversification: Avoid concentrating capital in one SME IPO.
Fundamental Analysis: Study financials, business model, and growth prospects.
Monitor Market Maker Activity: Ensure liquidity support is sufficient.
Long-Term Perspective: SME IPOs often perform better over 1–3 years than in the immediate post-listing period.
Conclusion of Part 4
Understanding risks is critical for balancing potential high rewards. While SME IPOs can deliver significant returns, careful due diligence, prudent investment size, and long-term perspective are essential to mitigate inherent risks.
Part 5: Strategies for Successful Investment in SME IPOs
Investors can maximize rewards from SME IPOs by combining research, timing, and portfolio management strategies.
1. Identifying Promising SMEs
Focus on companies with:
Strong fundamentals and consistent revenue growth.
Experienced promoters with proven track records.
Products or services in emerging or high-demand sectors.
2. Timing and Market Sentiment
Investors should monitor:
IPO subscription trends: Oversubscription indicates strong demand.
Market conditions: Bullish markets often favor strong listing gains.
Listing day performance and early trading trends for post-IPO opportunities.
3. Diversification Across Sectors
Investing in multiple SME IPOs across different industries reduces sector-specific risk and increases chances of capturing high-growth opportunities.
4. Leveraging Advisory Services
Merchant bankers, financial analysts, and SEBI-registered advisors can provide insights into valuation, risk factors, and listing prospects.
5. Long-Term Investment Approach
While short-term gains are possible, many SME IPOs achieve substantial growth over 1–3 years. Investors focusing on long-term growth can benefit from compounding returns and company expansion.
6. Monitoring Post-Listing Performance
After listing, track:
Quarterly financial results.
Market share growth and competitive positioning.
Promoter activity and adherence to corporate governance.
7. Exit Strategies
Plan exits based on valuation targets or fundamental deterioration. Avoid panic selling during short-term market volatility.
Conclusion of Part 5
SME IPOs represent a compelling opportunity for investors willing to take calculated risks. By combining careful research, diversification, long-term vision, and active monitoring, investors can participate in India’s growth story and potentially achieve high rewards from the SME IPO segment.
Overall Conclusion
Indian SME IPOs are a vibrant, high-potential segment that balances risk with opportunity. Regulatory support, growth potential, and market mechanisms make it possible for investors to reap significant rewards, provided they adopt disciplined investment strategies. By understanding the nuances, risks, and strategies discussed, investors can confidently navigate the SME IPO landscape in India.

Bonds and Fixed-Income Trading Strategies1. Introduction to Bonds and Fixed Income
1.1 What Are Bonds?
A bond is a debt security, essentially a loan made by an investor to a borrower (typically a government, corporation, or financial institution). The borrower promises to pay periodic interest (coupon payments) and to return the principal (face value) at maturity. Bonds are considered fixed-income securities because they generally provide predictable returns over time.
Key components of a bond:
Face Value (Par Value): Amount repaid at maturity.
Coupon Rate: Annual interest percentage based on face value.
Maturity Date: When the principal is repaid.
Issuer: Entity borrowing the funds.
1.2 Importance of Bonds
Bonds serve several key functions:
Income Generation: Provide stable cash flows through coupons.
Portfolio Diversification: Lower correlation with equities reduces portfolio volatility.
Capital Preservation: Generally lower risk than stocks, especially government bonds.
Market Signaling: Bond yields reflect interest rate expectations and economic conditions.
2. Types of Bonds
Understanding the types of bonds is foundational for trading strategies:
2.1 Government Bonds
Issued by national governments; considered low risk.
Examples: U.S. Treasuries, Indian Government Securities (G-Secs).
Typically used for safe-haven investing.
2.2 Corporate Bonds
Issued by companies to raise capital.
Higher yields than government bonds due to default risk.
Categories:
Investment Grade: Lower default risk, moderate yields.
High Yield (Junk Bonds): Higher default risk, high yields.
2.3 Municipal Bonds
Issued by local governments or municipalities.
Often tax-exempt in certain jurisdictions.
Attractive for investors seeking tax-efficient income.
2.4 Convertible Bonds
Can be converted into equity shares of the issuing company.
Hybrid instrument combining bond-like stability and equity upside.
2.5 Zero-Coupon Bonds
Pay no periodic interest; sold at a discount.
Investor gains from capital appreciation at maturity.
2.6 Inflation-Linked Bonds
Principal and/or interest payments adjust with inflation.
Examples: U.S. TIPS, India’s Inflation Indexed Bonds.
Useful for hedging against inflation risk.
3. Bond Trading Strategies
Trading bonds requires understanding market cycles, interest rate movements, and credit risks. Strategies can be broadly categorized as:
3.1 Buy and Hold Strategy
Objective: Earn coupon income and principal at maturity.
Best For: Conservative investors and retirees.
Pros: Stability, predictable returns.
Cons: Limited capital gains; sensitive to inflation.
3.2 Active Trading Strategies
3.2.1 Interest Rate Anticipation
Goal: Profit from expected changes in interest rates.
Method: Buy long-duration bonds if rates are expected to fall; sell if rates are expected to rise.
Example: U.S. Treasury futures or Indian G-Secs.
3.2.2 Bond Laddering
Goal: Reduce reinvestment risk and smooth cash flows.
Method: Invest in bonds with staggered maturities.
Benefits: Steady income, flexibility to reinvest at different rates.
3.2.3 Barbell Strategy
Goal: Balance risk and return by investing in short- and long-term bonds.
Method: Avoid intermediate-term bonds.
Pros: High liquidity from short-term bonds, high yields from long-term bonds.
Use Case: Uncertain interest rate environment.
3.2.4 Bullet Strategy
Goal: Concentrate maturities around a specific date to fund known obligations.
Method: Buy bonds maturing around the same period.
Best For: Funding a major expense (e.g., pension payouts, debt obligations).
3.2.5 Credit Spread Trading
Goal: Exploit differences in yields between bonds of varying credit quality.
Method: Buy undervalued bonds or short overvalued bonds.
Caution: Requires strong credit analysis skills.
3.2.6 Yield Curve Strategies
Steepener: Buy long-term bonds, sell short-term bonds if yield curve is expected to steepen.
Flattener: Sell long-term bonds, buy short-term bonds if yield curve is expected to flatten.
Objective: Profit from changes in shape of yield curve, not absolute rates.
3.3 Arbitrage Strategies
Convertible Bond Arbitrage: Exploit mispricing between a convertible bond and its underlying equity.
Treasury Arbitrage: Use derivatives or bond futures to profit from small yield differences across maturities or markets.
4. Fixed-Income Derivatives in Bond Trading
Derivatives enhance bond trading flexibility:
4.1 Futures
Standardized contracts to buy/sell bonds at a future date.
Useful for hedging or speculating on interest rates.
4.2 Options
Call Options: Right to buy a bond at a strike price.
Put Options: Right to sell a bond.
Can hedge against price volatility or take directional bets.
4.3 Swaps
Interest Rate Swap: Exchange fixed for floating interest payments.
Credit Default Swap (CDS): Insurance against default risk.
Widely used by institutional traders to manage risk and leverage positions.
5. Risk Management in Fixed-Income Trading
Trading bonds is not risk-free. Key risks include:
5.1 Interest Rate Risk
Bond prices fall when interest rates rise.
Mitigation: Duration management, interest rate derivatives.
5.2 Credit Risk
Risk of issuer default.
Mitigation: Diversification, credit analysis, CDS.
5.3 Reinvestment Risk
Coupons may be reinvested at lower rates.
Mitigation: Laddering strategy.
5.4 Liquidity Risk
Some bonds, especially corporate and municipal, may be illiquid.
Mitigation: Focus on high-volume instruments or use ETFs.
6.5 Inflation Risk
Erodes real returns of fixed-income instruments.
Mitigation: Inflation-linked bonds, shorter maturities.
6. Technical and Fundamental Analysis for Bond Trading
6.1 Fundamental Analysis
Economic indicators: Inflation, GDP growth, employment, central bank policies.
Credit fundamentals: Debt-to-equity ratios, cash flows, corporate earnings.
Central bank actions and fiscal policy directly impact interest rates and yields.
6.2 Technical Analysis
Price patterns, volume trends, and yield charts.
Common tools: Moving averages, trendlines, RSI, support/resistance for bond ETFs and futures.
7. Global and Indian Bond Market Dynamics
7.1 Global Factors
U.S. Treasury yields set benchmark for global rates.
Geopolitical risk, monetary policies, and inflation expectations drive bond flows.
7.2 Indian Bond Market
Key instruments: Government securities (G-Secs), State Development Loans (SDLs), corporate bonds.
RBI’s monetary policy, inflation trends, and credit growth impact yields.
Indian bond market liquidity is improving, but corporate bonds can be thinly traded.
8. Advanced Trading Considerations
8.1 Algorithmic and Quantitative Trading
High-frequency trading in government bonds.
Arbitrage strategies using yield curve mispricings.
8.2 Portfolio Optimization
Combining bonds of different durations and credit qualities.
Risk-adjusted returns measured using metrics like Sharpe ratio.
8.3 Regulatory and Tax Considerations
Compliance with SEBI, RBI, and international regulations.
Tax efficiency plays a role in bond selection (e.g., municipal bonds in the U.S., tax-free bonds in India).
Conclusion
Bond and fixed-income trading requires a balance of knowledge, patience, and strategy. While bonds are traditionally seen as conservative instruments, sophisticated trading strategies—from interest rate anticipation and yield curve trades to credit spread plays—allow traders to capitalize on market inefficiencies. Understanding bond fundamentals, market dynamics, derivatives, and risk management principles is essential to crafting a successful fixed-income portfolio.
Bonds remain an indispensable tool for both income generation and portfolio diversification, bridging the gap between safety and opportunity in the financial markets.
Psychology of Trading in the AI Era1. Evolution of Trading Psychology
Historically, market psychology focused on human behaviors:
Fear and Greed: Primary drivers of market cycles, often triggering panic selling or irrational buying.
Overconfidence: Traders overestimating their predictive abilities.
Herd Behavior: Following the crowd during market rallies or crashes.
Loss Aversion: Greater emotional impact of losses than equivalent gains.
In the AI era, these psychological patterns persist but are influenced by algorithmic behavior. Humans now interact not only with other humans but also with machines that respond instantly to market data, magnifying emotional triggers.
2. AI and Market Dynamics
AI systems, especially those using machine learning and neural networks, introduce new dynamics:
Speed and Precision: AI executes trades in milliseconds, leaving human reaction time irrelevant.
Pattern Recognition: AI identifies opportunities invisible to humans, sometimes creating “ghost signals” that affect human sentiment.
Predictive Models: Some AI predicts market trends based on massive datasets, challenging traders’ intuition.
These changes mean that traders must adapt psychologically. Traditional patience and slow analysis may no longer be sufficient, leading to stress, anxiety, or impulsive decisions.
3. Psychological Challenges in the AI Era
a. Information Overload
AI systems generate enormous amounts of data, including:
Real-time price signals
Sentiment analysis
News-driven indicators
Algorithmic trade flows
Humans struggle to process this volume, causing decision fatigue and analysis paralysis.
b. Trust vs. Skepticism
Traders face a dilemma:
Blind trust in AI can result in over-reliance and ignoring market context.
Excessive skepticism may cause missed opportunities.
Balancing trust in AI tools while maintaining independent judgment is a critical psychological skill.
c. Emotional Detachment
AI trades without emotion. Humans must learn emotional detachment from market noise while avoiding over-mechanical behavior that ignores risk management.
d. Short-Termism and Overtrading
AI accelerates market movement. Humans may feel pressured to match AI speed, leading to impulsive, short-term trades and higher stress levels.
4. Cognitive Biases in the AI Era
Even in AI-driven markets, human biases persist:
Confirmation Bias: Seeking AI outputs that match pre-existing beliefs.
Recency Bias: Overweighting recent AI-predicted trends.
Illusion of Control: Believing one can “beat the AI” consistently.
Anchoring Bias: Fixating on AI’s initial signal and failing to adjust when conditions change.
Recognizing these biases is vital to avoid psychological pitfalls.
5. Human-AI Interaction
Trading psychology now involves symbiosis between humans and AI:
Complementary Roles: Humans provide intuition, context, and risk management; AI offers speed and data processing.
Feedback Loops: Traders can learn from AI behavior, but AI models also react to aggregated human behavior, creating complex dynamics.
Adaptation Stress: Traders must continually adapt to AI updates and changing market algorithms.
6. Strategies for Psychological Resilience
a. Risk Management
Clear rules for position sizing, stop-loss levels, and portfolio diversification reduce emotional stress.
b. Mindfulness and Emotional Control
Practices such as meditation, journaling, and stress monitoring help maintain psychological balance.
c. Education and AI Literacy
Understanding how AI works reduces fear and improves trust. Traders should:
Learn AI signals’ limitations
Avoid over-dependence
Develop critical thinking for algorithmic recommendations
d. Incremental Integration
Gradually incorporating AI into trading routines prevents overwhelm and helps maintain confidence.
7. Case Studies
High-Frequency Trading (HFT) Stress: Traders monitoring HFT systems report extreme pressure to respond to AI-driven market moves, causing burnout.
Algorithmic Signal Misinterpretation: Human traders acting impulsively on AI signals without understanding context often face losses, highlighting the need for psychological discipline.
Successful Human-AI Collaboration: Long-term investors using AI for data analysis while applying human judgment achieve higher consistency and emotional stability.
8. Future Outlook
As AI advances:
Cognitive Skills Will Matter More: Pattern recognition, intuition, and judgment will remain key.
Emotional Intelligence: Traders who manage fear, greed, and stress will outperform purely reactive participants.
Ethical Considerations: AI trading may amplify market manipulation or flash crashes, testing traders’ risk perception and psychological endurance.
The AI era requires a new kind of trading psychology—one that blends human intuition, discipline, and emotional intelligence with machine efficiency.
9. Practical Tips for Traders in the AI Era
Maintain a trading journal to track both AI signals and emotional responses.
Set automated risk parameters to prevent impulsive reactions.
Limit screen time to avoid overstimulation from real-time AI data.
Regularly review AI strategies to understand logic and adjust biases.
Build a supportive network to discuss AI-related trading psychology challenges.
Conclusion
Trading psychology in the AI era is a fusion of old and new challenges. While human emotions, cognitive biases, and behavioral patterns persist, the speed, complexity, and data-driven nature of AI fundamentally alter market dynamics. Traders must adapt by embracing emotional discipline, AI literacy, and strategic integration of human intuition with machine intelligence.
Success in the AI era requires resilience, awareness, and a harmonious human-AI partnership. The psychological battlefield has expanded, but so has the potential for those who master both human mind and machine power.

XAUUSD – Maintaining the Core Uptrend (BUY Bias)
Hello traders,
On the H4 timeframe, gold continues to show a steady upward trend. After testing the upper trendline, price bounced back and is now consolidating around the 386x region. This suggests the market may be in an accumulation phase, awaiting major news.
Fundamental Context
Tomorrow, the market will look towards the release of the Nonfarm Payrolls (NFP) data, an event that often brings strong volatility to gold prices.
In addition, concerns around the potential US Government shutdown are adding to the macro uncertainty, further supporting gold’s safe-haven appeal.
At present, there is little evidence to suggest gold will decline, particularly when other markets are also breaking higher.
Technical Analysis
Price continues to trade within the ascending channel on H4, with buyers holding the advantage.
MACD remains above the zero line, showing no clear signs of weakness.
Price is likely to consolidate further in the 3860 – 3870 range before a sharp move triggered by news.
Trading Plan
Buy Setup (preferred – trend following)
Entry: 3829 – 3832
SL: 3825
TP: 3845 – 3862 – 3877 – 3890
Sell Scalping (counter-trend, higher risk)
Entry: 3927 – 3930
SL: 3934
TP: 3915 – 3900 – 3882 – 3865
Note: Sell setups should be treated only as short-term scalps, as the primary bias remains on the buy side.
Conclusion
Gold is holding firmly within the uptrend structure, with no significant weakness yet. Given the backdrop of political uncertainty and the upcoming NFP release, the priority remains buying at suitable support zones. Any sell trades should be viewed as quick reactions rather than core positions.
👉 Follow me to get the latest updates as soon as price structure changes.

USOIL DOWN TO 60$hello,
I hope you’re doing well. I’ve identified a high-probability short setup on USOIL in the 4H timeframe. The chart is showing a clear downtrend, and based on the current momentum, I expect USOIL to reach the $60 level in the coming days
IBROURI Abdessamad
Will crude drop to $61.70?hello,
according to my analysis on 2h time frame there is high probability that crude oil futures could drop to 61.7 IN FEW HOURS,

Gold Sets Record Close, Will Bulls Push Toward 3900 Next?Gold printed another all time high yesterday and closed with the strongest daily, monthly, and quarterly close on record. As expected with month-end and EOQ flows, we saw a phase of profit booking, but price quickly found support around the psychological 3800 level and Weekly R1 (3806), which is holding as a key demand zone for now. The overall structure remains bullish, and today gold is attempting to break above the previous day high / previous month high. A confirmed H4 close above this level would likely fuel continuation toward the next psychological milestone at 3900. On the downside, a breakdown below 3800 could open room for a corrective move into lower supports. For the near term, the market is trading within a range of 3810–3865/70, and a decisive breakout from this band will likely define the next directional leg.

XAUUSD – US Government Shutdown Pressure on Gold
Hello Traders,
For the first time since 2018, the US Government is facing the risk of a shutdown. This can only be avoided if Congress passes new funding legislation, but the timing remains uncertain. This political backdrop is exerting strong pressure on the financial markets, and gold – the traditional safe haven asset – has become the focal point for investors.
Technical Outlook
Gold continues to set new ATHs right in the Asian session today, indicating the uptrend remains intact.
The upward price channel on H4 maintains a beautiful structure, with the main trend continuing to favour buying.
Yesterday's dip was merely a "liquidity sweep," after which the price quickly returned to its upward momentum.
Short positions can be considered when the price hits strong resistance, combining Fibonacci + Trendline, to optimise winning probabilities.
Trading Scenario
Sell (short-term at resistance):
Entry: 3884 – 3886
SL: 3890
TP: 3872 – 3860 – 3845 – 3830
Buy (aligning with the main trend):
Entry: 3820 – 3823
SL: 3816
TP: 3835 – 3850 – 3862 – 3880
Conclusion
Gold remains strongly supported by the political instability in the US.
The medium-term strategy continues to prioritise Buying at support zones, while Selling should only be considered when there is a clear reaction at resistance zones.
Traders need to closely monitor political news, as any developments related to the US government could alter the short-term structure of gold.
Follow me for the quickest updates on new scenarios as the price path changes.

LiamTrading – Follow the Buy trend, target ATH 3915
The gold market continues to demonstrate the strength of an upward trend. After yesterday's shakeout, we witnessed a very clear Long Squeeze: all buying forces were forced to exit, but immediately after, the price quickly rebounded. This is the hallmark of a strong trend – the more it shakes out, the more momentum it creates for a new peak.
Today's perspective:
Continue to follow Buy, do not SELL against the trend.
The Buy position from 3797 is still being held, if the price returns to retest, we will continue to add orders.
Prioritise observing the POC of the Volume Profile to place Buy orders; if the price adjusts deeper, the VAL area coinciding with the rising trendline will be an extremely safe buying point.
Trading scenario
Buy 3847–3844, SL 3840, TP 3868 – 3880 – 3900 – 3915
Buy 3821–3819, SL 3814, TP 3835 – 3850 – 3868 – open
In summary: The upward trend remains extremely strong, the short-term target is ATH 3915. Stick to the trend, prioritise Buy to maximise profits.
This is my personal view on XAUUSD. Please follow the scenario and stay tuned for my updates.

How to Backtest, Create a Strategy and Execute a Trade In this video I have showed a good trade is executed with proper planning and mindset .
Charts Used in this video are older than 3 months . Only for educational content .

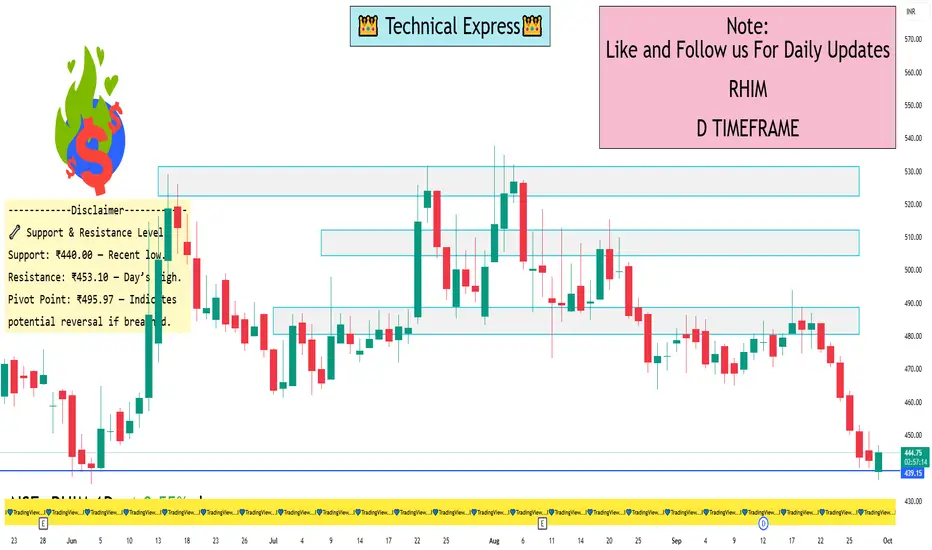
RHIM 1 Day View📊 Technical Overview
Current Price: ₹445.00
Day’s Range: ₹440.00 – ₹453.10
Previous Close: ₹451.45
52-Week Range: ₹376.45 – ₹640.00
🔻 Bearish Indicators
RSI (14): 24.86 — Oversold condition, suggesting potential for a rebound.
MACD: -7.80 — Indicates downward momentum.
Moving Averages:
5-day: ₹444.48 — Slightly above current price.
50-day: ₹469.06 — Bearish crossover.
200-day: ₹478.22 — Further confirmation of downtrend.
Technical Indicators: Strong Sell signals across multiple platforms.
🔧 Support & Resistance Levels
Support: ₹440.00 — Recent low.
Resistance: ₹453.10 — Day’s high.
Pivot Point: ₹495.97 — Indicates potential reversal if breached.
⚠️ Summary
RHI Magnesita India Ltd is currently in a downtrend, with technical indicators signaling a strong sell. The stock is approaching key support levels, and while it is oversold, caution is advised. Traders should monitor for any bullish reversal patterns or volume spikes before considering entry points.
Technical Analysis vs. Option Chain Analysis in Trading1. Introduction to Technical Analysis
Technical Analysis is the study of historical price and volume data to forecast future price movements. Unlike fundamental analysis, which focuses on the intrinsic value of an asset based on financials and macroeconomic indicators, technical analysis relies solely on market data.
Core Principles of Technical Analysis:
Price Discounts Everything:
TA assumes that all known information (fundamental, political, economic) is already reflected in the price. Therefore, price movements are sufficient for forecasting future trends.
Price Moves in Trends:
Markets rarely move randomly. They exhibit trends—uptrend, downtrend, or sideways—which traders identify and trade accordingly.
History Repeats Itself:
Market behavior tends to repeat due to human psychology, making chart patterns, technical indicators, and market cycles predictive.
Key Tools in Technical Analysis:
Charts: Line charts, bar charts, candlestick charts
Indicators: RSI, MACD, Bollinger Bands, moving averages
Patterns: Head & shoulders, double top/bottom, triangles
Volume Analysis: Confirms trends and reversals
Practical Applications:
Identifying entry and exit points
Spotting trends and reversals
Risk management using support, resistance, and stop-loss
Advantages of Technical Analysis:
Works in all market conditions
Can be automated using algorithmic trading
Useful for both short-term and long-term trading
Limitations:
Subjective interpretation of charts
Can give false signals in volatile markets
Does not consider underlying fundamentals
2. Introduction to Option Chain Analysis
Option Chain Analysis involves examining the details of options contracts available for a particular stock or index. An option chain lists all available options (calls and puts) along with their strike prices, premiums, open interest (OI), and volume.
Unlike technical analysis, option chain analysis is specific to derivatives and is used to infer market sentiment and potential price movements.
Core Concepts of Option Chain Analysis:
Calls and Puts:
Call Option: Right to buy at a specific price
Put Option: Right to sell at a specific price
Strike Price: The price at which the underlying asset can be bought or sold.
Open Interest (OI): Number of outstanding contracts. High OI at specific strikes can indicate support or resistance zones.
Volume: Number of contracts traded in a day, indicating trader interest.
Implied Volatility (IV): Market’s forecast of volatility, impacting option premiums.
Key Applications of Option Chain Analysis:
Identifying support and resistance levels using maximum OI strikes
Predicting short-term price movements based on put-call ratios (PCR)
Planning hedging strategies using options
Understanding market sentiment
Advantages:
Provides real-time insight into market sentiment
Useful for short-term trading and intraday strategies
Helps in planning hedging strategies for portfolios
Limitations:
Requires understanding of options pricing
Complex for beginners
Influenced by external factors like volatility and time decay
3. Technical Analysis in Depth
3.1 Price Action
Price action refers to the movement of price over time.
Candlestick patterns (Doji, Hammer, Engulfing) help identify reversals and continuations.
Trendlines and channels assist in visualizing the market direction.
3.2 Indicators and Oscillators
Moving Averages: Smooth out price data; 50-day & 200-day MAs show trend strength.
MACD (Moving Average Convergence Divergence): Shows momentum and trend changes.
RSI (Relative Strength Index): Identifies overbought/oversold conditions.
Bollinger Bands: Measures volatility; price touching bands signals potential reversal.
3.3 Volume Analysis
Volume confirms trend strength.
Rising price with high volume = strong trend; Falling price with high volume = potential reversal.
3.4 Chart Patterns
Reversal Patterns: Head & Shoulders, Double Top/Bottom
Continuation Patterns: Triangles, Flags, Pennants
4. Option Chain Analysis in Depth
4.1 Understanding Option Data
Calls vs Puts: Analyzing the ratio helps gauge bullish or bearish sentiment.
Open Interest (OI): Strikes with high OI act as psychological support/resistance.
Volume: High trading volume at a strike indicates trader focus.
4.2 Put-Call Ratio (PCR)
PCR = Total Put OI / Total Call OI
PCR > 1 indicates bearish sentiment; PCR < 1 indicates bullish sentiment.
4.3 Max Pain Theory
Max Pain = strike where option writers lose the least money
Price tends to gravitate towards max pain level near expiry
4.4 Implied Volatility (IV)
High IV = expensive options, often during high uncertainty
Low IV = cheap options, during stable periods
Helps in timing entry and exit points in options trading
5. Integrating Technical and Option Chain Analysis
Successful traders often combine both approaches:
Confirming Trend with TA and OCA:
Technical indicators may show uptrend.
Option chain OI analysis confirms resistance/support levels, giving high-probability entry points.
Hedging Positions:
Buy stock based on TA trend.
Hedge using options with OCA support.
Intraday Trading:
Use TA for momentum and pattern breakout.
Use OCA for strike-based resistance and price targets.
Volatility Trading:
Use TA to identify consolidation or breakout zones.
Use OCA IV data to choose options strategies (straddle, strangle).
6. Case Study Example
Stock: XYZ Ltd.
TA Observation: 50-day MA trending upward, RSI around 65 → bullish bias
Option Chain Analysis:
Max Call OI at 150 strike → strong resistance
Max Put OI at 140 strike → strong support
PCR = 0.8 → bullish sentiment
Trading Strategy:
Enter long near support (140)
Target price near resistance (150)
Use options to hedge if breakout fails
7. Pros and Cons in Trading Context
7.1 Technical Analysis Pros and Cons
Pros:
Easy to interpret
Widely applicable
Works across timeframes
Cons:
Cannot measure market sentiment directly
False breakouts possible
Subjective
7.2 Option Chain Analysis Pros and Cons
Pros:
Reveals trader sentiment
Helps with hedging
Useful for expiry-week trading
Cons:
Complex interpretation
Affected by volatility and time decay
Requires options knowledge
8. Conclusion
Both Technical Analysis and Option Chain Analysis are indispensable tools for traders. While TA provides a structured approach to reading price trends and patterns, OCA adds depth by revealing market sentiment and strike-based support/resistance. Combining both approaches gives traders a holistic view, enabling better risk management, precise entry/exit points, and a strategic edge in the market.
TA: Broadly applicable, trend and pattern-based, foundational for all traders.
OCA: Derivatives-focused, sentiment-driven, crucial for options and intraday trading.
Combined Approach: Confirms technical signals, improves probability of success, and optimizes risk management.
For modern traders, understanding both TA and OCA is no longer optional—it is essential to navigate volatile markets and enhance decision-making capabilities.

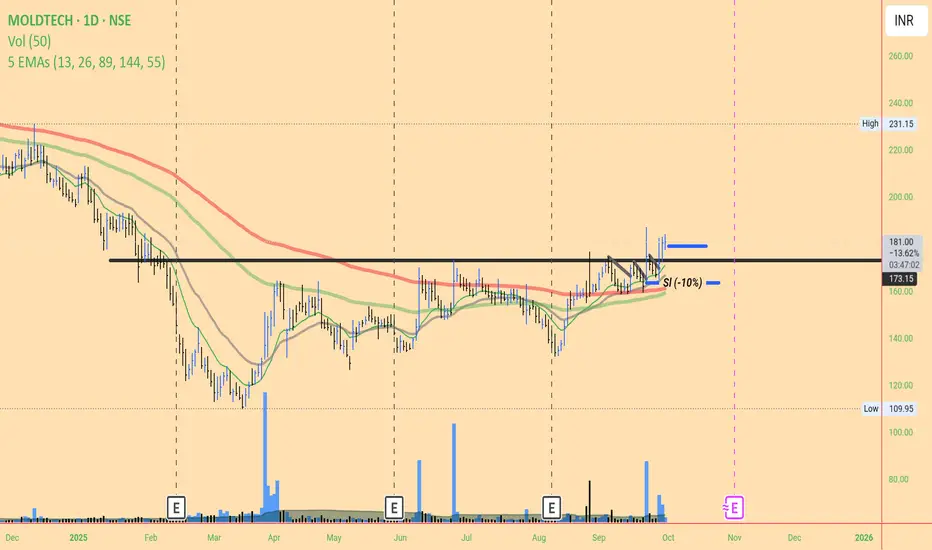
Mold-Tech #technicalanalysis
pattern look like vcp from left to right move price became narrow.
High volume after absorption ,
* Now price break 1st correction candle above trade. Entry point
* Sl -10% , from entry point 179 current price,
Reason below high volume after selling zone absorption area below that.