Part 2 Trading Master Class With ExpertsOptions in Indian Markets
In India, options are traded on NSE and BSE, primarily on:
Index Options: Nifty, Bank Nifty (most liquid).
Stock Options: Reliance, TCS, Infosys, etc.
Weekly Expiry: Every Thursday (Nifty/Bank Nifty).
Lot Sizes: Fixed by exchanges (e.g., Nifty = 50 units).
Practical Example – Nifty Options Trade
Scenario:
Nifty at 20,000.
You expect big movement after RBI policy.
Strategy: Buy straddle (20,000 call + 20,000 put).
Cost = ₹200 (call) + ₹180 (put) = ₹380 × 50 = ₹19,000.
If Nifty moves to 20,800 → Call worth ₹800, Put worthless. Profit = ₹21,000.
If Nifty stays at 20,000 → Both expire worthless. Loss = ₹19,000.
Trading

Part 1 Trading Master Class With ExpertsIntermediate Option Strategies
Straddle – Buy Call + Buy Put (same strike/expiry). Best for high volatility.
Strangle – Buy OTM Call + Buy OTM Put. Cheaper than straddle.
Bull Call Spread – Buy lower strike call + Sell higher strike call.
Bear Put Spread – Buy higher strike put + Sell lower strike put.
Advanced Option Strategies
Iron Condor – Sell OTM call + OTM put, hedge with farther strikes. Good for sideways market.
Butterfly Spread – Combination of multiple calls/puts to profit from low volatility.
Calendar Spread – Buy long-term option, sell short-term option (same strike).
Ratio Spread – Sell multiple options against fewer long options.
Hedging with Options
Options aren’t just for speculation; they’re powerful hedging tools.
Portfolio Hedge: If you own a basket of stocks, buying index puts protects against a market crash.
Currency Hedge: Importers/exporters use currency options to lock exchange rates.
Commodity Hedge: Farmers hedge crops using options to lock minimum prices.

Part 1 Support and ResistanceCall and Put Options in Action
Call Option Example
Reliance is trading at ₹2500.
You buy a 1-month call option with strike price ₹2550, premium ₹50, lot size 505.
If Reliance rises to ₹2700 → Profit = (2700 - 2550 - 50) × 505 = ₹50,500.
If Reliance falls below 2550 → You lose only the premium (₹25,250).
Put Option Example
Nifty is at 20,000.
You buy a 1-month put option, strike 19,800, premium 100, lot size 50.
If Nifty falls to 19,200 → Profit = (19,800 - 19,200 - 100) × 50 = ₹25,000.
If Nifty rises above 19,800 → You lose premium (₹5,000).
Participants in Options Trading
Option Buyer – Pays premium, has limited risk and unlimited profit potential.
Option Seller (Writer) – Receives premium, has limited profit and potentially unlimited risk.
Example:
Buyer of call: Unlimited upside, limited loss (premium).
Seller of call: Limited profit (premium), unlimited loss if stock rises.

PCR Trading StrategyKey Terms in Options Trading
Before diving into strategies, let’s master some core concepts:
Underlying Asset: The stock/index/commodity on which the option is based.
Strike Price: The price at which the option can be exercised.
Expiration Date: The date on which the option contract ends.
Premium: The price paid by the option buyer to the seller (writer) for the contract.
In-the-Money (ITM): Option has intrinsic value (profitable if exercised).
At-the-Money (ATM): Underlying price = Strike price.
Out-of-the-Money (OTM): Option has no intrinsic value yet (not profitable to exercise).
Lot Size: Options are traded in lots (e.g., Nifty option has a fixed lot of 50 units).
Leverage: Options allow control of large positions with smaller capital.
How Options Work
Options are like insurance. Imagine you own a house worth ₹50 lakh and buy insurance. You pay a small premium so that if the house burns down, you can recover your value. Similarly:
A call option is like paying for the right to buy a stock cheaper later.
A put option is like insurance against stock prices falling.

Option Trading 1. Introduction to Options Trading
Options trading is one of the most powerful tools in the financial markets. Unlike traditional stock trading, where you buy or sell shares directly, options allow you to control an asset without owning it outright. This gives traders flexibility, leverage, and a wide range of strategies for both profits and risk management.
At its core, an option is a contract that gives the buyer the right, but not the obligation, to buy or sell an underlying asset at a specific price (called the strike price) on or before a certain date (the expiration date).
The beauty of options lies in choice: you can profit whether markets are rising, falling, or even staying flat—if you know how to use them.
2. What is an Option?
An option is a derivative instrument, meaning its value is derived from the price of another asset (the “underlying”), such as:
Stocks (e.g., Reliance, Apple)
Indexes (e.g., Nifty, S&P 500)
Commodities (e.g., Gold, Oil)
Currencies
Two Main Types of Options:
Call Option – Gives the right to buy the underlying asset.
Put Option – Gives the right to sell the underlying asset.
Example:
A call option on Reliance with a strike price of ₹2500 expiring in one month gives you the right (not the obligation) to buy Reliance shares at ₹2500, regardless of the market price.
A put option with a strike of ₹2500 gives you the right to sell at ₹2500.

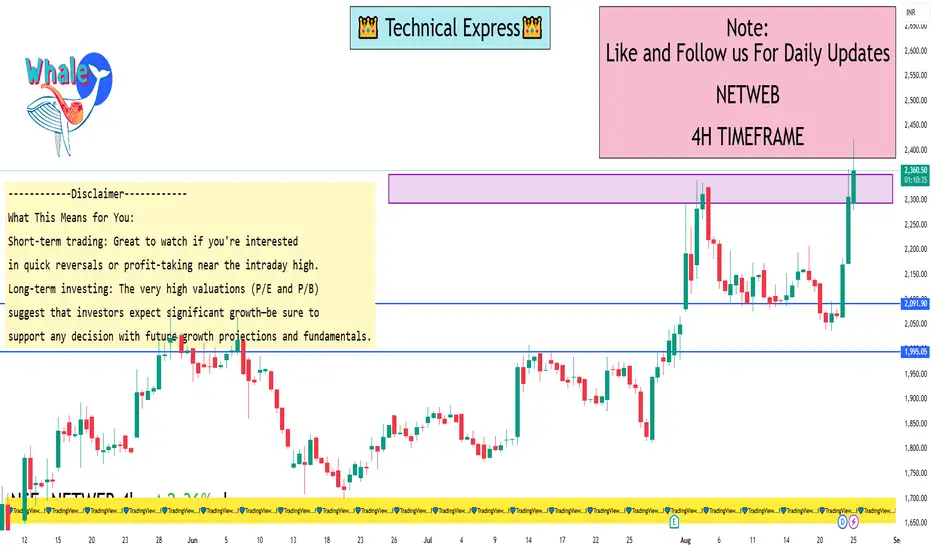
NETWEB Tech India 1 Day ViewIntraday Snapshot as of August 25, 2025:
Current Price: ₹2,353.00
Previous Close: ₹2,322.40
Day’s Range: ₹2,280.60 to ₹2,423.90
Key Refreshers on Today’s Movement:
The stock is trading slightly higher than yesterday’s closing price, signaling a modest intraday gain.
The intra-day high of ₹2,423.90 indicates a strong session, though it hasn't crossed the 52-week high of ₹3,060.
Additional Key Metrics (As of August 25, 2025):
P/E (TTM): ~114.94
P/B Ratio: ~24.8
Indicative of a richly valued stock—priced at a premium compared to industry averages.
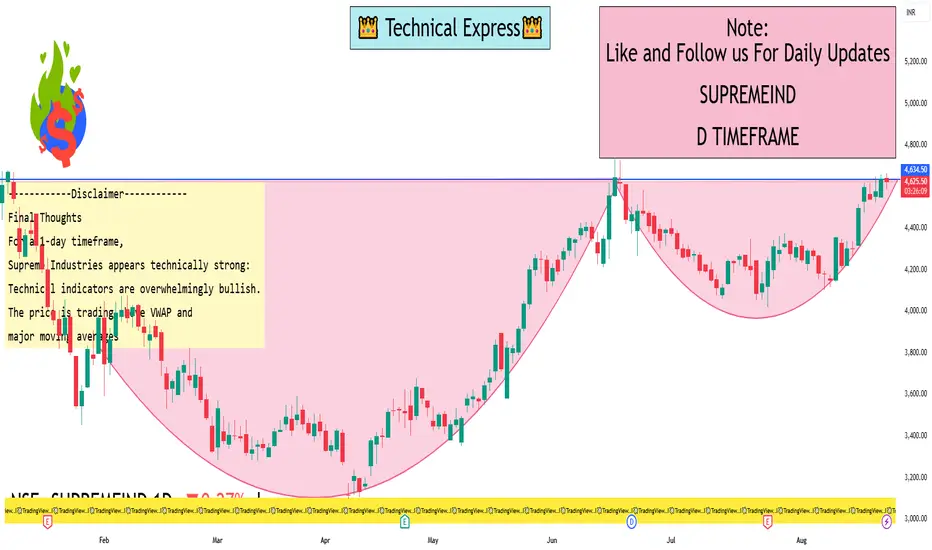
Supreme Industries 1 Day View1-Day Technical Overview
Consensus Ratings
TradingView signals a Buy rating for today, with a Strong Buy for the 1-week timeframe
Investing.com offers a robust Strong Buy across multiple timeframes (30 min, hourly, daily, weekly, and monthly)
Similarly, another Investing.com source reiterates: Strong Buy on both moving averages (12:0 buy:sell) and technical indicators (9:0)
Indicator Highlights (as of Aug 25, 2025)
RSI (14): 68.5 — indicates bullish momentum, nearing overbought territory
MACD, ADX, CCI, ROC, Ultimate Oscillator, Bull/Bear Power: All show Buy signals. Williams %R and StochRSI suggest Overbought
Moving Averages (Simple & Exponential): All tracked periods (5, 10, 20, 50, 100, 200) yield Buy signals
1-Day Price & Market Context
Latest stock price sits around ₹4,652–4,664, with intraday highs near ₹4,664.90 and lows round ₹4,586
VWAP (intraday volume-weighted average price) stands at approximately ₹4,634–4,636, suggesting current trading is slightly above average price levels
Options Trading Strategies1. Introduction to Options Trading
Options are one of the most versatile financial instruments available in the stock market. Unlike straightforward stock trading, where you buy or sell shares, options give you the right but not the obligation to buy or sell an underlying asset at a pre-determined price within a specific time.
Because of their flexibility, options allow traders to:
Hedge against risk,
Generate income,
Speculate on market direction, or
Even profit from volatility itself.
Options trading strategies are structured combinations of options (calls, puts, or both) that help traders tailor risk and reward according to their outlook. Understanding these strategies is essential because options are a double-edged sword: they can multiply profits but also magnify risks if used incorrectly.
2. Basics of Options
Before diving into strategies, let’s recap the key concepts:
Call Option → Right to buy the asset at a certain price. (Bullish in nature)
Put Option → Right to sell the asset at a certain price. (Bearish in nature)
Strike Price → Pre-decided price at which the option can be exercised.
Premium → Cost of buying the option.
Expiry → The date on which the option contract ends.
In the Money (ITM) → Option has intrinsic value.
Out of the Money (OTM) → Option has no intrinsic value, only time value.
Understanding these basics is critical because all option strategies are built using calls and puts in different combinations.
3. Why Use Option Strategies?
Traders and investors don’t just buy calls and puts randomly. Instead, they use structured strategies to achieve specific goals:
Hedging: Protecting a stock portfolio against downside risk.
Income Generation: Earning premium by selling options.
Speculation: Taking directional bets with limited risk.
Volatility Trading: Profiting from changes in implied volatility regardless of direction.
4. Categories of Option Strategies
Option strategies can be grouped into four main categories:
Bullish Strategies → Profit when the market rises (e.g., Bull Call Spread, Covered Call).
Bearish Strategies → Profit when the market falls (e.g., Bear Put Spread, Protective Put).
Neutral Strategies → Profit when the market stays in a range (e.g., Iron Condor, Butterfly).
Volatility Strategies → Profit from volatility expansion/contraction (e.g., Straddle, Strangle).
5. Popular Options Trading Strategies
Let’s dive into some of the most commonly used strategies with examples, payoff logic, pros, and cons.
5.1 Covered Call (Income Strategy)
How it works: Hold the stock + sell a call option.
Example: Own 100 shares of Reliance at ₹2,500. Sell a call with strike ₹2,600 for ₹30 premium.
Payoff:
If Reliance stays below ₹2,600 → keep shares + earn ₹30 premium.
If Reliance rises above ₹2,600 → shares are sold at ₹2,600 but you still keep the premium.
Pros: Steady income, reduces cost of holding.
Cons: Caps upside potential.
5.2 Protective Put (Insurance Strategy)
How it works: Hold stock + buy a put option.
Example: Buy Infosys at ₹1,400. Buy a put with strike ₹1,350 at ₹20 premium.
Payoff:
If stock rises → unlimited upside, only premium lost.
If stock falls → downside limited at strike price.
Pros: Protects against big losses.
Cons: Premium cost reduces profit.
5.3 Bull Call Spread (Moderately Bullish)
How it works: Buy a lower strike call + Sell a higher strike call.
Example: Buy Nifty 19,800 Call at ₹200, Sell 20,200 Call at ₹80. Net cost = ₹120.
Payoff:
Max profit = Difference in strikes – net premium = ₹400 – ₹120 = ₹280.
Max loss = ₹120 (premium paid).
Pros: Limited risk, limited reward.
Cons: Capped profit even if market rallies big.
5.4 Bear Put Spread (Moderately Bearish)
How it works: Buy a higher strike put + sell a lower strike put.
Example: Buy 19,800 Put at ₹220, Sell 19,400 Put at ₹100. Net cost = ₹120.
Payoff:
Max profit = Difference in strikes – net premium = ₹400 – ₹120 = ₹280.
Max loss = ₹120 (premium).
Pros: Controlled bearish play.
Cons: Capped profit.
5.5 Straddle (Volatility Play)
How it works: Buy 1 Call + 1 Put of the same strike.
Example: Nifty at 20,000 → Buy 20,000 Call (₹200) + Buy 20,000 Put (₹180). Total = ₹380.
Payoff:
If Nifty moves sharply either side (>₹380), profit.
If Nifty stays near 20,000, loss of premium.
Pros: Profits from big moves.
Cons: Expensive, time decay hurts if market is flat.
5.6 Strangle (Cheaper Volatility Play)
How it works: Buy OTM Call + OTM Put.
Example: Buy 20,200 Call (₹120) + Buy 19,800 Put (₹100). Cost = ₹220.
Payoff: Needs larger move than straddle, but cheaper.
Pros: Lower cost.
Cons: Requires significant market move.
5.7 Iron Condor (Range-Bound Strategy)
How it works: Combine a Bull Put Spread + Bear Call Spread.
Example:
Sell 19,800 Put, Buy 19,600 Put.
Sell 20,200 Call, Buy 20,400 Call.
Payoff: Profit if Nifty stays between 19,800–20,200.
Pros: Income from stable markets.
Cons: Risk if market breaks range.
5.8 Butterfly Spread (Range-Bound, Low Risk)
How it works: Buy 1 ITM Call, Sell 2 ATM Calls, Buy 1 OTM Call.
Example:
Buy 19,800 Call, Sell 2×20,000 Calls, Buy 20,200 Call.
Payoff: Max profit if expiry near middle strike (20,000).
Pros: Low risk, good for low-volatility outlook.
Cons: Limited reward, needs precise prediction.
5.9 Collar Strategy (Hedged Investment)
How it works: Own stock + Buy Put + Sell Call.
Purpose: Locks range of returns.
Example: Own stock at ₹1,000. Buy 950 Put, Sell 1,050 Call.
Pros: Protects downside at low cost.
Cons: Caps upside.
5.10 Calendar Spread (Time-based Play)
How it works: Sell near-term option + Buy long-term option of same strike.
Profit: From time decay of short option while holding longer-term exposure.
Best used: In low-volatility environments.
6. Risk-Reward Analysis
Limited Risk Strategies: Spreads, Condors, Butterflies.
Unlimited Profit Potential: Long Calls, Long Puts, Straddles.
Income-Oriented: Covered Calls, Iron Condor, Credit Spreads.
Hedging-Oriented: Protective Puts, Collars.
7. How to Choose the Right Strategy
Factors to consider:
Market View (Bullish, Bearish, Neutral).
Volatility Outlook (High, Low, Expected to rise/fall).
Risk Appetite (Aggressive vs Conservative).
Capital Availability (Some require margin).
8. Common Mistakes in Option Strategies
Over-leveraging (buying too many contracts).
Ignoring time decay (theta).
Trading only naked options without strategy.
Not adjusting positions when market moves.
Misjudging volatility.
9. Advanced Insights
Option Greeks: Delta, Gamma, Theta, Vega, Rho – help measure sensitivity to price, time, and volatility.
Implied Volatility (IV): Crucial in pricing; high IV inflates premiums, low IV reduces them.
Adjustments: Rolling options, converting spreads to condors, hedging with futures.
10. Conclusion
Options trading strategies are powerful tools. They allow traders to make money in bullish, bearish, sideways, or volatile markets – but only if used with discipline. A successful trader doesn’t just guess direction; they analyze market conditions, volatility, risk tolerance, and then select the appropriate strategy.
The beauty of options lies in flexibility: you can limit risk, enhance returns, or even profit from time and volatility itself. But the danger lies in misuse – options should be treated as structured financial instruments, not lottery tickets.

How to Read Price ActionIntroduction
Price Action (PA) is the art and science of reading market movement directly from price charts, without over-reliance on lagging indicators. Professional traders, institutional players, and prop firms often emphasize price action because it reflects the pure psychology of buyers and sellers.
Unlike trading based on technical indicators, price action trading relies on raw market data: candlesticks, support & resistance levels, chart structures, and volume context.
Learning to read price action is like learning a new language — once you master it, you can understand what the market is saying at any given moment.
Chapter 1: What is Price Action?
Price Action refers to analyzing the actual price movement of a financial instrument over time.
It does not depend on moving averages, oscillators, or complex indicators.
It studies patterns, trends, support/resistance zones, candlestick formations, and order flow behavior.
The ultimate goal is to understand the story behind each price move: who is in control (buyers or sellers), and where the next move might head.
Key Idea: Price action is the footprint of money. When large institutions buy or sell, they leave traces on the chart — PA traders learn to read these footprints.
Chapter 2: Why Read Price Action?
Clarity – It removes clutter from charts.
Universal Language – Works across all markets (stocks, forex, commodities, crypto).
Flexibility – Adapts to all timeframes, from scalping 1-min charts to investing on weekly charts.
Real-Time Decisions – Price action reacts instantly, unlike lagging indicators.
Psychology-Based – Helps traders understand market sentiment: fear, greed, indecision.
Chapter 3: Core Building Blocks of Price Action
Before diving into strategies, you need to master the foundations:
3.1 Candlesticks
Candlesticks are the backbone of price action. Each candle tells a story:
Open, High, Low, Close (OHLC) show how price moved within that time frame.
Long wicks = rejection.
Long body = strong momentum.
Small body = indecision.
3.2 Market Structure
Higher Highs & Higher Lows (HH, HL) = Uptrend.
Lower Highs & Lower Lows (LH, LL) = Downtrend.
Sideways movement = Consolidation.
3.3 Support and Resistance (S/R)
Support: A price level where buying pressure often appears.
Resistance: A price level where selling pressure often emerges.
These zones are not exact prices, but areas.
3.4 Trendlines & Channels
Connecting swing highs/lows creates visual guides.
Channels highlight when price is moving within a range.
3.5 Volume (Optional but Powerful)
Volume confirms price moves — high volume validates breakouts, while low volume signals weak trends.
Chapter 4: Candlestick Price Action Patterns
4.1 Reversal Patterns
Pin Bar (Hammer, Shooting Star): Signals rejection at support/resistance.
Engulfing Candle: Strong shift in momentum (bullish or bearish).
Morning Star / Evening Star: Trend reversal confirmation.
4.2 Continuation Patterns
Inside Bar: Market is pausing; breakout is likely.
Flag & Pennant: Small correction before continuation.
Marubozu: Strong conviction candle.
4.3 Indecision Patterns
Doji: Balance between buyers and sellers.
Spinning Top: Low conviction, sideways market.
Lesson: Candlestick patterns only matter in the right context (support, resistance, trend zones).
Chapter 5: Understanding Market Phases
Price moves in cycles:
Accumulation Phase: Smart money buys quietly, market moves sideways.
Markup Phase: Strong uptrend begins (higher highs & higher lows).
Distribution Phase: Smart money sells to late buyers, price moves sideways again.
Markdown Phase: Downtrend begins (lower highs & lower lows).
Price action traders learn to spot transitions between phases.
Chapter 6: Reading Trends
Uptrend: Look for buying opportunities on pullbacks.
Downtrend: Look for selling opportunities on retracements.
Range-bound: Focus on support/resistance rejections.
Golden Rule: Trade with the trend until price clearly shows reversal signs.
Chapter 7: Breakouts & Fakeouts
Breakout: Price moves beyond key support/resistance with momentum.
Fakeout (False Break): Price breaks a level but quickly reverses.
Pro Tip: Watch volume + candle close for real confirmation.
Chapter 8: Price Action Trading Strategies
Here are practical strategies traders use:
8.1 Breakout Trading
Identify consolidation → Wait for breakout → Enter with momentum.
Example: Range breakout, Triangle breakout.
8.2 Pullback Trading
Enter in the direction of trend after a retracement.
Example: Price bounces off support in uptrend.
8.3 Reversal Trading
Spot exhaustion patterns (Pin Bars, Engulfing) near major S/R zones.
Requires patience and confirmation.
8.4 Supply and Demand Zones
Supply = institutional sell zones.
Demand = institutional buy zones.
Price often reacts strongly when revisiting these levels.
Chapter 9: The Psychology Behind Price Action
Every candle reflects human psychology:
Long bullish candle: Strong buyer confidence.
Long bearish candle: Panic selling or strong bearish conviction.
Doji: Confusion / indecision.
Breakouts: Fear of missing out (FOMO) + herd mentality.
Price action is a visual representation of trader emotions.
Chapter 10: Common Mistakes in Reading Price Action
Overcomplicating the chart – Too many lines, patterns, or zones.
Ignoring market context – A bullish candle in a downtrend is weak.
Chasing trades – Entering late after breakout.
Forcing patterns – Seeing patterns that don’t exist.
Neglecting risk management – PA gives entries, but stops are crucial.
Conclusion
Reading price action is not about memorizing patterns, but understanding the story behind the charts. It’s about seeing the battle between buyers and sellers and aligning with the winning side.
Once you master candlesticks, support/resistance, trends, and psychology, price action becomes a powerful weapon that can work in any market, on any timeframe.
The path is long, but with discipline, patience, and practice, you can become fluent in the language of price action.
Gold Surges After Fed Remarks: Next Target at $3,370Hello everyone, following Jerome Powell’s speech at the Jackson Hole symposium yesterday, the gold market experienced a sharp rally. Powell hinted at potential rate cuts, weakening the USD and opening a strong opportunity for gold. Currently, gold is trading around $3,345, and if it breaks through the Fair Value Gap between $3,340 – $3,350, the bullish trend will be confirmed, with the next target at $3,370.
Rising trading volumes in recent candles indicate buyers are in control. Meanwhile, Ichimoku cloud signals still confirm an upward momentum as gold prices remain above the cloud, reflecting sustained bullish strength.
With both Fed policy signals and strong technical indicators, gold is likely to extend its rally in the near term. If the price holds above $3,350, reaching $3,370 is just a matter of time.
What’s your view on the current gold trend? Share your thoughts below.

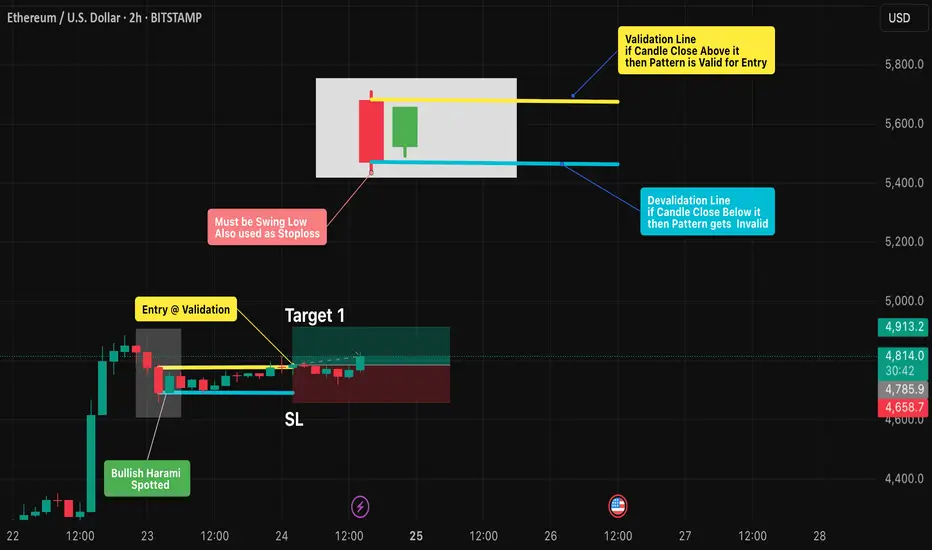
Bullish Harami Pattern: Spotting Reversals with DisciplineIntro / Overview
The Bullish Harami is a candlestick reversal pattern that often forms at the end of a downtrend.
It signals a possible shift where sellers weaken and buyers begin to step in.
The first candle’s low must be a swing low , and this level can also be used as a stop-loss reference.
To trade it effectively, spotting the formation is not enough — strict validation and invalidation rules are key to avoid false signals.
✨ Concept
A Bullish Harami is a two-candle pattern:
- First candle (Red🔴): A strong bearish candle showing seller dominance (swing low).
- Second candle (Green🟢): A smaller bullish candle whose body is fully inside the prior red candle’s body (wicks ideally inside).
This forms the “harami” structure, where the green candle looks like it is “inside the red candle,” suggesting a pause in bearish pressure and potential reversal.
📖 How to Use
1️⃣ Identify the pattern: Look for a large red candle followed by a smaller green candle contained within it.
2️⃣ Validation Point: The setup is validated if price closes above the open of the red candle within the next few candles.
3️⃣ Invalidation Point: The setup is invalidated if price closes below the close of the red candle before validation occurs.
4️⃣ Stop-Loss & Targets:
- Stop-loss (SL): Place at or just below the swing low (first red candle low).
- Target (TP): 1x, 2x, or more times the distance between entry and stop-loss.
5️⃣ Enhance Reliability: Combine with support levels, trendlines, moving averages, or other candlestick signals to filter out weak setups.
📊 Chart Explanation – Step by Step
✔ The Bullish Harami pattern was spotted after a clear downtrend.
✔ The following candle closed above the red candle’s open → Validation confirmed ✅ .
✔ A long entry was taken on the same candle.
✔ The Bullish Harami pattern has also been drawn and highlighted on the chart.
🔍 Observation
- If Target 1 is achieved → book 2 lots , and trail the remaining position with a stop-loss.
- Harami is only a potential reversal → confirmation is necessary.
- Breakout above the red candle’s open = buyers in control 🟢.
- Breakdown below the red candle’s close = setup failure ❌.
- Patience is key — wait for confirmation before entering.
📌 Why It Matters?
The Bullish Harami helps traders by:
- Reducing false reversal trades with strict rules.
- Providing clear entry/exit levels with discipline.
- Enforcing risk management via pre-defined SL & TP.
✅ Conclusion
The Bullish Harami becomes powerful when traded with discipline.
By marking the open and close of the red candle, traders can clearly separate a valid long trade from a failed setup.
With a stop-loss at the swing low and take-profits at 1x, 2x, or more, while trailing further lots, the Harami offers a structured, rule-based strategy.
⚠️ Always remember: the pattern shows possibility → price confirmation makes it probability .
⚠️ Disclaimer
For educational purposes only · Not SEBI registered · Not a buy/sell recommendation · No investment advice — purely a learning resource
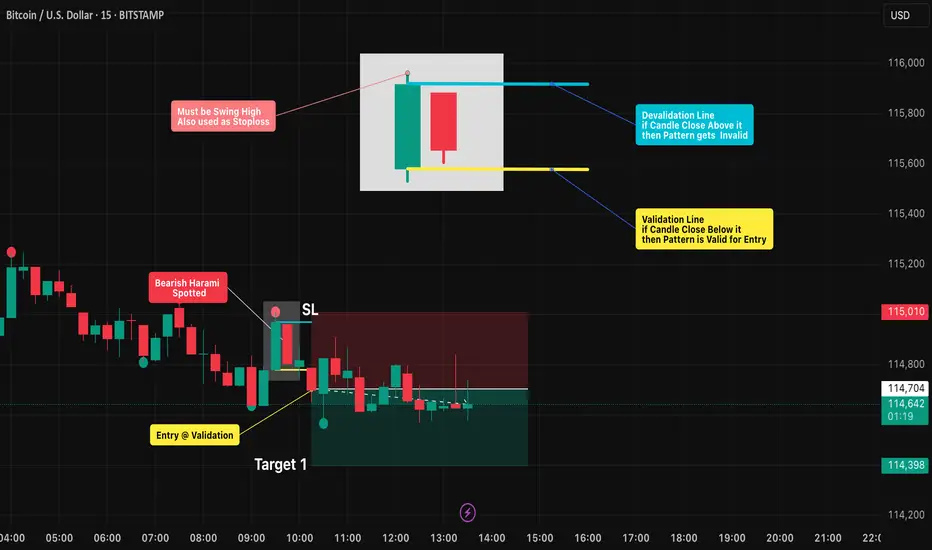
Bearish Harami Pattern: Spotting Reversals with Discipline🔻Bearish Harami Pattern: Spotting Reversals with Discipline
Intro / Overview
The Bearish Harami is a candlestick reversal pattern that often appears at the end of an uptrend.
It signals a possible shift where bullish momentum weakens and sellers begin to step in.
The first candle’s high must be a swing high , and this level can also be used as a stop-loss reference.
To trade it effectively, spotting the formation is not enough — strict validation and invalidation rules are key to avoid false signals.
✨ Concept
A Bearish Harami is a two-candle pattern:
- First candle (Green🟢): A strong bullish candle showing buyer dominance.(Swing high)
- Second candle (Red🔴): A smaller bearish candle whose body is fully inside the prior green candle’s body (wicks ideally inside).
This forms the “harami” structure, where the red candle looks like it is “inside the green candle,” suggesting a pause in bullish pressure and potential reversal.
📖 How to Use
1️⃣ Identify the pattern: Look for a large green candle followed by a smaller red candle contained within it.
2️⃣ Validation Point: The setup is validated if price closes below the open of the green candle within the next few candles.
3️⃣ Invalidation Point: The setup is invalidated if price closes above the close of the green candle before validation occurs.
4️⃣ Stop-Loss & Targets:
- Stop-loss (SL): Place at or just above the swing high (first green candle high).
- Target (TP): 1x, 2x, or more times the distance between entry and stoploss.
5️⃣ Enhance Reliability: Combine with resistance levels, trendlines, moving averages, or other candlestick signals to filter out weak setups.
📊 Chart Explanation – Step by Step
✔ The Bearish Harami pattern was spotted after a clear uptrend.
✔ The following candle closed below the green candle’s open → Validation confirmed ✅.
✔ A short entry was taken on the same candle.
✔ A Bearish Harami pattern has also been drawn and highlighted on the chart.
🔍 Observation
- If Target 1 is achieved → book 2 lots , and trail the remaining position with a stop-loss.
- Harami is only a potential reversal → confirmation is necessary.
- Breakdown below the green candle’s open = sellers in control 🔻.
- Breakout above the green candle’s close = setup failure ❌.
- Patience is key — wait for confirmation before entering.
📌 Why It Matters?
The Bearish Harami helps traders by:
- Reducing false reversal trades with strict rules.
- Providing clear entry/exit levels with discipline.
- Enforcing risk management via pre-defined SL & TP.
✅ Conclusion
The Bearish Harami becomes powerful when traded with discipline.
By marking the open and close of the green candle, traders can clearly separate a valid short trade from a failed setup.
With a stop-loss at the swing high and take-profits at 1x, 2x, or more, while trailing further lots, the Harami offers a structured, rule-based strategy.
⚠️ Always remember: the pattern shows possibility → price confirmation makes it probability .
⚠️ Disclaimer
For educational purposes only · Not SEBI registered · Not a buy/sell recommendation · No investment advice — purely a learning resource
Trading Master Class With ExpertsTips for Beginners in Options Trading
Start with buying calls/puts before selling.
Trade liquid instruments like Nifty/Bank Nifty.
Learn Greeks slowly, don’t jump into complex strategies.
Avoid naked option selling without hedging.
Paper trade before risking real capital.
Role of Volatility in Options
Volatility is the lifeblood of options.
High Volatility = Expensive Premiums.
Low Volatility = Cheap Premiums.
Traders often use Implied Volatility (IV) to decide whether to buy (when IV is low) or sell (when IV is high).
Mastering Options
Options are like a Swiss Army Knife of trading—one tool with multiple uses: speculation, hedging, and income generation. But with great power comes great responsibility.
To succeed in options trading:
Understand the basics thoroughly.
Start small and simple.
Master risk management.
Use strategies suited to your market outlook.
Keep emotions under control.
With practice and discipline, options can become a game-changer in your trading journey.

Part 1 Ride The Big Moves Call and Put Options in Action
Call Option Example
Reliance is trading at ₹2500.
You buy a 1-month call option with strike price ₹2550, premium ₹50, lot size 505.
If Reliance rises to ₹2700 → Profit = (2700 - 2550 - 50) × 505 = ₹50,500.
If Reliance falls below 2550 → You lose only the premium (₹25,250).
Put Option Example
Nifty is at 20,000.
You buy a 1-month put option, strike 19,800, premium 100, lot size 50.
If Nifty falls to 19,200 → Profit = (19,800 - 19,200 - 100) × 50 = ₹25,000.
If Nifty rises above 19,800 → You lose premium (₹5,000).
Participants in Options Trading
Option Buyer – Pays premium, has limited risk and unlimited profit potential.
Option Seller (Writer) – Receives premium, has limited profit and potentially unlimited risk.
Example:
Buyer of call: Unlimited upside, limited loss (premium).
Seller of call: Limited profit (premium), unlimited loss if stock rises.

Bitcoin – Medium-Term OutlookBitcoin – Medium-Term Outlook
Hello traders,
BTC recently made a strong breakout move, reacting precisely at the 117k level as expected. Currently, price is in a corrective phase, clearing the liquidity from last Friday’s bullish candle. The sharp rejection at 117k suggests we need to reassess the medium-term outlook.
The primary scenario remains bullish. The 113.4k zone is a key area to look for long entries, as buyers dominated this level earlier and liquidity from short traders still sits here. From a psychological perspective, we could see shorts exiting the market, fuelling a rally towards 115.7k. A confirmed break above 117k would strengthen the long-term bullish trend, opening the door for further long opportunities.
On the flip side, a reaction lower from 115.7k could present a short entry for the medium term. If support at 111.7k breaks, BTC may extend down to 110k, where strong historical rejections suggest a solid zone for fresh long positions in both medium and long-term outlooks.
This outlook is based on key support/resistance levels and major liquidity zones. Always trade with discipline and manage risk carefully to protect your account.
What’s your view on BTC here? Share your thoughts in the comments so we can trade smarter together.

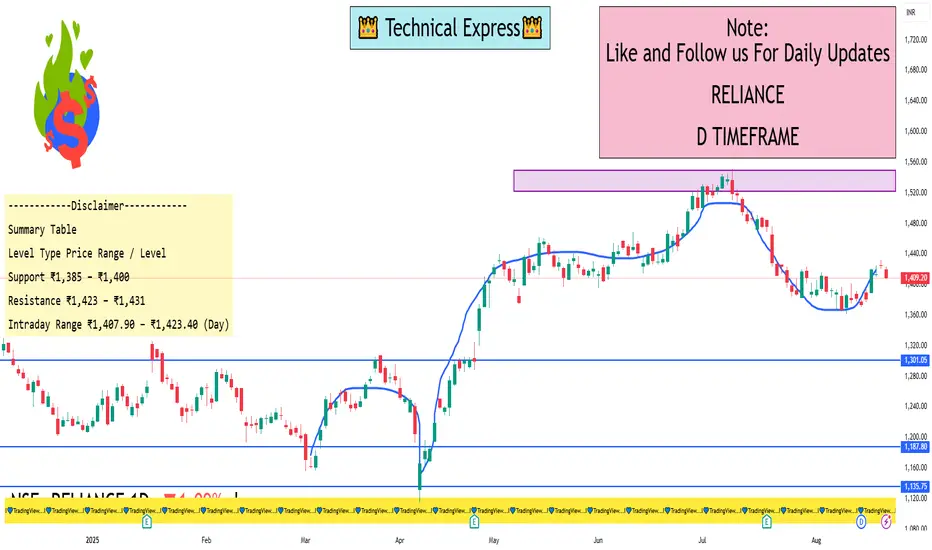
Reliance 1 Day View Key Levels (1-Day Time Frame)
Based on data from Investing.com and Moneycontrol:
Day’s Range: ₹1,407.90 – ₹1,423.40
Recent Daily High (Aug 21): ₹1,431.90
Recent Daily Low (Aug 11): ₹1,361.20
From chart commentary (TradingView):
Support Zone: ₹1,385–1,400
Resistance Level: Around ₹1,423–1,431
Interpretation & Notes
Intraday activity shows movement between roughly ₹1,408 to ₹1,423.
A daily low near ₹1,408 may serve as short-term support; breaking below could test the ₹1,385–1,400 zone.
On the upside, a close above ₹1,423–1,431 might open potential to push higher.
Remember: technical levels provide guidance, not guarantees—market dynamics and fundamentals can shift price action quickly. Always cross-check with live charts and broader analysis.
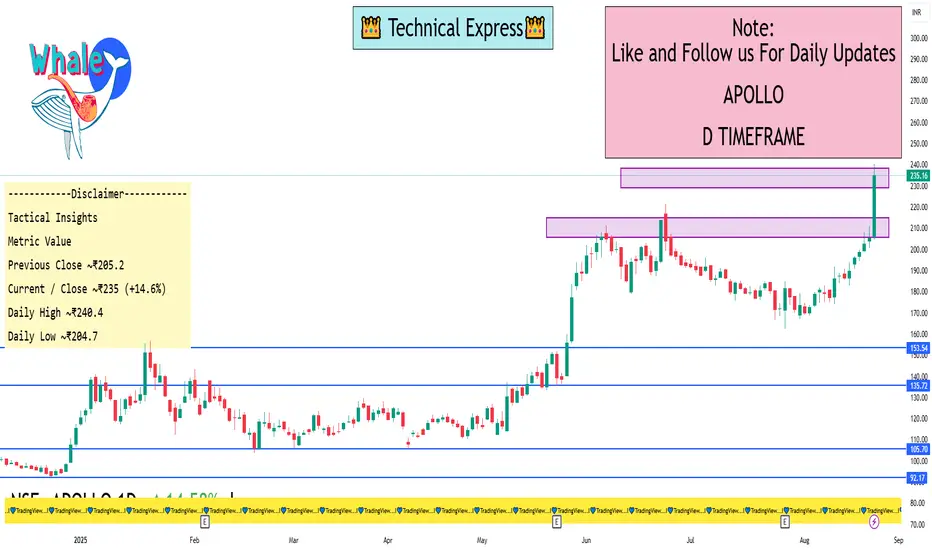
APOLLO 1 Day ViewRecent Catalysts
Apollo Micro Systems saw a significant price spike recently, following an announcement of securing defense contracts worth ₹25.12 crore from DRDO and other public sector undertakings. This triggered a ~15.4% jump in share price and contributed to the new high.
Based on the most recent data:
The current/closing price was around ₹235, up 14.6%, setting a 52-week high of ₹240.40 on August 22, 2025.
Daily high: approximately ₹240.4
Daily low: around ₹204.7
VWAP (Volume-Weighted Average Price): ₹231.79
Volume traded: reported as 88,960,249 shares
Summary Table
Metric Value
Previous Close ~₹205.2
Current / Close ~₹235 (+14.6%)
Daily High ~₹240.4
Daily Low ~₹204.7
VWAP ₹231.79
Volume ~88.96 million shares
Important Trigger Defense order win announcement
Trading Plan & JournalingIntroduction
The financial markets are often described as a battlefield where only the disciplined survive. Traders from all walks of life enter this arena, each armed with different strategies, mindsets, and risk appetites. However, history shows that the majority of traders lose money in the long run—not because the markets are unbeatable, but because they lack structure and discipline.
Two of the most powerful tools for achieving consistency and long-term profitability are:
A Trading Plan – the strategic blueprint that guides every action in the market.
A Trading Journal – the mirror that reflects one’s behavior, decisions, and growth as a trader.
Together, they form the foundation of professional trading. Without them, traders are prone to emotional decision-making, impulsive trades, and recurring mistakes.
This guide will deeply explore both concepts in detail, breaking them into digestible parts, supported by examples, techniques, and psychological insights.
Part I – The Trading Plan
1. What is a Trading Plan?
A trading plan is a written, structured framework that outlines how a trader will approach the market. It defines entry and exit strategies, risk management rules, trading goals, and performance evaluation metrics.
Think of it as the business plan of a trader. Just like a company can’t run without a business plan, a trader cannot succeed long term without a trading plan.
2. Why Do You Need a Trading Plan?
Eliminates guesswork – prevents random or impulsive trades.
Brings consistency – ensures that you execute your strategy the same way every time.
Controls emotions – reduces the impact of fear and greed.
Improves risk management – avoids catastrophic losses.
Helps evaluation – allows you to track results and refine your strategy.
Without a trading plan, traders end up chasing tips, rumors, and news blindly—leading to inconsistent results.
3. Components of a Trading Plan
A solid trading plan should cover the following areas:
A. Personal Assessment
Before crafting strategies, a trader must understand themselves.
Risk tolerance – how much can you afford to lose per trade?
Time availability – are you a full-time day trader, part-time swing trader, or long-term investor?
Psychological strengths and weaknesses – are you patient, disciplined, or easily distracted?
B. Market Selection
Define which markets and instruments you will trade:
Equities (large-cap, mid-cap, small-cap)
Forex
Commodities
Indices
Options & derivatives
Focusing on a limited set of instruments helps you specialize rather than becoming a jack of all trades.
C. Trading Strategy
This section answers the “How” of trading.
Technical approach (candlestick patterns, moving averages, volume profile, market structure).
Fundamental analysis (earnings reports, macroeconomic data).
Hybrid approach (combining both).
Each setup should be clearly defined:
Conditions for entry.
Stop-loss placement.
Profit targets or trailing stops.
Position-sizing rules.
D. Risk & Money Management
The most crucial element. Decide:
Maximum risk per trade (commonly 1–2% of account size).
Maximum daily/weekly drawdown before stopping.
Position sizing formula (e.g., fixed percentage, volatility-based sizing).
Risk-reward ratio (minimum 1:2 or better).
E. Trade Management
Scaling in and out of trades.
Adjusting stop-loss as price moves in your favor.
Handling trades that gap overnight.
F. Trading Schedule
Decide when you’ll trade:
Day trading → during market hours.
Swing trading → end-of-day analysis.
Long-term investing → weekly/monthly review.
G. Performance Evaluation
Set measurable goals:
Win rate (%)
Average profit per trade
Risk-reward ratio
Monthly return target
Maximum acceptable drawdown
4. Example of a Simple Trading Plan
Trader Type: Swing trader
Market: Nifty 50 stocks
Strategy: Trade only bullish engulfing & hammer candlestick patterns near support zones.
Entry Rule: Buy at confirmation candle with above-average volume.
Stop-loss: Below support or candle low.
Target: 2x risk.
Risk Management: 1% per trade, max 3 trades per day.
Review: Weekly journal analysis to refine entries/exits.
5. Mistakes Traders Make with Trading Plans
Not writing it down (keeping it “in the head”).
Overcomplicating strategies.
Ignoring rules when emotions take over.
Constantly changing the plan after small losses.
A plan only works if you follow it with discipline.
Part II – The Trading Journal
1. What is a Trading Journal?
A trading journal is a written or digital record of all trades taken, along with notes on reasoning, emotions, and outcomes. It’s like a diary for traders, where every action in the market is logged for review.
2. Why Keep a Trading Journal?
Identifies strengths & weaknesses – shows what’s working and what isn’t.
Tracks emotional state – helps detect patterns of impulsive trades.
Improves accountability – forces you to justify every trade.
Sharpens discipline – prevents repeating mistakes.
Boosts confidence – reinforces good habits by showing progress.
3. Components of a Trading Journal
A good journal records both quantitative and qualitative data.
Quantitative Data (Numbers):
Date & time of trade
Asset traded
Entry price, exit price, stop-loss, target
Position size
Profit/loss in % and amount
Risk-reward ratio
Qualitative Data (Thoughts & Emotions):
Reason for taking trade
Market conditions (trend, volatility, news)
Emotional state (confident, fearful, greedy)
Mistakes made (if any)
Lessons learned
4. Tools for Trading Journaling
Excel/Google Sheets – customizable, easy to analyze.
TradingView screenshots – annotate charts for visual learning.
Dedicated software – Edgewonk, TraderSync, or simple Notion templates.
Pen & paper – traditional, but effective for emotional notes.
5. Example Trading Journal Entry
Date: 20 Aug 2025
Stock: Infosys
Setup: Bullish engulfing near 200 DMA + support zone.
Entry: ₹1550
Stop-loss: ₹1530
Target: ₹1590 (2:1 RR)
Result: Exited at ₹1585, profit ₹35/share.
Emotion: Felt confident but exited early due to fear of reversal.
Lesson: Stick to plan; don’t book profits too soon.
6. Reviewing Your Journal
The real power of journaling lies in reviewing it regularly.
End of week → review all trades taken.
End of month → calculate win rate, average RR, emotional mistakes.
Quarterly → refine strategy based on data.
Patterns will emerge. For example:
You may find most profits come from trend-following trades, while counter-trend trades lose money.
You may notice losses increase when you trade after 3 consecutive wins (overconfidence).
You may realize that impulsive entries happen more often when you skip morning preparation.
7. Common Mistakes with Journals
Not recording losing trades (only writing about wins).
Writing vague reasons (“felt good about this trade”).
Not reviewing the journal frequently.
Treating it as a chore instead of a learning tool.
Part III – Psychology, Discipline & Growth
A trading plan and journal are useless without the right mindset.
1. Emotional Control
Markets constantly test patience, greed, and fear. A plan provides structure, while a journal helps spot recurring psychological pitfalls.
2. The Role of Discipline
Discipline is simply the act of sticking to your plan regardless of temptation. The journal is your accountability partner.
3. Growth Mindset
Losses are inevitable. Journaling turns losses into lessons, making them investments in education rather than failures.
4. The Feedback Loop
Execute trades according to plan.
Record them in the journal.
Review & identify improvements.
Refine the trading plan.
This cycle creates continuous improvement.
Part IV – Practical Tips for Success
Start simple – don’t overload your plan/journal with unnecessary data.
Use screenshots – visual memory is stronger than written notes.
Reward yourself – celebrate when you stick to your plan, even on losing trades.
Keep emotions in check – note them honestly, even if embarrassing.
Backtest strategies – before adding to your plan, test them historically.
Conclusion
A trader without a plan and journal is like a ship sailing without a compass—drifting aimlessly in stormy seas. The combination of a well-structured trading plan and a disciplined journaling practice transforms trading from a gamble into a business.
The plan gives direction.
The journal provides feedback.
Together, they create consistency, accountability, and growth.
Successful trading is not about predicting the market perfectly—it’s about managing risk, executing with discipline, and learning continuously.
If you dedicate yourself to creating and following your trading plan, while diligently maintaining a journal, you’ll find yourself ahead of 90% of traders who rely solely on intuition.

EURNZDPrice action has been strongly bullish, with an impulsive push to the upside that took out a weekly high. That may have completed the price objective, which is why I’m now expecting a potential drop. A structure shift has already occurred and an entry was available, though I didn’t take it.
For now, I’ll stay on the sidelines and watch price action. If price reaches the demand zone, I’ll look for confirmation to get into longs. There’s also a large inefficiency/price void that could be filled on the way down. Let’s see how this pair develops — just sharing a possible scenario.

GBPNZDPrice is currently in an uptrend, with a strong impulse to the upside completed in just 7 bars. The pullback has already taken 15 bars, showing clear weakness from the bears. I’ll be watching for price to reach the demand zone, and will look for confirmation on lower timeframes before considering long entries. In case price pushes higer I am expecting it taking out the high and liquidity on HTF, then possible sell to buy setup can present. Let's see.

Farhan buildIt Works, thats all that matters, working ides/signals for option trading for NIFTY50, NSE
This analysis give you idea for trending patterns

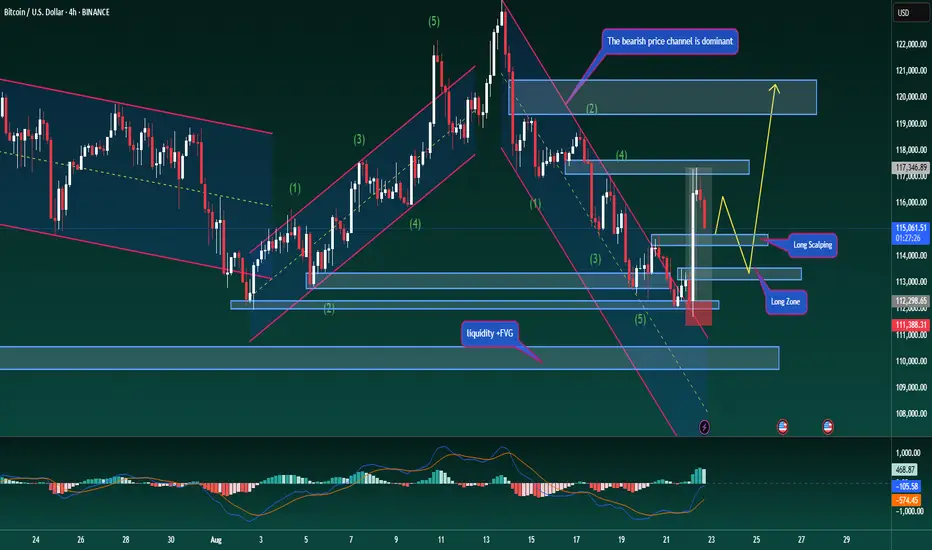
Bitcoin Trend – Breakout from the Downward ChannelBitcoin Trend – Breakout from the Downward Channel
Hello traders,
BTC has broken out of its descending channel with a very strong candle, moving exactly as expected in the corrective rally. At present, price is reacting around 117k, which confirms a shift in structure. For the medium term, the primary trend should now be considered bullish. Traders can look for pullbacks around 114.5k – 113k to add fresh long positions.
From an Elliott Wave perspective, BTC is moving within the final ABC structure. The current move is wave B, and we will be looking to position long once wave C completes.
Target for this long scenario: 120k – 121k, where a mild correction may occur as liquidity is taken.
This is my personal outlook on Bitcoin. Always follow price closely and manage your account carefully to stay safe.
What’s your view on BTC’s breakout? Share your thoughts in the comments so we can trade better together.
Gold: Strong Upside Potential Above $3,350Hello traders,
Looking at the current market setup, gold is hovering near the key resistance zone between $3,340 and $3,350. This area acts as a decisive barrier, and a clear breakout could trigger strong bullish momentum.
Recent price candles with higher trading volumes signal that buyers are becoming more aggressive, suggesting that gold may soon overcome $3,350 and move towards $3,370 or beyond.
On the macro side, expectations of a Federal Reserve rate cut continue to weigh on the US dollar, providing additional support for gold as a safe-haven asset. If the Fed’s meeting minutes or Jerome Powell’s speech at Jackson Hole confirm a dovish stance, it could further fuel the rally.
What’s your view on this move? Do you believe gold can break above $3,350 and extend its rally?
Share your opinion—I’d love to hear your thoughts!
