Farhan buildIt Works, thats all that matters, working ides/signals for option trading for NIFTY50, NSE
This analysis give you idea for trending patterns
Trading

Bitcoin Trend – Breakout from the Downward ChannelBitcoin Trend – Breakout from the Downward Channel
Hello traders,
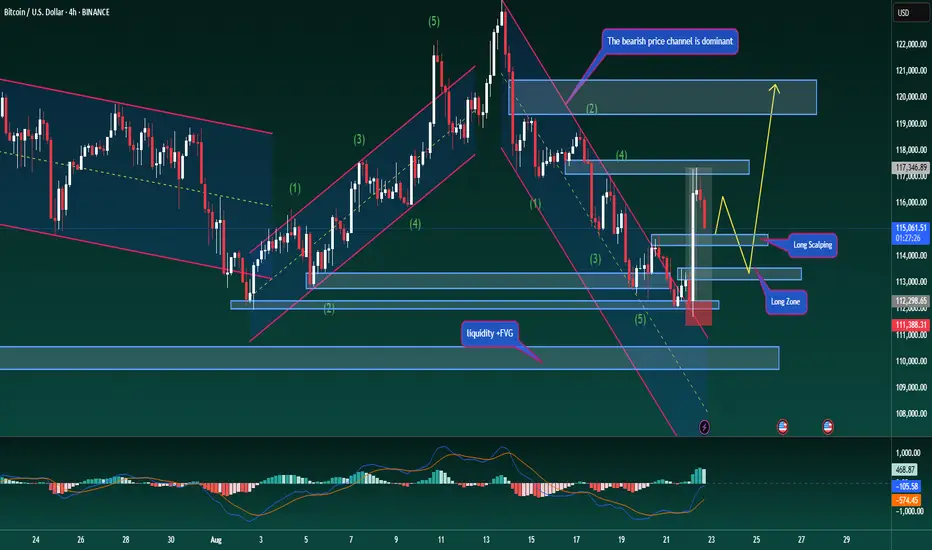
BTC has broken out of its descending channel with a very strong candle, moving exactly as expected in the corrective rally. At present, price is reacting around 117k, which confirms a shift in structure. For the medium term, the primary trend should now be considered bullish. Traders can look for pullbacks around 114.5k – 113k to add fresh long positions.
From an Elliott Wave perspective, BTC is moving within the final ABC structure. The current move is wave B, and we will be looking to position long once wave C completes.
Target for this long scenario: 120k – 121k, where a mild correction may occur as liquidity is taken.
This is my personal outlook on Bitcoin. Always follow price closely and manage your account carefully to stay safe.
What’s your view on BTC’s breakout? Share your thoughts in the comments so we can trade better together.
Gold: Strong Upside Potential Above $3,350Hello traders,
Looking at the current market setup, gold is hovering near the key resistance zone between $3,340 and $3,350. This area acts as a decisive barrier, and a clear breakout could trigger strong bullish momentum.
Recent price candles with higher trading volumes signal that buyers are becoming more aggressive, suggesting that gold may soon overcome $3,350 and move towards $3,370 or beyond.
On the macro side, expectations of a Federal Reserve rate cut continue to weigh on the US dollar, providing additional support for gold as a safe-haven asset. If the Fed’s meeting minutes or Jerome Powell’s speech at Jackson Hole confirm a dovish stance, it could further fuel the rally.
What’s your view on this move? Do you believe gold can break above $3,350 and extend its rally?
Share your opinion—I’d love to hear your thoughts!

Part3 Trading MasterclassOption Trading vs Stock Trading
Stocks = Ownership, long-term growth, dividends.
Options = Contracts, leverage, flexible strategies.
Stocks = Simpler, but capital-intensive.
Options = Complex, but require less capital and offer hedging.
For example:
Buying 100 shares of Reliance at ₹2500 = ₹2,50,000.
Buying 1 call option of Reliance at ₹100 premium with lot size 250 = only ₹25,000.
This leverage makes options attractive—but also riskier.
Real-Life Examples & Case Studies
Case 1: Bull Market
A trader buys Nifty 20000 Call at ₹200 premium. Nifty rallies to 20500. Profit = ₹300 (500 – 200). Huge return on a small premium.
Case 2: Bear Market
Investor holds TCS shares but fears a fall. Buys a protective put. When stock drops, put increases in value, reducing losses.
Case 3: Neutral Market
Trader sells an Iron Condor on Bank Nifty, betting price will stay range-bound. Premium collected = profit if market stays sideways.

Part 2 Trading MasterclassOption Trading vs Stock Trading
Stocks = Ownership, long-term growth, dividends.
Options = Contracts, leverage, flexible strategies.
Stocks = Simpler, but capital-intensive.
Options = Complex, but require less capital and offer hedging.
For example:
Buying 100 shares of Reliance at ₹2500 = ₹2,50,000.
Buying 1 call option of Reliance at ₹100 premium with lot size 250 = only ₹25,000.
This leverage makes options attractive—but also riskier.
Real-Life Examples & Case Studies
Case 1: Bull Market
A trader buys Nifty 20000 Call at ₹200 premium. Nifty rallies to 20500. Profit = ₹300 (500 – 200). Huge return on a small premium.
Case 2: Bear Market
Investor holds TCS shares but fears a fall. Buys a protective put. When stock drops, put increases in value, reducing losses.
Case 3: Neutral Market
Trader sells an Iron Condor on Bank Nifty, betting price will stay range-bound. Premium collected = profit if market stays sideways.

Part 1 Trading MasterclassRisks & Rewards in Option Trading
Option trading can be thrilling, but it’s not without risks.
For Buyers:
Maximum loss = premium paid.
Maximum profit = potentially unlimited (for calls) or huge (for puts).
For Sellers:
Maximum gain = premium received.
Maximum loss = unlimited (for calls) or very large (for puts).
Risks also come from:
Time decay (options lose value daily).
Volatility crush (sudden drop in implied volatility can reduce premiums).
Liquidity issues (wide bid-ask spreads can hurt execution).
That’s why risk management (stop-losses, proper sizing, hedging) is crucial.
Option Trading vs Stock Trading
Stocks = Ownership, long-term growth, dividends.
Options = Contracts, leverage, flexible strategies.
Stocks = Simpler, but capital-intensive.
Options = Complex, but require less capital and offer hedging.
For example:
Buying 100 shares of Reliance at ₹2500 = ₹2,50,000.
Buying 1 call option of Reliance at ₹100 premium with lot size 250 = only ₹25,000.
This leverage makes options attractive—but also riskier.

Part 2 Support and ResistanceHow Options Work
Let’s break it down simply:
If you buy a call, you are betting that the price of the stock will go up.
If you buy a put, you are betting that the price of the stock will go down.
If you sell (write) a call, you are taking the opposite bet—that the stock won’t rise much.
If you sell (write) a put, you are betting that the stock won’t fall much.
Here’s a quick example:
Stock XYZ trades at ₹100.
You buy a 1-month call option with a strike price of ₹105 by paying a ₹5 premium.
If the stock rises to ₹120, your option is worth ₹15 (120 – 105). Since you paid ₹5, your profit = ₹10.
If the stock stays below ₹105, the option expires worthless, and you lose your premium of ₹5.
This example shows that options can magnify profits if you’re right, but they can also cause losses (limited to the premium paid for buyers, unlimited for sellers).
Types of Options
A. Call Options
Right to buy.
Used when you expect prices to rise.
Buyers have limited risk (premium) but unlimited upside.
Sellers (writers) have limited gain (premium received) but unlimited risk.
B. Put Options
Right to sell.
Used when you expect prices to fall.
Buyers have limited risk but big upside if stock falls sharply.
Sellers have limited gain (premium) but large risk if stock collapses.

Part 1 Support and Resistance1. Introduction to Options
In the world of financial markets, traders and investors use various tools to manage risk, speculate on price movements, or generate additional income. One of the most powerful and flexible tools is options trading.
An option is a financial derivative, which means its value is derived from another underlying asset. This underlying asset could be a stock, an index, a commodity, or even a currency. Unlike stocks, where you own a piece of the company, an option is a contract that gives you certain rights related to buying or selling the underlying asset at a specific price and within a specified time.
Options are incredibly versatile. Traders use them for hedging (protection against loss), speculation (betting on future price moves), or income generation (selling options for premiums). But with great flexibility comes complexity, and that’s why understanding option trading deeply is essential before jumping in.
2. Basic Terminology in Option Trading
Before diving deep, let’s clear some essential terms:
Call Option: A contract giving the right (not obligation) to buy an asset at a predetermined price (strike price) before expiration.
Put Option: A contract giving the right (not obligation) to sell an asset at a predetermined price before expiration.
Strike Price: The fixed price at which the option holder can buy (for calls) or sell (for puts) the underlying.
Premium: The cost of purchasing an option contract. This is the price paid upfront by the buyer to the seller (writer).
Expiration Date: The date when the option contract expires. After this, the option becomes worthless if not exercised.
In the Money (ITM): An option that has intrinsic value. For calls, when the stock price > strike price. For puts, when stock price < strike price.
Out of the Money (OTM): An option with no intrinsic value (only time value). For calls, stock price < strike price. For puts, stock price > strike price.
At the Money (ATM): When the stock price and strike price are roughly equal.
Option Writer: The seller of the option contract. They receive the premium but take on obligation.
Lot Size: Options are traded in fixed quantities called lots (e.g., 50 or 100 shares per contract depending on the market).
Understanding these terms is like learning the alphabet before writing sentences—you need them to progress.

Bitcoin in a Tight Range, Dollar Pressure PersistsBitcoin is consolidating around 113,700 USDT after a sharp decline from its mid-August peak near 124,000 USDT. On the H4 chart, the price remains sideways just below the 115,000 – 116,000 USDT fair value gap, and still trades under the Ichimoku cloud, suggesting that bearish momentum continues to dominate.
Meanwhile, the US dollar holds firm, with Treasury yields staying elevated, adding further pressure on risk assets such as Bitcoin. Looking ahead, all eyes are on Fed Chair Jerome Powell’s speech at Jackson Hole, which could act as a major catalyst, driving strong volatility in BTC over the coming sessions.
Stay cautious and manage your risk as we approach this key event.

EUR/USD: Uptrend Still Intact, Eyes on 1.1750On the 4H chart, EUR/USD has shown a solid rebound from the 1.1650 – 1.1670 support zone, confirming that buyers remain firmly in control. Price is now approaching 1.1700, closely tracking the upper edge of the Ichimoku cloud. More importantly, as long as it holds above 1.1685, the bullish momentum remains difficult to challenge. The next destination appears clear: the 1.1750 – 1.1780 area, overlapping with prior resistance and an unfilled red FVG. This zone will serve as a decisive test of strength, with the current momentum favoring a short-term push higher.

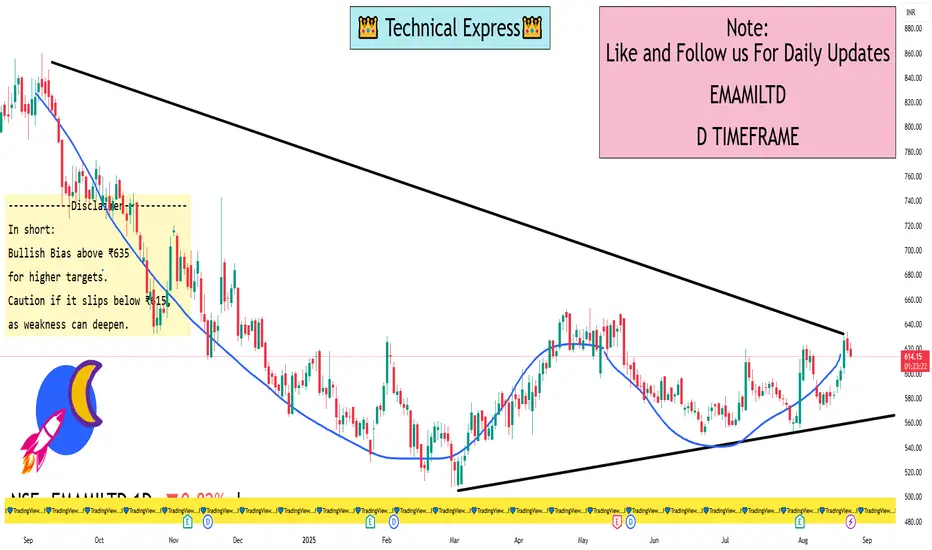
EMAMI 1 Day ViewEmami Ltd – Daily Levels
Current Market Structure: Stock is trading in a consolidation range after a recent upward move. Momentum is steady but showing mild profit-booking near resistance.
🔑 Key Levels
Support Zones
₹615 – Strong near-term support, recent demand zone.
₹600 – Major support, breakdown below may invite weakness.
₹585 – Next cushion if selling extends.
Resistance Zones
₹635 – Immediate resistance (recent supply zone).
₹648 – Breakout level; above this stock may gain momentum.
₹660+ – Next bullish target if breakout sustains.
Trend Outlook
Above ₹635 → Momentum buyers may push toward ₹648–660.
Below ₹615 → Weakness may drag it back toward ₹600–585.
📌 Indicators View
Volume: Decreasing, showing consolidation.
RSI (Daily): Near neutral zone (~50–55), showing balanced momentum.
200 DMA: Stock trading comfortably above it, indicating long-term bullishness intact.
EIEL 1 Day ViewPrice Action Snapshot (22 Aug 2025)
According to Moneycontrol, the current day’s trading range for EIEL is ₹260.95 – ₹274.00.
Investing.com data confirms a real-time price of ₹268.30, with the same daily range and a 52-week range of ₹182.00–₹391.60.
Economic Times reports a 1-day return of +3.3%, with the current price around ₹268.05–₹268.30.
Technical Signals
TradingView labels the 1-day technical rating for EIEL as Neutral, based on a combination of oscillators and moving averages.
Investing.com India provides a more bullish interpretation:
RSI (14-day): ~69.38 — indicating a "Buy" zone.
MACD: 3.060 — a bullish signal.
All moving averages (5-, 50-, 200-day) are suggesting "Buy".
Overall, the daily technical outlook is “Strong Buy”.
What Does "L 1 Day Time Frame Level" Mean?
You might be exploring the technical level or sentiment over a 1-day timeframe for EIEL. From the data:
TradingView summarizes the technical indicators as Neutral.

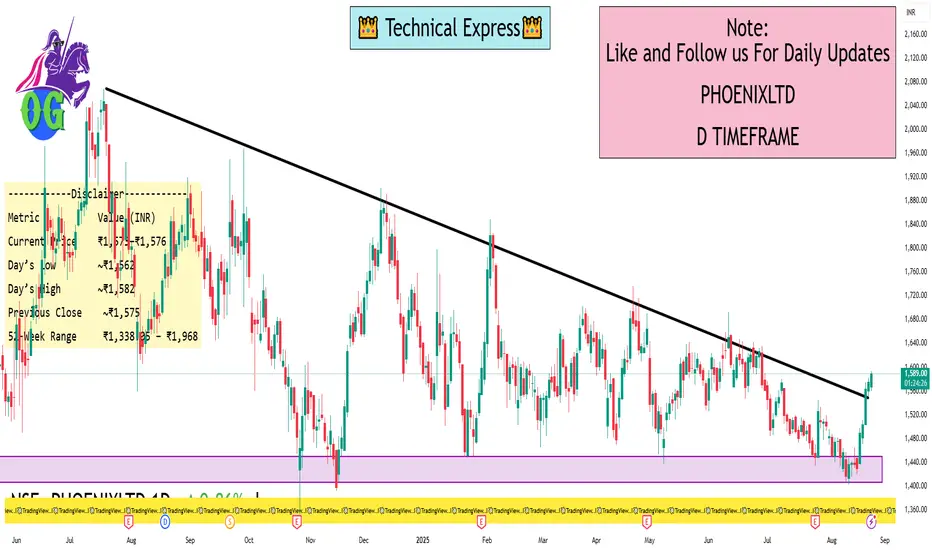
Phoenix 1 Day ViewHere’s a summary of the latest intraday data:
Current price: Approximately ₹1,573.00–₹1,576.00
Daily range: Between ₹1,562.00 (low) and ₹1,582.50 (high)
Previous closing price: Around ₹1,575.50
52-week range: ₹1,338.05 — ₹1,968.00
Specifically:
TradingView reports a current price of ₹1,575.50, showing a gain of ~0.76% in the last 24 hours. Day’s range is consistent with ₹1,562.00–₹1,582.50
Screener shows the price at ₹1,573 as of 10:44 a.m. IST today
Investing.com indicates the stock is trading at ₹1,575.50, with day’s range and 52-week range matching other sources
Financial Times Markets Data confirms intraday trading between ₹1,560.40 and ₹1,582.50, with previous close at₹1,575.00
Suggested Next Steps
Charting Platforms – Sites like TradingView, Investing.com, or Moneycontrol offer real-time intraday charts. These let you analyze key levels such as open, high, low, VWAP, and volume trends.
Technical Indicators – To identify support and resistance, you might want to apply indicators like moving averages (e.g., 20/50 EMA), RSI, or VWAP.
Alerts and Watchlists – Set price alerts around critical levels (e.g., ₹1,562 or ₹1,582) to stay informed of key moves.
Volume Analysis – Intraday volume can confirm the strength behind any move—higher volume on breakouts or dips is particularly telling.
XAU/USD: Bearish Bias Ahead of Fed SpeechesHello everyone,
Today the market awaits speeches from Collins, Powell, Hammack, and even the U.S. President. With such anticipation, risk appetite remains cautious and the USD is seeing mild support. In this context, I lean towards a bearish scenario for gold on the daily chart: price is stuck below the dense resistance cluster around 3340–3355 (supply FVG + Ichimoku cloud/volume area), where repeated attempts to push higher have failed.
The sideways–to–downward structure, marked by lower highs since early this month, combined with the latest candle closing under the red FVG zone, signals fading buying momentum. Unless we hear clear dovish tones from the Fed, the 3340–3355 supply zone is likely to continue capping price. My preferred scenario is a pullback to 3315–3305, with an extension to 3295–3285 if USD strength persists. This outlook will be invalidated if we see a daily close above 3350, in which case a move back toward 3370 becomes possible.

Money and Mind in Trading1. Introduction
Trading is often viewed as a battle between the trader and the market. But in reality, the market is neutral—it doesn’t care about you, your opinions, or your predictions. The true battle is internal, between your money (how you manage your capital) and your mind (how you handle emotions and psychology).
Think about this:
A trader with a brilliant strategy but poor money management will eventually lose all capital.
A trader with enough money but a weak mindset will panic and make irrational moves.
Only when money management and psychological discipline align, can trading become consistently profitable.
Thus, the formula for success in trading can be summarized as:
Trading Success = Money Management × Mind Management × Strategy
2. The Role of Money in Trading
a) Importance of Capital
Money is the fuel of trading. Without adequate capital, even the best strategies can fail.
Undercapitalized traders often take excessive risks to make meaningful returns.
Well-capitalized traders can afford patience, better position sizing, and discipline.
For example, if you only have ₹10,000, risking ₹5,000 on a single trade feels tempting but dangerous. With ₹10 lakh, you can risk just 1% per trade and still earn consistently without emotional stress.
b) Risk Management
Risk management is about protecting capital first and focusing on profits second.
Golden rules:
Never risk more than 1-2% of capital per trade.
Always set a stop-loss before entering.
Diversify trades instead of going “all in.”
This ensures survival. Because in trading, survival = opportunity to win tomorrow.
c) Position Sizing
Position sizing determines how much to trade given your account size and risk tolerance.
Formula example:
If you have ₹1,00,000 capital and risk 1% per trade (₹1,000), and your stop-loss is ₹10 per share, you can buy 100 shares (₹1,000 ÷ ₹10).
This systematic approach removes emotional guessing.
d) Compounding and Capital Growth
The real wealth in trading comes from compounding small gains consistently.
A trader making 1% per week can grow capital by over 67% annually (with compounding).
Patience + consistency beats “get rich quick.”
e) Common Money Mistakes in Trading
Over-leverage (borrowing excessively to trade).
No risk/reward planning.
Chasing losses (“revenge trading”).
Putting all money in one stock/option.
Trading without capital backup (no emergency funds).
Money mistakes often lead to psychological pressure, which worsens decision-making.
3. The Role of Mind in Trading
If money is the fuel, then the mind is the driver. Even with perfect capital management, a weak mindset can wreck results.
a) Psychology of Decision-Making
Trading decisions are influenced by:
Fear – “What if I lose?”
Greed – “Let me hold longer for bigger profit.”
Hope – “Maybe it will recover.”
Regret – “I should’ve sold earlier.”
These emotions distort rational thinking.
b) Common Psychological Biases
Overconfidence Bias – After a few wins, traders feel invincible.
Loss Aversion – People hate losing ₹1 more than they enjoy gaining ₹1.
Confirmation Bias – Seeking news that supports your view while ignoring opposite evidence.
Gambler’s Fallacy – Believing a losing streak must end soon.
Recognizing these biases helps neutralize them.
c) Discipline Factor
Discipline = Following your trading plan no matter what.
Without discipline, traders exit winners too early and hold losers too long.
With discipline, traders follow stop-loss, stick to risk per trade, and wait for setups.
d) Patience vs Impulsiveness
Great trades don’t appear daily. Impulsive traders overtrade, while patient traders wait for high-probability setups.
As Jesse Livermore said: “It was never my thinking that made me money. It was always my sitting.”
e) Building Mental Resilience
Trading is stressful because of uncertainty. To build resilience:
Accept that losses are part of the game.
Detach ego from trades.
Focus on the process, not outcome.
Develop habits outside trading (exercise, meditation, journaling).
4. The Money-Mind Connection
Money and mind are deeply linked in trading:
Lack of money → stress, fear, over-leverage.
Too much greed for money → reckless decisions.
Emotional mind → bad money management.
Example: A trader with ₹20,000 risks ₹10,000 in a single option trade. Why? The mind says: “I need quick profits.” But when the trade goes against him, fear takes over and he exits at maximum loss. This is the money-mind trap.
Thus, the solution is balance:
Adequate capital.
Strict money management.
Calm psychology.
5. Practical Framework: Money + Mind Balance
Here’s a practical blueprint:
Step 1: Define Capital Rules (Money)
Risk per trade: 1% of account.
Risk per day: 3% max.
Keep emergency funds separate.
Step 2: Define Psychological Rules (Mind)
Accept losses without revenge trading.
No overtrading after big wins.
Stick to trading hours and avoid burnout.
Step 3: Journaling
Keep a trading journal tracking not just trades, but also your emotions. Example:
“Exited early due to fear.”
“Didn’t follow plan because of greed.”
This self-awareness improves both money and mind management.
6. Case Studies & Examples
Case 1: The Undisciplined Trader
Rahul starts with ₹50,000. He risks ₹20,000 on a single option trade. It fails. Capital halves. In desperation, he doubles down and loses everything.
Lesson: Poor money management + emotional revenge trading = wipeout.
Case 2: The Disciplined Trader
Meera starts with ₹1,00,000. She risks only 1% per trade. She loses 5 trades in a row, but her account is still ₹95,000. On the 6th trade, she wins 5R (₹5,000). Net balance: profit.
Lesson: Risk control and patience protect the trader until a winning streak comes.
7. Conclusion: The Balanced Trader’s Blueprint
Trading is not just charts, patterns, or strategies. It is a test of two inner resources:
Money – How you allocate, risk, and grow your capital.
Mind – How you manage emotions, discipline, and psychology.
Without money, you can’t trade. Without the right mind, you can’t trade successfully. Together, they form the foundation of long-term trading success.
The secret is not to chase quick riches, but to survive, grow steadily, and let compounding work. And survival comes only when your money rules protect your capital and your mind rules protect you from yourself.
In short: Master the money, master the mind, and the market will reward you.
Risk Smart, Grow Fast: Survival Guide for Small Account TradersIntroduction
Trading is an arena that excites many with the promise of financial freedom, rapid wealth creation, and independence from traditional jobs. But the harsh truth is that most new traders lose money, especially those starting with small accounts. A small account brings its own set of challenges: limited capital, strict margin restrictions, emotional pressure, and the risk of blowing up quickly. Yet, history and countless success stories prove that small accounts can grow into big ones—if approached with discipline, risk management, and strategy.
This survival guide is written with one mission: to help small account traders trade smart, protect their capital, and accelerate growth without succumbing to the pitfalls that destroy most beginners.
Chapter 1: The Reality of Trading Small Accounts
Trading with a small account is different from trading with a large one. With limited funds, every decision matters. A small loss feels heavy, a bad trade can wipe out days or weeks of progress, and transaction costs hurt more.
Key challenges small account traders face:
Capital Constraint – With only ₹10,000–₹50,000 (or a few hundred dollars), position sizing becomes tricky. You cannot afford large drawdowns.
Emotional Pressure – Fear of losing and greed for doubling the account often drive impulsive trades.
Leverage Temptation – Brokers offer leverage, but small traders misuse it, leading to margin calls.
Risk of Ruin – One or two bad trades with no stop-loss can blow up the account completely.
Survival begins with accepting this reality: your first goal isn’t to make money fast—it’s to not lose money unnecessarily.
Chapter 2: The Mindset of a Survivor
Most traders fail not because of poor strategies, but because of poor psychology. Small account traders must adopt a “capital preservation” mindset before thinking about profits.
Think Like a Risk Manager – Ask: How much can I lose? before asking How much can I make?
Detach from Ego – Your account size doesn’t define your skill. Stay humble, focus on learning.
Play the Long Game – Compounding works wonders, but only if you survive long enough.
Embrace Boring Consistency – Avoid chasing thrill trades. Professional traders trade boring setups repeatedly.
Chapter 3: Risk Management is Your Lifeline
With a small account, risk management is the difference between survival and destruction.
1. The 1% Rule
Risk no more than 1–2% of your capital on a single trade.
Account: ₹25,000
1% Risk: ₹250
If your stop-loss is 5 points away, you can only take 50 shares.
This way, even after 10 losing trades, you lose only 10% of capital, not the whole account.
2. Stop-Loss is Non-Negotiable
Never enter a trade without a predefined stop-loss. Markets are unpredictable. Stop-loss is your insurance.
3. Position Sizing Formula
Position Size = (Account Risk × % Risk per Trade) ÷ Stop-Loss Distance
This ensures you don’t oversize.
4. Risk/Reward Ratio
Take trades only when reward is at least 2x the risk. Example: risking ₹500 to make ₹1,000.
5. Avoid Overtrading
Chapter 4: Strategies That Work for Small Accounts
Not all strategies are suitable for small traders. Complex multi-leg option spreads, long-term positional trades, or capital-heavy setups may be unfit. Instead, focus on high-probability, low-risk strategies.
1. Scalping with Discipline
Small, quick trades capturing 0.3–1% moves.
Works best in liquid instruments like Nifty, BankNifty, Reliance, HDFC Bank.
Needs strict stop-loss, otherwise one bad trade kills multiple small wins.
2. Breakout Trading
Enter when price breaks strong support/resistance.
High risk/reward if you wait for confirmed breakout with volume.
3. Intraday Option Buying
Cheap premiums, limited risk (premium paid), unlimited potential.
Works best with momentum days after news, events, or opening range breakouts.
4. Swing Trading
Holding positions for 2–10 days with stop-loss.
Helps small traders avoid intraday noise and transaction costs.
5. Volume Profile + Price Action
Identify where institutions are active.
Trade only when market structure supports your bias.
Avoid random entries.
Chapter 5: The Power of Compounding – From Small to Big
Growing a small account requires patience. Let’s see how small consistent returns compound:
₹25,000 with 5% monthly growth → ₹52,700 in 1 year → ₹1.11 lakh in 2 years → ₹2.36 lakh in 3 years.
Compounding turns modest returns into life-changing results.
The key: Protect the downside. Without survival, compounding is impossible.
Chapter 6: Tools & Tactics for Small Account Traders
Broker Selection – Choose brokers with low commissions, no hidden charges, and seamless platforms.
Charting Platforms – Use TradingView or equivalent for better analysis.
Journaling – Record every trade: entry, exit, stop-loss, reasoning. This builds discipline.
Avoid F&O Overexposure – Don’t jump into naked futures without experience.
Cash is Also a Position – Sometimes the best trade is no trade.
Chapter 7: Common Mistakes Small Traders Make
Over-leverage – Blowing up accounts by using margin excessively.
Revenge Trading – Doubling down after a loss to “recover fast.”
No Risk Plan – Trading without stop-loss or risk limits.
Following Tips Blindly – Copying Telegram/WhatsApp calls without analysis.
Impatience – Expecting to turn ₹10,000 into ₹1 lakh in 1 month.
Chapter 8: Building Discipline & Routine
Trading success isn’t about finding a “holy grail strategy.” It’s about developing habits.
Morning Preparation – Identify levels, mark support/resistance.
Defined Trading Hours – Trade only when market is active.
Post-Market Review – Log trades, analyze mistakes.
Mental Fitness – Meditation, walks, or journaling to control emotions.
Consistency in routine = Consistency in profits.
Chapter 9: Scaling Up – When to Increase Lot Size
Don’t rush. Scale gradually.
Rule: Increase position size only when account grows by 25–30%.
Example: If you start with ₹25,000, increase lot size only after reaching ₹32,500+.
Never double size overnight—it kills accounts.
Chapter 10: The Trader’s Code of Survival
To grow fast while being risk smart, every small account trader should follow this code:
Protect capital first, profits second.
Trade only setups with favorable risk/reward.
Never risk more than 1–2% per trade.
Keep emotions in check—stick to plan.
Journal trades, learn continuously.
Compound with patience, scale gradually.
Conclusion
Trading a small account is like sailing a fragile boat in stormy waters—you must be extra cautious, disciplined, and skillful to survive. Many traders fail because they chase fast riches, ignore risk management, and trade emotionally. But those who respect risk, stay patient, and stick to disciplined strategies can not only survive but thrive.
Remember: Your small account isn’t a limitation—it’s your training ground. Survive long enough, grow consistently, and one day, the small account you’re protecting today will be the large account that gives you freedom tomorrow.
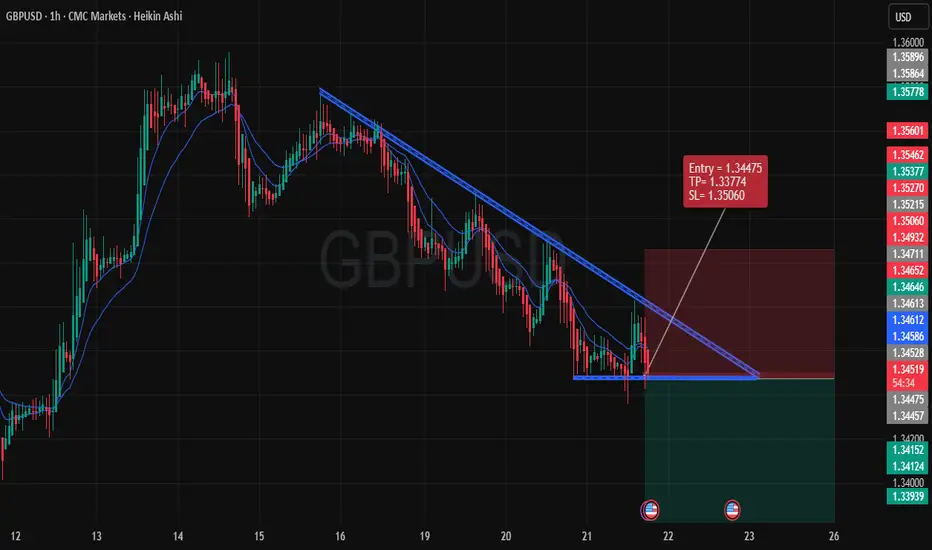
GBP/USD Bearish Trade Idea** IF you like my observation, please boost and follow for more content."
Overview:
The chart displays a clear bearish setup on the 1-hour timeframe for the GBP/USD currency pair. The pair has formed a descending triangle pattern, indicating potential downward price action. The price has been respecting the trendline resistance, which adds confidence to the short trade. Here’s a detailed breakdown of the key elements for this trade:
1. Pattern Formation:
Descending Triangle: A continuation pattern that suggests consolidation and potential breakout to the downside. The price is nearing the apex of the triangle, and we anticipate the breakout to occur below the horizontal support at 1.34495.
2. Entry Point:
The entry is set at 1.34475, just below the critical horizontal support level. This level aligns with the trendline resistance from previous price action, ensuring that we are positioning ourselves at a point where price momentum is likely to shift downward.
3. Stop-Loss (SL):
The stop-loss is placed at 1.35060, just above the trendline resistance. This level is chosen to minimize the risk in case the price fails to break the support and reverses back upward. Keeping the SL tight ensures that the risk is controlled.
4. Take-Profit (TP):
The take-profit level is set at 1.33774, based on the price's potential to reach a key support zone. The target is set at a conservative level, providing a strong risk-to-reward ratio while aligning with previous price action lows.
5. Risk to Reward Ratio:
With a SL of 85 pips and a TP of 705 pips, the trade offers a favorable 1:8.3 Risk to Reward Ratio. This ensures that the reward far outweighs the risk, making it a worthy trade setup for those seeking high probability and high return trades.
6. Technical Indicators:
Trend Indicators: The 9 and 20 EMA lines confirm the bearish trend as the price is trading below these EMAs. The cross of the 9 EMA below the 20 EMA further supports the downside momentum.
Volume: A decrease in volume during the consolidation phase suggests a buildup for a breakout, likely to the downside as indicated by the pattern.
7. Conclusion:
This trade setup provides a logical bearish scenario, supported by strong technical analysis. The entry, SL, and TP are placed strategically based on price action and pattern confirmation. A breakout below the support level at 1.34475 would trigger the short position, aiming for the next significant support at 1.33774.
The risk is well-managed with a tight SL, and the reward is significant, offering an excellent risk-to-reward profile.
Make sure to monitor the breakout closely, as this setup depends on the price respecting the triangle formation.
Gold ....Powell Speech to Break the Range?Gold held steady after yesterday’s pullback, but the 3350 zone continues to act as a strong resistance. Despite multiple bullish attempts, price has failed to break through this ceiling, keeping the upside capped. On the lower side, immediate support stands at the previous weekly low (3330), followed by the recent swing low near 3310. These levels are key for buyers to defend.
For now, price action has compressed further into a tight range, and there hasn’t been any major development since the last session. With Powell speech lined up today, the market is likely to stay cautious and range-bound until then. Once the event is out, we could see a clearer short-term direction, either a breakout above 3350 opening room for recovery, or a breakdown below 3310 tilting bias back in favor of sellers.

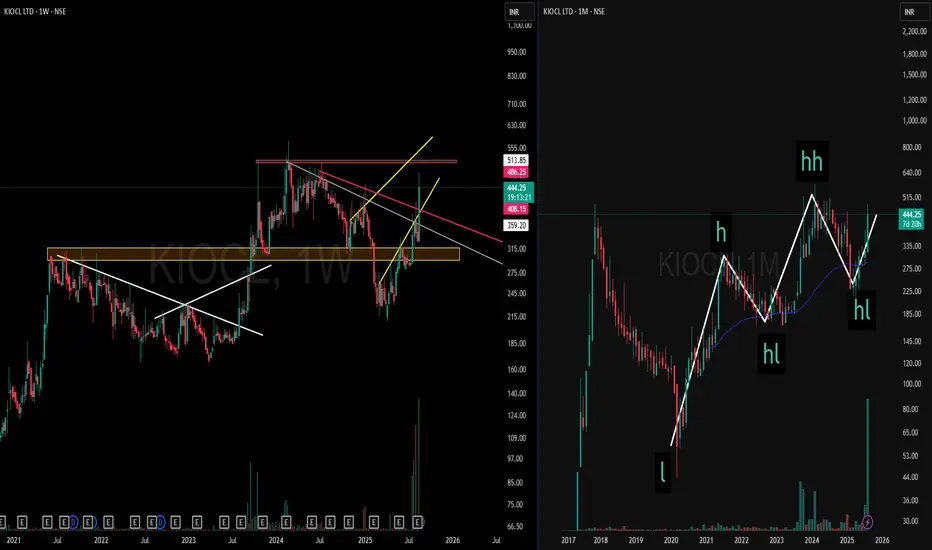
Multi-Timeframe Strength | KIOCL> On the Weekly Timeframe (left), price has gone through extended consolidation phases with counter-trendline breaks and zones of supply transitioning into demand.
> On the Monthly Timeframe (right), the broader structure highlights Higher Highs and Higher Lows, providing a clear larger-picture context.
> Key Takeaway:
Multi-timeframe alignment showcases structural clarity — from consolidation and shifts on the weekly to trend progression on the monthly.
XRP/USD Trade Setup: Bearish Position on Technical AnalysisTimeframe: 1 Hour
Entry Price: 3.0229
Take Profit (TP): 2.8769
Stop Loss (SL): 3.1199
1. Market Overview
XRP is currently in a bearish phase, and the price action indicates that a downward continuation is likely. The market has been rejecting higher levels, with strong resistance at the 3.1777 zone, and now the price appears to be moving lower.
2. Entry Criteria:
The entry point is set at 3.0229, just below the current price level, where we anticipate the market to continue its downward movement after facing resistance at higher levels.
The recent price action shows a clear rejection from the upside, and we are expecting further downside once the price breaks below the immediate support near the entry.
3. Technical Indicators:
Heikin Ashi Candles: The chart uses Heikin Ashi candles, which help smooth the price action. The red candles indicate a bearish sentiment, confirming the continuation of downward pressure.
Volume Analysis: The increase in volume during the recent selling phase is confirming that the bears are in control and the trend may continue to the downside.
4. Support & Resistance Levels:
Resistance: The price is facing resistance around 3.1777, which has proven to be a significant level of rejection.
Support: The main support zone is located near the 2.8769 level, which coincides with our take profit (TP). This is a logical target as it aligns with previous lower levels and current trend structure.
5. Risk-Reward Ratio:
The Stop Loss is placed at 3.1199, just above the recent swing highs and resistance level, ensuring we limit risk in case of a market reversal.
The Take Profit is set at 2.8769, offering a solid risk-reward ratio of 1:1.5. This level is where we expect the price to find support and potentially reverse after hitting the target.
6. Trade Management:
Monitor Resistance Level: If the price fails to break below the entry and starts moving upward, consider adjusting the stop loss or exiting the position to limit losses.
Trailing Stop: Once the price starts moving in your favor, consider implementing a trailing stop to lock in profits as the price moves lower.
7. Potential Risks:
False Breakdown: A false breakdown is always a risk, where the price could temporarily dip below the support and reverse, hitting the stop loss before continuing lower.
Market Volatility: Be mindful of the inherent volatility in the crypto market, which can lead to sudden reversals due to news or other external factors.
8. Conclusion:
This trade setup is based on a bearish market structure, where price is showing clear resistance and the potential for further downward movement. The setup is logical with a strong risk-reward ratio and a clear target for profits. As always, risk management is crucial, and it's important to monitor price action closely for any signs of reversal.
Good luck, and trade carefully!

Part 6 Institutional Trading When to Use Each Strategy
Bullish Market → Long Call, Bull Call Spread, Covered Call.
Bearish Market → Long Put, Bear Put Spread.
Sideways Market → Iron Condor, Butterfly, Covered Call.
High Volatility → Straddle, Strangle.
Low Volatility → Credit Spreads, Iron Condor.
Risk Management in Options
Options can be dangerous if used blindly. Key risk management rules:
Never sell naked options without hedge (unlimited risk).
Use position sizing – don’t risk more than 2–5% of capital in one trade.
Always track Greeks:
Delta (directional risk),
Theta (time decay),
Vega (volatility risk),
Gamma (rate of change).
Use stop-loss even in options.

Part 4 Institutional Trading Types of Option Strategies
Here’s the heart of the discussion: strategies.
Single-Leg Strategies (Simple & Beginner-Friendly)
a) Long Call (Buying a Call)
View: Bullish
Risk: Limited to premium paid
Reward: Unlimited (theoretically)
Example: Buy Reliance 2800 CE @ ₹50 → If Reliance goes to 2900, profit = ₹50.
b) Long Put (Buying a Put)
View: Bearish
Risk: Limited to premium paid
Reward: Large downside profit potential
Example: Buy Nifty 22,000 PE → If Nifty falls, profit rises.
c) Covered Call
View: Neutral to mildly bullish
How it works: Hold stock + Sell a Call option
Goal: Earn income from option premium
Risk: Stock falls significantly.
d) Cash-Secured Put
View: Neutral to bullish
How it works: Sell a Put with enough cash to buy stock if assigned.
Goal: Collect premium or buy stock cheaper.

Part 3 Institutional Trading Why Traders Use Options
Options are powerful because they can serve three main purposes:
Hedging – Protecting an existing portfolio from adverse price moves.
Example: A long-term investor holding Infosys shares may buy a Put option to protect against a fall.
Speculation – Betting on market direction with limited capital.
Example: Buying a Call if you expect bullish momentum.
Income Generation – Selling options to collect premium regularly.
Example: Writing Covered Calls on stocks you own.
The same instrument (options) can be used very differently by traders with different goals. That’s why strategies matter.
Types of Option Strategies
Here’s the heart of the discussion: strategies.
Single-Leg Strategies (Simple & Beginner-Friendly)
a) Long Call (Buying a Call)
View: Bullish
Risk: Limited to premium paid
Reward: Unlimited (theoretically)
Example: Buy Reliance 2800 CE @ ₹50 → If Reliance goes to 2900, profit = ₹50.
b) Long Put (Buying a Put)
View: Bearish
Risk: Limited to premium paid
Reward: Large downside profit potential
Example: Buy Nifty 22,000 PE → If Nifty falls, profit rises.
c) Covered Call
View: Neutral to mildly bullish
How it works: Hold stock + Sell a Call option
Goal: Earn income from option premium
Risk: Stock falls significantly.
d) Cash-Secured Put
View: Neutral to bullish
How it works: Sell a Put with enough cash to buy stock if assigned.
Goal: Collect premium or buy stock cheaper.
