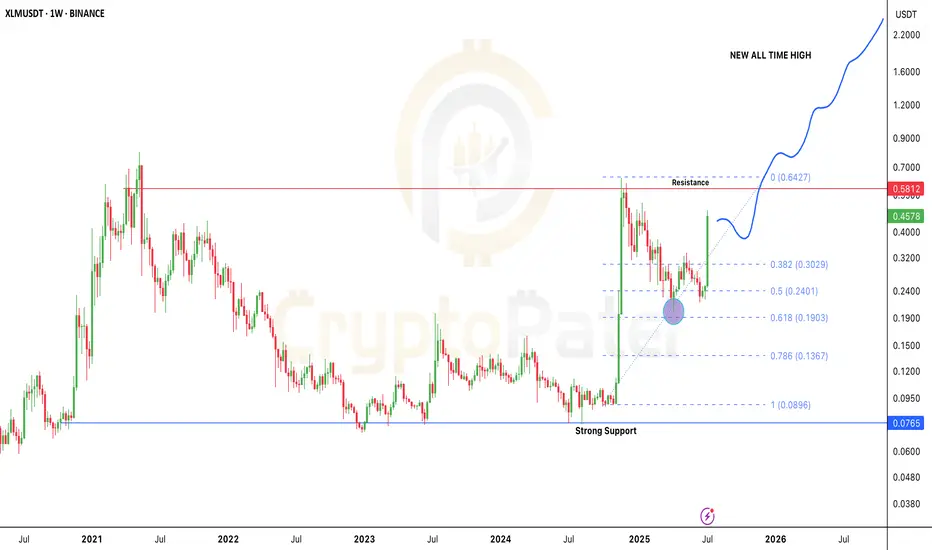
Stellar Breakout: Is $XLM the Next 10x Altcoin of 2025?After months of sideways action and accumulation, Stellar is finally showing real strength.
In the last 4 weeks alone, CRYPTOCAP:XLM has pumped over 120%, bouncing perfectly from the key 0.618 Fibonacci level near $0.19 — a classic reversal zone.
Here’s what’s really going on 👇
🔹 Back in Nov 2024, CRYPTOCAP:XLM went from $0.09 to $0.6374 in just 30 days — that’s a 600% move!
🔹 After that huge rally, price corrected nearly -68%, landing right at the golden Fib zone.
🔹 And guess what? Buyers stepped in hard, flipping the trend back to bullish.
Could we see a pullback?
Sure — maybe a small dip toward $0.30 (0.382 Fib). That’s normal. But the overall structure looks super bullish right now.
Major Resistance: $0.58
If that breaks and flips into support — we’re likely headed toward $2–$5 in the next wave.
This is one of the cleanest macro charts in the altcoin market right now.
👇 Drop your XLM target for this bull run in the comments!
Let’s see who’s aiming for the moon.
Note: DYOR & NFA
Trading
Breakout vs Fakeout: Master this logic to become a better TraderBreakouts can be deceiving. In this video, I dive deep into the psychology and structure behind breakouts vs fakeouts, how to spot the traps, and how to trade them with precision.

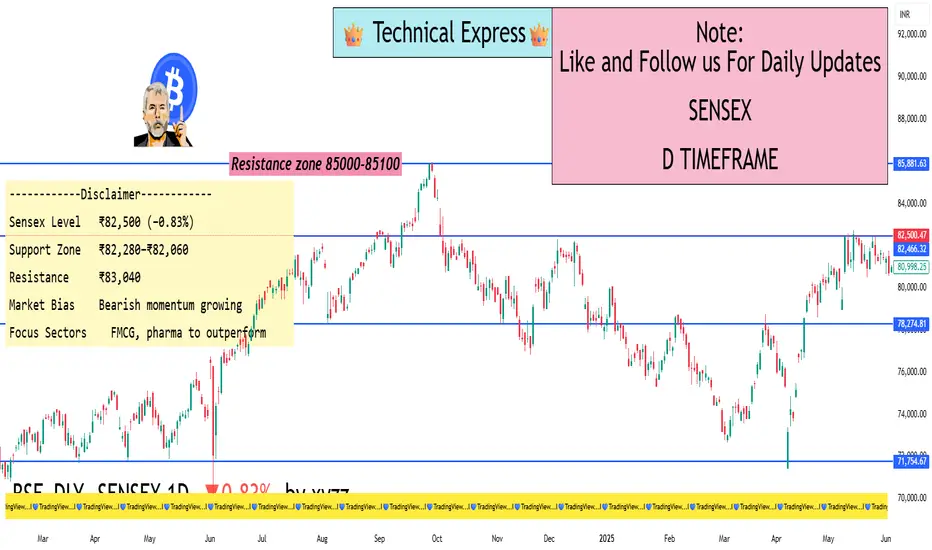
Sensex Dives Below ₹82,600 — IT Stocks Drag Index DownFrom a technical standpoint, Sensex breaking below ₹82,600 is important. This was seen as a short-term support level. Now that it's broken, ₹82,280 and ₹82,060 are the next zones to watch for.
Moving Averages:
Sensex has slipped below its 20-day moving average, which is often used as a trend indicator.
This shows short-term weakness and signals caution for traders.
RSI (Relative Strength Index):
RSI is heading lower but not yet in oversold territory.
This means there could be more downside before a potential bounce.
MACD:
The MACD indicator is also showing bearish crossover – another sign that the market could stay weak in the near term.
What Should Traders & Investors Do Now?
For Traders:
This is a time to stay cautious.
Avoid taking aggressive long positions unless Sensex reclaims ₹83,000+ with strong volume.
Focus on stock-specific opportunities in sectors like FMCG, pharma, or even PSU banks.
For Long-Term Investors:
Don’t panic. Corrections like these are common.
Instead of trying to time the market, look for quality stocks at attractive valuations.
IT stocks are fundamentally strong, so long-term investors can accumulate slowly on dips, especially if they fall further.
Global Factors at Play
What happens in the global economy directly affects Indian markets. Here are some international cues that are influencing Sensex:
US Interest Rates:
The US Federal Reserve may raise interest rates again to fight inflation.
Higher rates make borrowing expensive, slow down spending, and can trigger a global slowdown.
China's Economic Data:
Slower growth in China has worried global investors.
A slowdown in Asia’s biggest economy has ripple effects on global demand.
Geopolitical Tensions:
Trade issues, especially between the US and China, are creating uncertainties.
Wars or unrest in regions like Ukraine or the Middle East also cause global instability.
What to Watch in Coming Days
Key Events:
More Q1 results from major companies
Global inflation data releases
FII (Foreign Institutional Investors) activity – whether they continue selling or start buying
Crude oil price movement – as it affects inflation and currency
RBI commentary on interest rates
📢 Final Thoughts
The fall in Sensex below ₹82,600 is a signal for caution, not panic. The IT sector’s weakness has triggered the fall, but the overall market is still stable when compared to global peers.
For serious investors, this is a good time to review portfolios, build a watchlist, and focus on quality stocks and sectors that show relative strength. Defensive sectors like FMCG and pharma are showing signs of leadership.
Market cycles are natural – after every fall, there's a recovery. The key is to stay updated, stay disciplined, and not let emotions drive your decisions.
Supply Zone Trading Explained from Scratch | Master it todayA complete beginner-to-pro guide on supply zones — learn why they matter, how to draw them, and how traders can use them for smart decisions.

PTC: a probable long trade➡️fii stake increased QoQ by almost 12%
➡️volatility contraction observed
➡️consolidation near the supply zone makes this a high probability trade after the volume uptick on Friday
➡️stop loss at 178

If $NEAR hits $50, will you regret not buying at $2?🚨 NEAR/USDT Weekly Chart Update 🚨
NEAR has bounced from a strong weekly support level inside a multi-year triangle. This bounce looks powerful and could be the start of a major move.
🔹 Current Price: $2.51
🔹 Entry Zone: $2.00–$2.50
🔻 Invalidation Level: Below $1.80 (if price drops here, the setup fails)
This bounce could lead to a big rally in the coming months.
🟢 Target Levels:
$3.30
$7.77 – Mid-term resistance
$16.72 – Bullish target
$30 to $50 – Long-term upside if momentum builds
That’s up to 2000% potential upside from current levels.
Pullbacks between $2.50–$2 can offer another good entry.
Key Point: This bounce from support looks like the early stage of a larger uptrend. It's a good time to position slowly and carefully — but always manage your risk.
What’s your view on NEAR’s bounce?
Note: NFA & DYOR

TRADER PSYCHOLOGY - Overtrading The Silent Killer of ConsistencyTRADER PSYCHOLOGY | EPISODE 1: Overtrading – The Silent Killer of Consistency
In the dynamic world of forex trading, success doesn't come from doing more — it comes from doing right. Yet many traders, especially full-time traders in India, unknowingly fall into a common psychological trap that slowly erodes both their capital and confidence: Overtrading.
Let’s break it down — what overtrading is, why it happens, and most importantly, how to stop it before it burns through your progress.
🧠 What Is Overtrading in Forex?
Overtrading refers to excessive trading – opening too many positions without clear signals or justification based on your strategy. In most cases, it’s driven by emotion, not logic.
It usually shows up in two forms:
Trading out of boredom or the urge to “do something”
Trying to recover from previous losses (a.k.a. revenge trading)
Over time, this behavior becomes a habit — and like most bad habits in trading, it’s expensive.
⚠️ Signs You Might Be Overtrading
If you answer "yes" to any of these, it’s time to check your discipline:
Do you feel uncomfortable when you’re not in a trade?
Do you enter trades even when your system says “no trade”?
Do you keep switching charts hoping to “find a setup”?
After a losing trade, do you jump right back in to recover?
Have you lost more to fees/spread than actual price movement?
🧩 Why Indian Traders Often Fall Into Overtrading
🔹 The Action Bias
Traders often feel they must "do something" to be productive. In reality, sitting out is a strategy — especially when markets are flat or unclear.
🔹 Pressure to Perform Daily
Many traders in India try to generate consistent income from trading — and assume they must win every day. That pressure leads to forcing trades just to “hit targets.”
🔹 Overconfidence After a Winning Streak
Success leads to confidence — but too much confidence without structure leads to impulsive trading. One good day shouldn’t convince you that you’ve mastered the market.
🔥 Consequences of Overtrading
Overtrading doesn’t just hurt your account — it breaks your mindset.
Capital Depletion: Small losses + transaction costs = big drawdown over time
Mental Burnout: You feel drained, frustrated, and reactive
Lack of System Trust: You abandon good strategies because you never followed them properly
Emotional Instability: You start making decisions based on fear or revenge, not analysis
✅ How to Control Overtrading – Practical Steps
1. Limit the Number of Trades Per Day
Set a clear rule — e.g., “Maximum 3 trades per day.” This forces you to choose the best setups and ignore mediocre ones.
2. Keep a Simple Trading Journal
Write down:
Why you took the trade
Whether it matched your plan
Your emotional state
Reviewing this weekly will reveal patterns you never noticed in real time.
3. Block Out Non-Active Trading Hours
For Indian traders, this might mean avoiding low-volume periods like mid-Asia session. Focus on London or US overlap hours — when liquidity and volatility are high.
4. Understand: Not Trading Is Still Trading
Being flat (no position) is a strategic decision. Markets reward patience, not impatience.
🎯 Final Thoughts
Overtrading is not a technical issue — it’s a mindset issue.
When you feel the urge to “do something,” remind yourself: the best traders don’t trade all the time. They wait, they observe, and they only act when everything aligns.
"The market doesn’t pay you for activity — it pays you for accuracy."
If you want to grow consistently, you must master the art of waiting, filtering, and executing with purpose.
📌 Next in the Series:
TRADER PSYCHOLOGY | EPISODE 2: FOMO – How Fear of Missing Out Destroys Good Decisions
Follow this page to get notified when it drops!
Dip-buying in quality large-caps & sectorsDip-Buying in Quality Large-Caps & Sectors: A Simple Investor's Guide
One of the hottest topics in today’s stock market is dip-buying in quality large-cap stocks and sectors. If you’ve been following the market even casually, you’ve probably heard this term thrown around a lot. But what does it really mean? And more importantly, how can you use this strategy to your advantage in a way that’s smart and simple?
This guide breaks it down in plain English, so whether you're new to investing or have been in the game a while, you'll understand exactly how dip-buying works, why it's trending, and what sectors and stocks are currently worth your attention.
What Is Dip-Buying?
"Buying the dip" means purchasing stocks when their prices temporarily fall, with the belief that they will rise again. Think of it like a sale at your favorite store. The item (in this case, a stock) hasn’t lost its value; it’s just cheaper for now. Smart investors take advantage of these moments to buy strong companies at a discount.
But there's a catch. Not every dip is worth buying. That’s why it's important to focus on quality large-cap stocks and strong sectors — companies and industries that have a solid track record, strong financials, and the ability to bounce back from short-term declines.
Why Is Dip-Buying So Popular Right Now?
Market Volatility: Global markets are swinging more than usual due to geopolitical tensions, inflation, interest rate changes, and currency pressure. This creates more short-term dips.
Economic Stability: Despite the ups and downs, long-term economic fundamentals in countries like India are still positive. Sectors like banking, pharma, and FMCG are showing resilience.
Pro Investor Strategy: Top fund managers and seasoned investors often use dip-buying to accumulate high-quality stocks at better prices. Retail investors are now catching on to this technique.
Better Risk-Reward: When you buy during a dip, you increase your chances of getting higher returns when the stock rebounds, while minimizing downside risk (if chosen wisely).
What Makes a Stock "Quality"?
Not every large-cap stock is a safe bet. Here are key signs that a company is worth buying on dips:
Consistent Revenue and Profit Growth
Strong Brand Recognition (like HUL, TCS, Infosys)
Good Corporate Governance
Low to Moderate Debt
Regular Dividends
Presence in a Growing Industry
These are the kinds of stocks that recover quickly after market corrections.
Sectors Worth Watching for Dip-Buying
Let’s break down a few of the most popular sectors where investors are buying dips:
1. FMCG (Fast-Moving Consumer Goods)
These are companies that sell everyday products like soap, toothpaste, and food.
Why it's strong: Demand is stable even in bad times.
Examples: HUL (Hindustan Unilever), Nestle, Dabur, Britannia.
Strategy: Buy during quarterly results disappointment or short-term inflation impact.
2. Pharma & Healthcare
Why it's strong: Healthcare is essential; global export markets offer growth.
Examples: Sun Pharma, Dr. Reddy’s, Cipla, Glenmark.
Strategy: Buy on regulatory setback or global pressure — long-term story is still intact.
3. Private Banking & Financials
Why it's strong: Credit growth is picking up; digital transformation is boosting profits.
Examples: HDFC Bank, ICICI Bank, Kotak Mahindra Bank, Axis Bank.
Strategy: Accumulate on market-wide corrections or temporary bad loan fears.
4. IT & Tech
Why it's strong: Digital services, AI, and automation are booming worldwide.
Examples: TCS, Infosys, Wipro, HCL Tech.
Strategy: Buy during global slowdown fears or margin pressure.
5. Auto & EV-Related Stocks
Why it's strong: Strong demand post-COVID, and EV boom is real.
Examples: Maruti Suzuki, Tata Motors, M&M, Bajaj Auto.
Strategy: Use monthly sales dips or raw material price spikes to enter.
How to Actually Do Dip-Buying (Without Stress)
Make a Watchlist: Pick 10–15 quality large-cap stocks across sectors.
Use Alerts or Apps: Set price alerts so you know when a stock drops 5–10% from recent highs.
Check the News: Was the dip due to a real problem or just market mood swings?
Start Small: Don’t put all your money at once. Invest in chunks. That’s called SIP (Systematic Investment Plan) in stocks.
Stay Updated: Re-evaluate your picks every quarter. Replace weak stocks.
Hold with Patience: Dip-buying is not about overnight returns. Give your stocks 6–12 months at least.
Common Mistakes to Avoid
Buying Every Dip: Not every fall is a buying opportunity. Some companies have deeper problems.
Ignoring Fundamentals: Always check financial health.
Getting Greedy: Don’t try to time the exact bottom.
Panic Selling: If you’ve done your homework, trust your process.
Real Example (as of July 2025)
Let’s say HUL dropped from ₹2,800 to ₹2,580 after weak results. If you believe in the company’s long-term story, that 8% drop is a buying opportunity. Maybe you buy 20% of your planned quantity now, and wait to add more if it drops further to ₹2,450. If it rebounds, great — you already entered.
Another example: Glenmark Pharma recently jumped 14% due to a global licensing deal. It had dipped earlier due to export pressure. Those who bought during that dip are now sitting on solid gains.
Final Thoughts
Dip-buying in quality large-cap stocks isn’t just a smart strategy; it’s also a calm one. It helps you invest without chasing highs or making emotional decisions. It works best when you combine common sense, basic research, and patience.
Markets will always move up and down. But strong companies bounce back. If you can learn to spot those temporary drops in quality businesses, you can grow your wealth steadily and confidently.
Happy Investing!
Banknifty 1day time frame📊 Current Status (as of today)
Bank Nifty is trading around: ₹56,750 – ₹56,800
It's just below its all-time high, which is around ₹57,628.
The trend is still positive (bullish), but it’s taking a breather after a big rally.
🛡️ Strong Support Zones (Buy on Dip Areas)
These are the price areas where Bank Nifty may bounce back if it falls:
₹55,500 – ₹55,700 → Minor support
₹54,300 – ₹54,500 → Stronger support zone (good for long-term entry)
₹52,500 – ₹53,000 → Very strong base; ideal for adding long-term positions if market corrects
🚀 Resistance Levels (Where Price Might Struggle)
These are areas where it might face selling pressure:
₹57,000 – ₹57,200 → Near-term resistance
₹57,600 – ₹57,800 → All-time high zone
Above ₹58,000 → Fresh breakout, could fly to new levels if crossed with volume
✅ What You Can Do (If You’re a Long-Term Investor)
If you already hold: Stay invested. Trend is still up.
If you want to buy:
Wait for a dip to around ₹54,300–₹55,000 for a safer long-term entry.
Or, buy small now and add more on dips.
Breakout Strategy: If Bank Nifty closes above ₹57,800, it may start a new rally.
📌 Summary in One Line:
“Bank Nifty is near its highs — still bullish, but don’t chase. Buy dips around ₹54,500 or add more only if it breaks above ₹57,800.”

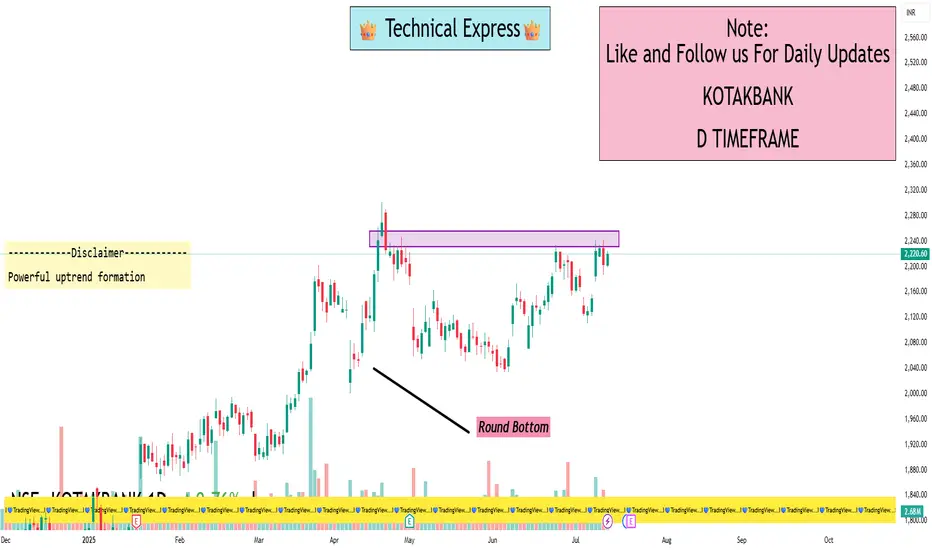
KOTAKBANKKotak Bank has been weak for a while but now it's trying to form a bottom. The stock is not yet in a strong uptrend, but it's showing early signs of a possible recovery.
Good Price to Invest
If you're looking to invest, a good range to start buying is around:
Here are the current daily price levels for Kotak Mahindra Bank (KOTAKBANK) on NSE:
Last traded price: ₹ 2,220.60, up
Today's range: ₹ 2,198.60 – ₹ 2,225.00
52‑week range: ₹ 1,679.05 – ₹ 2,301.90
Intraday Pivot Levels (Approximate)
According to Equity Pandit, today's pivot-based support and resistance likely fall at:
Immediate Supports:
• S1 ≈ ₹ 2,204
• S2 ≈ ₹ 2,188
• S3 ≈ ₹ 2,178
Resistances:
• R1 ≈ ₹ 2,231
• R2 ≈ ₹ 2,241
• R3 ≈ ₹ 2,257
Drilling deeper, a key intraday level is ₹ 2,184:
If the stock closes below ₹ 2,184, the short-term trend could weaken—potential signal to lighten downside risk.
As long as it stays above ₹ 2,184, the positive momentum may hold.
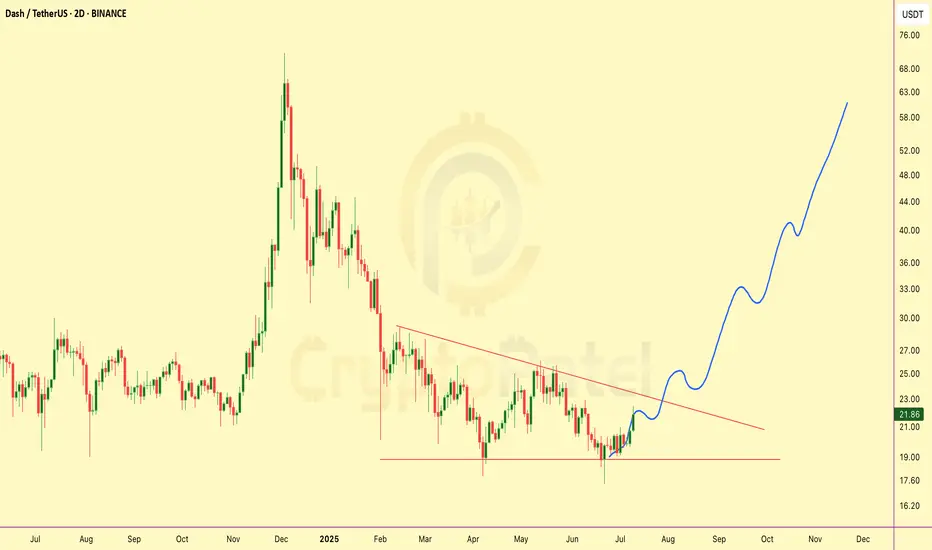
$DASH breakout loading… 100%+ upside in sight!NASDAQ:DASH breakout loading… 100%+ upside in sight!
Price swept liquidity and bounced strong. Now aiming for a major trendline breakout. If it clears, $50 → $60+ is on the cards.
Drop your target
Retweet if you see the setup
Note: NFA & DYOR
Swiggy: a probable long trade➡️Entered this with a stop loss of 374
➡️21 ema support
➡️Consumption theme has been picking up and I am hopeful that this scrip would be a beneficiary of the theme
➡️supply zone may act as a demand zone
➡️the volume on negative days have been meagre in comparison to the volume on positive days

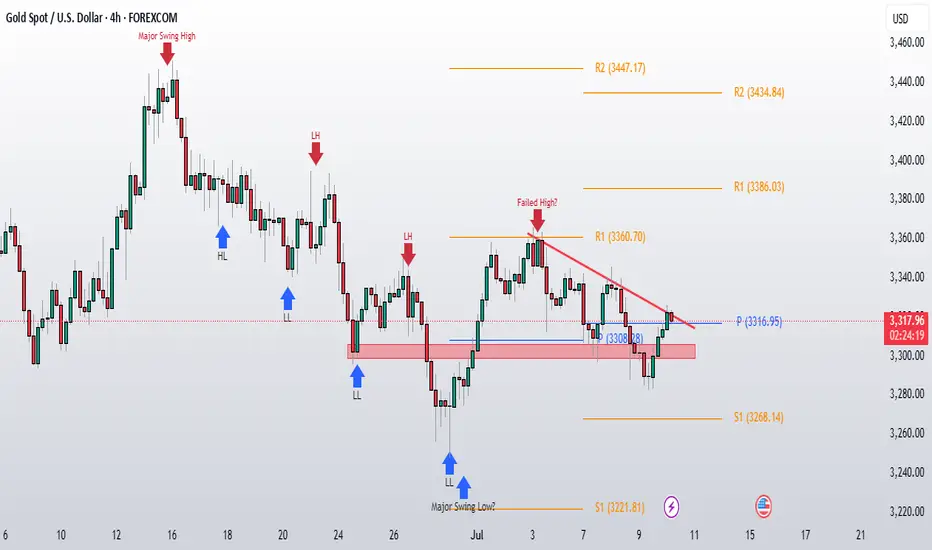
Gold Update - July 11th, 2025Gold is holding strong above 3300 on the daily close and today price breakout from the resistance trendline I mentioned yesterday. Also price is staying above the weekly pivot, which shows the bulls are getting more confident.
We're seeing some real momentum building up. The breakout from that trendline resistance is a good sign that buyers are ready to push higher.
Key Levels to Watch:
Upside Targets:
For intra day, watch 3340-45 as the next resistance area
For the bigger timeframe, we need to break and hold above 3355-60. That's the major level that will tell us if this is just a bounce or the start of something bigger.
Downside Support:
If things go wrong, the weekly pivot is our first support to watch
Also keep an eye on this week's low as backup support
Gold is finally picking a direction and it's pointing up. The breakout from the trendline gives us some confidence, but we're still in range on higher TF.
The real test will be if we can push through 3340-45 and then tackle that bigger 3355-60 area. If we can do that, then we might be back in business for the bulls.

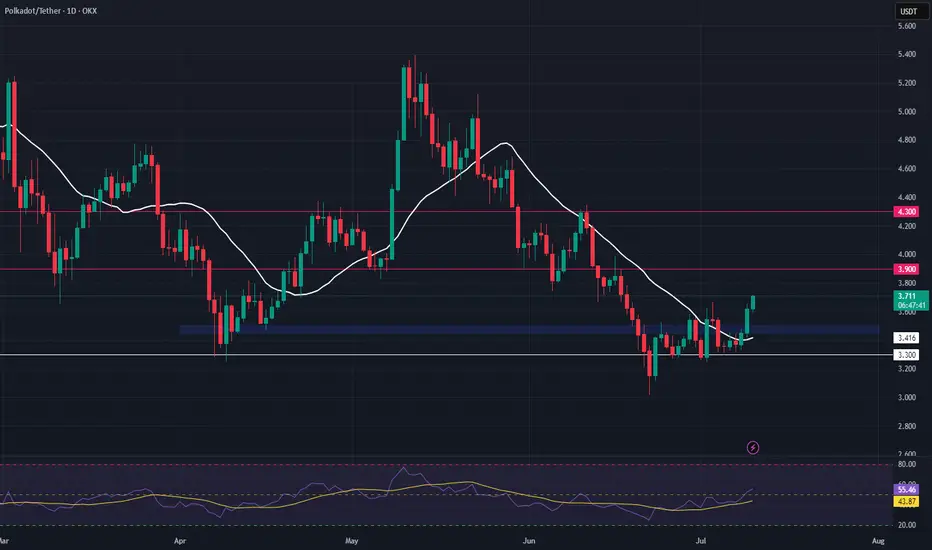
DOT Long Swing Setup – Structural Recovery with Support RetestDOT is showing early signs of recovery, reclaiming its 20-day SMA and flipping key horizontal resistance into support. We’re now watching for a retest of the $3.45–$3.50 zone to confirm the level and trigger a long entry.
📌 Trade Setup:
• Entry Zone: $3.45 – $3.50
• Take Profit Targets:
o 🥇 $3.90
o 🥈 $4.30
• Stop Loss: Daily candle close below $3.33
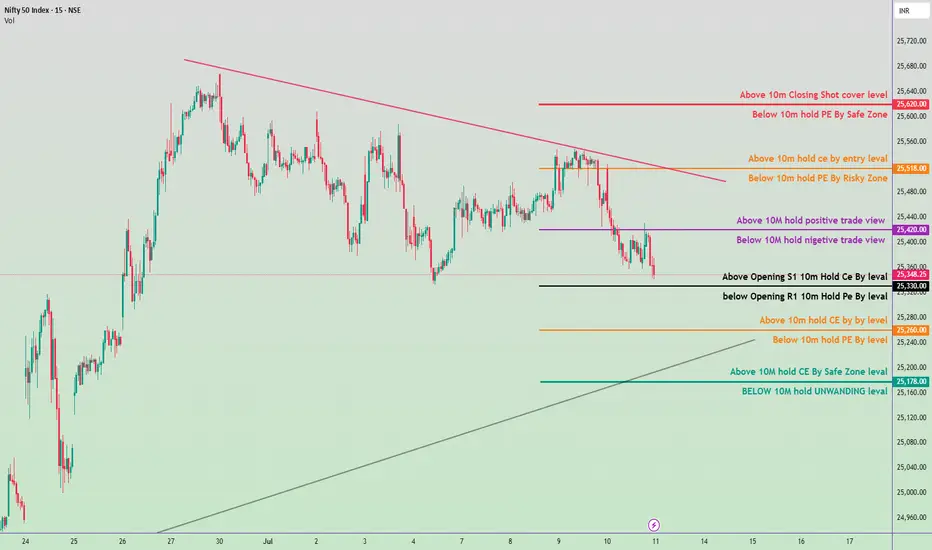
Nifty 50 Intraday Trade Plan 11 july 2025🔴 Resistance & Shorting Zones:
25,620.00
🔹 Above 10m Closing = Short Cover level
🔹 Below 10m = PE by Safe Zone
25,518.00
🔹 Above 10m = Hold CE by Entry level
🔹 Below 10m = PE by Risky Zone
25,420.00
🔹 Above 10m = Hold Positive Trade View
🔹 Below 10m = Negative Trade View
⚖️ Neutral / Opening Zone:
25,348.25 (CMP)
🔸 Above Opening S1 = Hold CE by Level
🔸 Below Opening R1 = Hold PE by Level
🟠 Intermediate Support/Resistance:
25,260.00
🔸 Above 10m = Hold CE by Level
🔸 Below 10m = Hold PE by Level
🟢 Support & Unwinding Zones:
25,178.00
🔹 Above 10m = CE by Safe Zone
🔹 Below 10m = Unwinding Level
📌 Summary:
A move above 25,420 may shift view to bullish/intraday CE hold.
Below 25,260 suggests weakness, possible PE play.
Major support at 25,178, breakdown below this might trigger heavy unwinding.
Gold’s Recent Movement and Market SentimentXAUUSD: Gold Bounces Strongly From the Bottom, Is This the Start of a New Uptrend?
🌍 Macro Overview – Gold’s Recent Movement and Market Sentiment
Gold recently experienced a strong bounce from the 3.282 USD/oz low, reaching up to 3.317 USD/oz. This move has sparked some optimism, but let’s take a look at the key macro factors that might be affecting gold:
📉 US bond yields have dropped, signaling that market risk aversion is starting to return
💵 The USD remains strong, but buying interest for gold in Asia is increasing, as confidence in fiat currencies begins to wane
🇪🇺 The EU is pushing ahead with negotiations with the US on tariffs before the August 1st deadline. If these talks break down, gold could benefit significantly
🏦 The Fed is maintaining interest rates, but the market is betting that cuts could come in September if inflation remains under control
📊 US unemployment data and the Fed’s speech tonight will be key, with the market waiting anxiously for clues on the Fed’s next move
📊 Technical Analysis – Gold Approaching Key Resistance Zones
Gold is trading within a descending channel, but signs of a breakout are emerging after a solid test of the bottom.
Key resistance levels are around 3330 – 3340, and these will be crucial in determining whether gold can continue its upward momentum.
Fair Value Gap (FVG) has appeared between 3310 – 3320, which suggests that if buying pressure remains, a breakout could be on the horizon.
🎯 Trading Strategy for Today – Focused on Clear Entry Points
🟢 BUY SCALP:
Entry: 3310 – 3308
SL: 3304
TP: 3314 → 3318 → 3322 → 3326 → 3330
🔵 BUY ZONE (safer entry points):
Entry: 3290 – 3288
SL: 3284
TP: 3294 → 3298 → 3302 → 3306 → 3310 → 3320 → 3330
🔴 SELL SCALP (if price hits resistance levels):
Entry: 3335 – 3337
SL: 3342
TP: 3330 → 3325 → 3320 → 3315 → 3310 → 3300
⚫ SELL ZONE (strong resistance at 3360-3362):
Entry: 3360 – 3362
SL: 3366
TP: 3356 → 3352 → 3348 → 3344 → 3340 → 3336 → 3330
📌 Note:
Always place SL and TP to protect your account, especially in a market that may experience significant volatility.
Monitor the volume from London and New York sessions for clearer market direction. A strong breakout above resistance could signal the start of a new uptrend.
💬 Gold has bounced strongly, but is this the start of a larger rally, or just a brief pullback? What do you think about today’s potential trend? Share your thoughts in the comments below!

Gold Update - July 10th, 2025Yesterday we have seen breakdown below Monday's low , but bulls again stepped in at the lower levels and pushed gold back above 3300 by the daily close. This was actually a really encouraging sign that buyers are still willing to defend this level.Things are looking a bit better now. Gold is trading above the weekly pivot, which is a positive shift from yesterday's weakness.
What's in the way:
The immediate challenge is that dynamic trendline you can see on the chart
Bulls need to break through this first ....
After that, the next big test is around 3340 this is a high volume area where we've seen plenty of action before.
old is basically stuck in a range between 3280-85 on the bottom and 3335-40 on the top. Right now, there's no clear direction.
We need a decisive break from this range. Until then, we're just watching price bounce between these levels without any real commitment from either buyers or sellers.
$ETH IS FLIRTING WITH A MASSIVE BREAKOUTCRYPTOCAP:ETH IS FLIRTING WITH A MASSIVE BREAKOUT
Price is hovering just below the HIGH LIQUIDITY ZONE at $2,867 — a major inflection point!
✅ Break above… We could see a parabolic push toward ATHs.
❌ Rejection = A sharp correction might hit hard.
It’s make or break time for Ethereum.
What’s your plan if this breaks?
NFA & DYOR

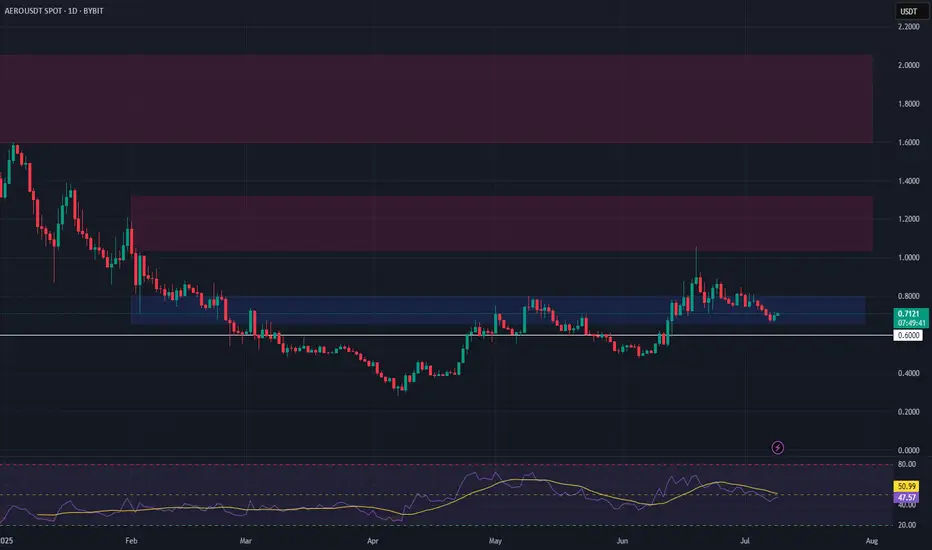
AERO Long Swing Setup – Retest of Range Low SupportAERO has pulled back to test the bottom of its range, now sitting at a key support zone. This offers a potential long swing entry as buyers look to defend the $0.66–$0.80 area.
📌 Trade Setup:
• Entry Zone: $0.66 – $0.80
• Take Profit Targets:
o 🥇 $1.04 – $1.32
o 🥈 $1.60 – $2.05
• Stop Loss: Daily close below $0.60
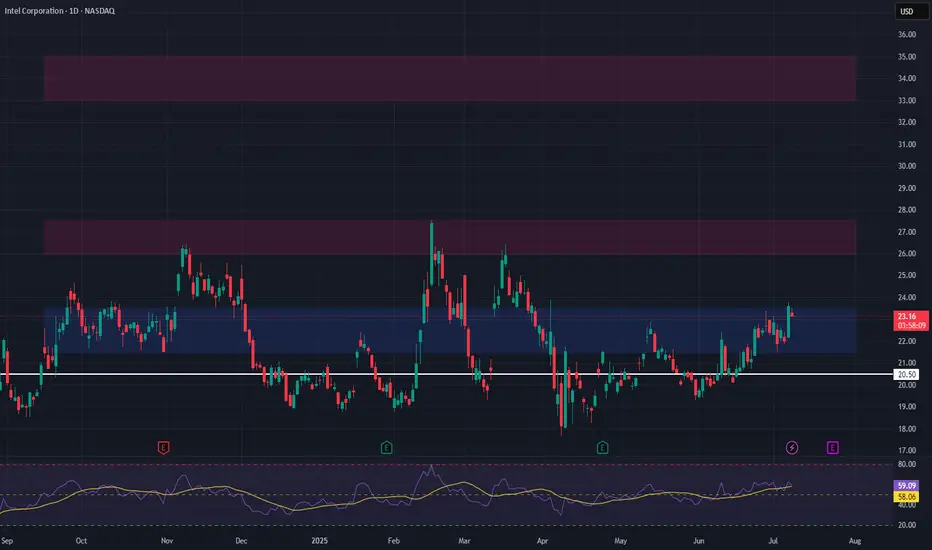
INTC Long Swing Setup – Break & Retest of Key ResistanceWe’re watching Intel NASDAQ:INTC for a clean break and retest of the $23.50 resistance level. A confirmed flip of this zone into support would signal trend strength and trigger a long spot entry.
📌 Trade Setup:
• Entry Zone: Around $23.50 (after confirmation as support)
• Take Profit Targets:
o 🥇 $26.00 – $27.50
o 🥈 $33.00 – $35.00
• Stop Loss: Daily close below $22.50
Shukra Pharmaceuticals Ltd – Long Bias Trade SetupShukra Pharmaceuticals is currently showing signs of bullish intent after breaking out of a well-defined consolidation range. The stock formed a series of higher lows, indicating accumulating buying pressure, and recently broke above a key resistance level with strong momentum.
The breakout candle was large and decisive, closing near its high, which signals confidence among buyers. Following the breakout, price has started to establish a new base just above the previous resistance — now acting as support — a classic sign of strength and trend continuation.
Volume during the breakout session was notably higher than recent averages, reinforcing the conviction behind the move. Any shallow pullbacks toward the breakout zone or previous consolidation highs can provide low-risk buying opportunities.
If the current structure continues, the next leg higher may test prior supply zones or unfilled gaps visible on the left side of the chart.

Amara Raja Energy & Mobility Ltd. LongAmara Raja Energy & Mobility Ltd. is currently presenting a strong long trade opportunity, supported by a blend of bullish technical signals and long-term structural tailwinds in the EV and energy storage sectors.
Breakout Confirmation: The stock has recently broken out of a descending trendline that held since early 2024, on the back of above-average volume, signaling institutional interest.
Bullish Structure: A clean higher high, higher low formation is emerging on the Daily timeframe, indicating the early stages of a potential uptrend.
Support Zone: Price is retesting the key demand zone around ₹800–₹820, which acted as a major support-resistance flip level in the past.
Moving Averages:
21 EMA and 50 EMA have crossed bullishly with price holding above both, suggesting short- to medium-term strength.
200 EMA is flat-to-rising, showing long-term strength isn’t compromised.
MACD is turning upward with a fresh bullish crossover near the zero line — a sign of early momentum return.
RSI is comfortably above 55 but not overbought (~60–65), confirming room for upside without exhaustion.

Is a Pullback Coming or Will the Bulls Continue?Gold Faces Resistance at 3300 – Is a Pullback Coming or Will the Bulls Continue?
Market Overview: USD Gains Pressure Gold as Trade Deals Unfold
Gold has been under pressure recently due to the strong recovery of the US dollar. Positive developments in global trade talks and agreements between major nations, including the US, have been a key driver for the USD, which in turn has weighed on gold.
US inflation data continues to show signs of easing, providing the Fed more room to hold off on rate hikes, strengthening the USD.
FOMC meeting minutes due this week will provide further insight into the Fed’s approach to interest rates.
With geopolitical tensions easing and trade deals stabilizing, the demand for safe-haven assets like gold is slightly reduced.
In the short-term, the market is testing crucial levels, and while gold remains bullish in the long run, the current market conditions suggest potential for a pullback before further upside.
Technical Analysis: Gold in a Range-Bound Market
Looking at the H1 timeframe, gold has formed a clear downward channel between 3360 and 3290, which could signal further corrective action if the price remains within this range. If gold fails to break above resistance at 3360, a dip to 3250 might occur, especially if the USD strength continues to put pressure on gold.
However, waiting for confirmation patterns before entering a trade is key. False breakouts can be a risk when price moves quickly through key levels without sustaining momentum.
Buy Bias in Short-Term with Caution on Bearish Moves
Given the current market structure, there is more room for buy opportunities than for selling at the moment. Watch out for a potential bounce back in the 3320-3325 region as gold might test these levels before continuing its rise. The rejection wick on yesterday's D1 candle shows that the sellers are losing control, and buying pressure is starting to build again.
In the M30 chart, there's a continuation pattern forming around the 16-14 zone, which could be an ideal place to enter a buy position if it holds.
Resistance and Support Levels:
Key Resistance Levels: 3302 – 3310 – 3324 – 3335 – 3361
Key Support Levels: 3275 – 3259 – 3248
Trading Strategy – Buy and Sell Zones
BUY ZONE:
3250 – 3248
Stop Loss: 3244
Take Profit: 3254 → 3258 → 3262 → 3266 → 3270 → 3280 → ????
SELL SCALP:
3303 – 3305
Stop Loss: 3310
Take Profit: 3298 → 3294 → 3290 → 3286 → 3280 → 3270 → 3260
SELL ZONE:
3334 – 3336
Stop Loss: 3340
Take Profit: 3330 → 3326 → 3320 → 3315 → 3310 → 3305 → 3300 → ????
Key Updates to Watch: FOMC and Trade Policy News
With FOMC minutes due and trade policy developments on the horizon, it’s crucial to stay alert for any shifts in market sentiment. Ensure you stick to TP/SL levels to protect your account from any unexpected volatility.
