BTC Decision Point – Are You Watching This?BTC Decision Point – Are You Watching This?
Bitcoin is reclaiming momentum after sweeping liquidity at $102.7K. It's now pushing toward major resistance at $106.1K.
But the real battle? The bearish OB at $107.2K–$108.9K — where price nuked last time.
✅ Break above = clear skies toward new ATHs
❌ Rejection = another trip to $102K or even Under $100K
🔁 Retweet if this helped
💬 Drop your bias below: Long or short?👇
Trading

BTC Near $100K – Breakdown or Bounce?BTC Near $100K – Breakdown or Bounce?
BTCUSD – Will Bitcoin Hold ₹100K Support Equivalent? Signs of Weakness Amid Global Caution
🧭 Global Market Context
Bitcoin is facing some serious resistance after failing to hold above the $108K zone. And just as Indian markets react to global cues, BTC is showing signs of stress too.
🔺 US bond yields are climbing again – bad news for crypto risk appetite
🧊 Spot Bitcoin ETFs continue to attract inflows, but not strong enough to push new highs
💵 The US Dollar (DXY) is gaining strength again as investors flee risk — and that puts pressure on Bitcoin
Add to that the recent institutional sell-off, and it’s clear: BTC may need to “cool off” before another rally.
📉 Technical Picture (1H)
Bitcoin is showing a classic lower-high, lower-low pattern. A clear downtrend is in motion:
Price is below all key EMAs (34/89/200), with every rally being sold off
Important resistance sits at 106,000 – 107,000
Major support levels are now at 102,821, then 101,539, and if pressure continues — 100,419 (₹83+ lakh level for reference)
Momentum indicators like RSI are flat. No strength yet. And without a solid bullish candle from support, buyers may stay away.
🔎 Strategy Plan for Indian Traders
🔻 Short-term SELL Setup
Entry: 106,000 – 107,000
SL: 107,500
Targets: 102,821 → 101,539 → 100,419
🧠 Ideal for short-term traders looking to follow the trend
🔹 Medium-term BUY Setup (only if price reacts from 100K zone)
Entry: 100,500 – 100,800
SL: 99,800
Targets: 102,800 → 104,400 → 106,000
⚠️ Wait for bullish confirmation — avoid bottom fishing blindly
📌 Final Thought
Bitcoin is in a danger zone right now. If it loses grip on $100K support, we may see panic selling from leveraged traders. But this zone also holds opportunity — a strong bounce could spark a fresh rally.
🧘 Trade with patience. Don't chase. Let the market come to you.

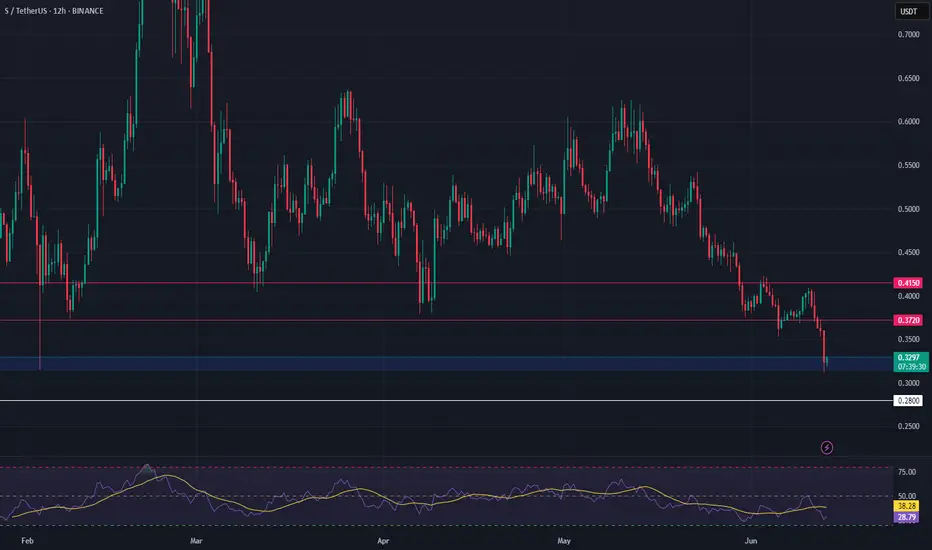
S Long Swing Setup – Retest of February Lows at Key SupportS is pulling back and now approaching a critical support zone, testing the February 2025 lows near $0.31. This area marks a key level for potential accumulation, offering a favorable long setup.
📌 Trade Setup:
• Entry Zone: $0.315 – $0.330
• Take Profit Targets:
o 🥇 $0.372
o 🥈 $0.415
• Stop Loss: Daily close below $0.280
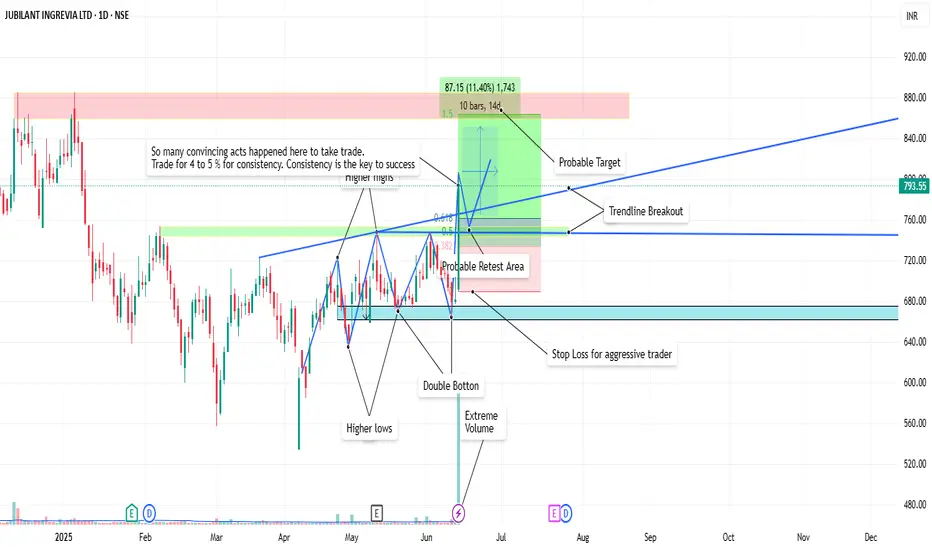
JUBLINGREA Breakout📊 1. Price Action & Pattern Analysis
Breakout Trigger:
Double Bottom at ₹660–₹670 confirmed.
Higher Lows and Higher Highs are clearly visible — a bullish trend structure.
Breakout from trendline resistance with a strong bullish candle on extreme volume confirms buyer interest.
Probable Retest Zone: Around ₹745–₹760, which overlaps with the 38.2–61.8% Fibonacci zone, indicating a good low-risk reentry area if price retests.
Stop-Loss (Aggressive): Just below ₹680 support zone (prior bottom and neckline).
🔍 2. Volume & Confirmation
Massive Volume Spike on breakout day — highest in recent months.
Volume confirms genuine buying pressure, validating the pattern breakout.
🧭 3. Stage Classification
✅ Current Stage: Stage 2 – Markup Phase (Early Stage)
Why:
Breakout from long consolidation.
Volume confirms institutional activity.
Trend structure shifting to higher highs/lows.
Strong retest and breakout of previous resistance zones.
🎯 4. Trade Plan Summary
Metric Value
📌 Entry Range ₹760–₹780 (retest possible)
🧯 Stop Loss (Aggressive) ₹675–₹680 zone
📈 Target 1 (Short-Term) ₹840–₹860 (as shown)
📈 Target 2 (Positional) ₹900+
🔎 Risk–Reward 1:2.5+ (Ideal Swing Setup)
🧠 “So many convincing acts happened here to take trade... Trade for 4 to 5% for consistency.”
✅ Conclusion
This is a classic Stage 2 early breakout with:
Multi-confirmation setup (pattern + trendline + volume)
Well-defined risk-reward
Excellent for swing-to-positional trades
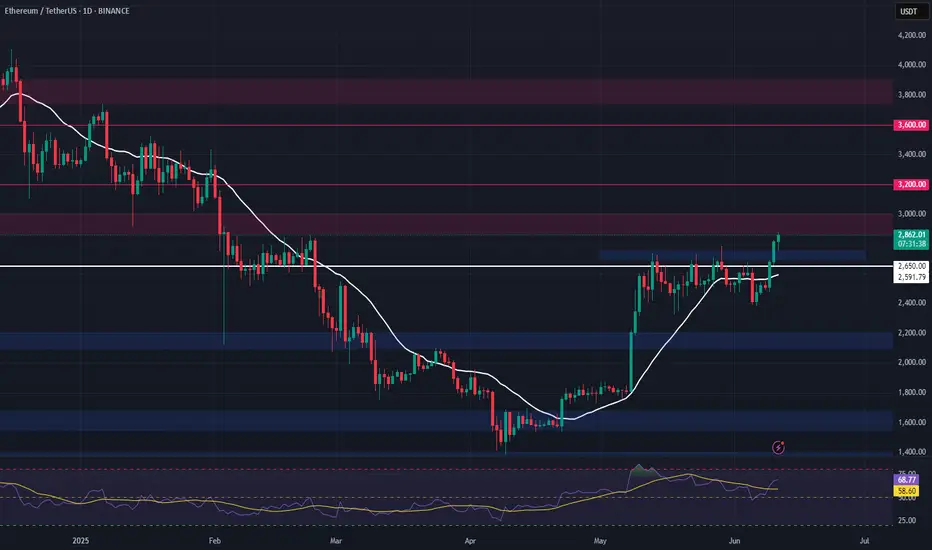
$ETH BLOODBATH: -15% Dump! Next Stop $2100? CRYPTOCAP:ETH BLOODBATH: -15% Dump! Next Stop $2100?
I shorted right from $2862 — nailed the move.
Now trading below critical $2550 support.
👉 Hold $2550? Reversal towards $3000-$4000 possible.
👉 Lose it? We likely fill $2100-$2200 FVG — 0.618 fib at $2116.
$2860 remains THE level to watch for a New ATH.
💬 Comment your ETH target!
🔁 Retweet if this helps your gameplan.

Gold Surges Amid Middle East TensionsXAUUSD – Gold Surges Amid Middle East Tensions | What’s Next After 3430 Break?
🌍 Macro & Geopolitical Overview
Gold prices accelerated sharply in the Asian session on June 13 after Israel launched a large-scale airstrike campaign against Iran, targeting nuclear facilities including the Natanz uranium enrichment site.
Israeli Prime Minister Netanyahu declared the mission would continue until the Iranian nuclear threat is “completely neutralized.”
Iran suffered major losses and scrambled its air force to prepare for retaliation.
WTI oil jumped over 8%, gold spiked to $3,430/oz, and US equities dropped sharply.
While the US claimed it would not participate directly in the attack, it vowed to defend its forces in the region if threatened.
This rapidly escalating geopolitical conflict has triggered a renewed flight into safe-haven assets, with gold leading the pack.
📉 Technical Outlook – M30 / H1 Chart
🔹 Trend Structure
Gold has broken out decisively above 3,392, forming a strong bullish leg and carving new short-term support around 3,412 – 3,426.
Price action is forming a Higher High – Higher Low structure within a rising channel.
🔹 Fair Value Gap (FVG)
A visible FVG between 3,405 – 3,412 has formed. As long as price holds above this zone, bullish continuation is favored.
🔹 EMA Structure
Price is well above all key EMAs (13, 34, 89, 200), confirming a strong bullish environment. EMA13 continues to guide intraday momentum.
🔹 Key Resistance Zone
Watch for potential distribution or profit-taking around 3,441 – 3,456 – a major resistance area if no further escalation occurs.
🧠 Market Sentiment & Behavior
Investor sentiment has shifted firmly into risk-off mode.
Funds are flowing heavily into gold, oil, CHF, and JPY.
Price volatility is likely to spike further, as headlines continue to drive intraday sentiment.
🎯 Updated Trade Setup – 13 June
🔵 BUY ZONE: 3384 – 3382
Stop-Loss: 3378
Take-Profit: 3388 → 3392 → 3396 → 3400 → 3405 → 3410
🔴 SELL ZONE: 3454 – 3456
Stop-Loss: 3460
Take-Profit: 3450 → 3446 → 3442 → 3438 → 3434 → 3430
✅ Conclusion
The renewed conflict between Israel and Iran is fueling gold’s rise as global risk appetite collapses. Technically, the trend remains bullish, but volatility is extremely elevated. Traders should watch key price zones closely and avoid emotional trades during event-driven spikes.
⚠️ Trade the reaction, not the prediction. Let key levels confirm bias before entering.

BITCOIN ANALYSIS UPDATE — READ THIS CAREFULLY!🚨 BITCOIN ANALYSIS UPDATE — READ THIS CAREFULLY! 🚨
Hope you followed our last BTC analysis — and DID NOT open any longs at the top.
If you followed: Congrats — you either made big profits on the short, or at least saved your money by not longing.
✅ We clearly warned when BTC was around $110K — more correction was coming.
Result? Bitcoin is now 7% DOWN since that call.
❗ Now the situation is DANGEROUS:
👉 BTC broke my Bullish Order Flow at $105K.
👉 If this $105K support doesn’t hold soon → we may see a deep correction towards $90K.
$105K is the level to watch like a hawk.
👉 Iran-Israel news just accelerated the fall — but we already predicted this move before the news.
🚫 NEVER gamble with your hard-earned money.
✅ Always wait for solid confirmation before entering trades.
👉 Stay smart. Stay safe. Stay patient.
💬 Comment your thoughts below.
🔁 Forward this to your crypto friends — they NEED to see this!
BITCOIN ANALYSIS UPDATE — READ THIS CAREFULLY! BITCOIN ANALYSIS UPDATE — READ THIS CAREFULLY!
Hope you followed our last BTC analysis — and DID NOT open any longs at the top.
If you followed: Congrats — you either made big profits on the short, or at least saved your money by not longing.
We clearly warned when BTC was around $110K — more correction was coming.
Result? Bitcoin is now 7% DOWN since that call.
Now the situation is DANGEROUS:
👉 BTC broke my Bullish Order Flow at $105K.
👉 If this $105K support doesn’t hold soon → we may see a deep correction towards $90K.
$105K is the level to watch like a hawk.
Iran-Israel news just accelerated the fall — but we already predicted this move before the news.
🚫 NEVER gamble with your hard-earned money.
✅ Always wait for solid confirmation before entering trades.
Stay smart. Stay safe. Stay patient.
Comment your thoughts below.
Forward this to your crypto friends — they NEED to see this!

XAUUSD – CPI Data Pushes Gold HigherXAUUSD – CPI Data Pushes Gold Higher | Should You Follow the Trend or Sell the Top?
Gold prices surged strongly after the US CPI report came in lower than expected. This triggered a sharp drop in the US Dollar and yields, while boosting demand for safe-haven assets. The question now: Is this the beginning of a new leg higher, or a setup for a short-term correction?
🌐 MACRO & MARKET SENTIMENT
📰 US CPI (May): Increased only 0.1% MoM and 2.4% YoY vs. forecast of 2.5%.
➤ This softer inflation reading reignited expectations that the Fed may cut rates as early as September.
📉 USD Weakness: The Dollar Index (DXY) dropped ~0.4%, making gold cheaper and more attractive for global investors.
📉 Bond Yields Falling: US 10Y yields declined, further increasing the appeal of gold as a non-yielding safe asset.
💡 Market Psychology: Traders are rotating capital back into gold ahead of FOMC and geopolitical uncertainties (China, Middle East).
📈 TECHNICAL OUTLOOK – H1 & H4 STRUCTURE
🔹 Trend Structure
Gold remains in a Higher High – Higher Low formation since the 3,312 level. Price recently broke above the 3,360–3,374 resistance and is now consolidating around 3,375 — a possible accumulation before breakout.
🔹 Price Channel
Gold is respecting an ascending channel with the lower bound aligning with the key support area at 3,339 – 3,345. As long as this zone holds, bulls are in control.
🔹 EMA Indicators
EMA13 / EMA34: Price is comfortably above both — indicating strong short-term momentum.
EMA89 / EMA200: Both EMAs are well below price action, confirming a medium-term bullish trend.
🔹 Caution Zone
Resistance at 3,392 – 3,395 is a key area to watch for reversal patterns (Pin Bars, Bearish Engulfing, etc.)
If price pulls back to 3,339 – 3,345 and holds, it can offer high-probability long entries with trend continuation.
🎯 TRADE SETUPS
🔵 BUY ZONE: 3324 – 3322
Stop-Loss: 3318
Take-Profit Targets: 3330, 3334, 3338, 3342, 3346, 3350
🔵 BUY SCALP: 3337 – 3335
Stop-Loss: 3330
Take-Profit Targets: 3341, 3345, 3350, 3354, 3360, 3370, 3380
🔴 SELL ZONE: 3392 – 3394
Stop-Loss: 3398
Take-Profit Targets: 3388, 3384, 3380, 3375, 3370, 3360, 3350
🧠 CONCLUSION
The lower-than-expected CPI has given gold a short-term macro boost, and technically, bulls remain in control. However, caution is needed near the 3,392 zone — where price could face strong supply and trigger a pullback.
✅ Trade with confirmation, not assumptions. Let the price action guide your next move.

Gold Holds Breath for CPI – Decisive Catalyst or Price Trap?XAUUSD: Gold Holds Breath for CPI – Decisive Catalyst or Price Trap?
🌍 Macro Landscape: Gold Awaits CPI, Real Interest Rate Pressure
The Gold market (XAUUSD) is in a highly sensitive phase as investors hold their breath for the upcoming U.S. Consumer Price Index (CPI) report during the U.S. session. CPI is the most crucial inflation gauge, and any deviation from expectations can trigger significant market shocks, especially for safe-haven assets like gold.
In this context, real interest rates are playing a pivotal role. If inflation cools faster than anticipated (lower CPI), pressure on the Federal Reserve (Fed) to cut interest rates will increase, leading to a drop in bond yields and making gold more attractive. Conversely, if inflation remains "sticky" (higher CPI), the Fed may maintain a "higher-for-longer" policy stance, pushing bond yields up and putting downward pressure on gold due to the increased opportunity cost of holding the non-yielding asset.
🏦 Central Bank Policy Divergence: Fed's Caution, BoJ's Waiting Game
Federal Reserve (Fed): FOMC members continue to signal patience with rate cuts. Recent inflation data shows persistent price pressures, particularly in the services sector, reinforcing the Fed's hawkish bias. This creates pressure on gold if the USD continues to strengthen due to higher interest rates.
Bank of Japan (BoJ): (While not directly related to XAUUSD, global policy divergence still impacts capital flows and sentiment. For Gold, our focus is primarily on the Fed and other major central banks.)
The divergence in global monetary policies, especially between the Fed and other major central banks, is creating a volatile environment for the gold market.
🌐 Capital Flows: Gold & USD – The Safe-Haven Race Amid Instability
Global capital flow models suggest that the USD and Gold are currently the two most sought-after safe-haven assets amidst geopolitical tensions (such as US-China tensions) and EU fiscal risks.
If the upcoming CPI data surprises the market, it could trigger significant capital flows between the USD (a yielding asset) and gold (a non-yielding asset). A lower-than-expected CPI could boost inflows into gold, while a higher CPI could reinforce USD strength and push gold prices lower.
📊 Technical Structure (M30 Chart): Gold in Decision Zone
On the M30 chart for XAUUSD:
Primary Trend: Gold prices are currently in a consolidation or slight correction phase, accumulating before the CPI news. The EMA 13 - 34 - 89 - 200 indicators present a mixed picture, with the price oscillating around the short-term MAs, while the longer-term MA (EMA 200) still acts as dynamic support/resistance. A "fan-out formation" or MA crossovers will be crucial signals confirming the next trend direction.
Crucial Resistance Zone (SELL Zone): Around 3374 - 3376. This is a strong resistance area where the price has reacted or has the potential to reverse. If the price rallies and approaches this zone before or after the CPI news without breaking through, it presents a potential selling opportunity.
Crucial Support Zone (BUY ZONE): Around 3314 - 3312. This is a strong support area where the price may find significant buying pressure to bounce. If the price corrects to this zone and shows bullish reversal signals (e.g., hammer candle, bullish engulfing), it presents a potential buying opportunity.
🎯 Trade Strategy Recommendations
Scenario 1 – BUY (Await reaction at support):
Entry: 3314 - 3312 (Wait for bullish reversal candle confirmation or strong buying pressure in this zone).
Stop-Loss: 3308 (Just below the support zone for capital protection).
Take-Profit:
TP1: 3318
TP2: 3322
TP3: 3326
TP4: 3330
TP5: 3335
TP6: 3340
Scenario 2 – SELL (Await reaction at resistance):
Entry: 3374 - 3376 (Wait for bearish reversal candle confirmation or strong selling pressure in this zone).
Stop-Loss: 3380 (Just above the resistance zone for capital protection).
Take-Profit:
TP1: 3370
TP2: 3366
TP3: 3362
TP4: 3358
TP5: 3352
TP6: 3348
TP7: 3340
⚠️ Key Events to Watch:
U.S. CPI Report (U.S. session): This is the most critical event, which will dictate gold's primary direction in the short term. Be prepared for strong volatility upon its release.
Any statements from Fed members: Comments on inflation or monetary policy can impact market sentiment.

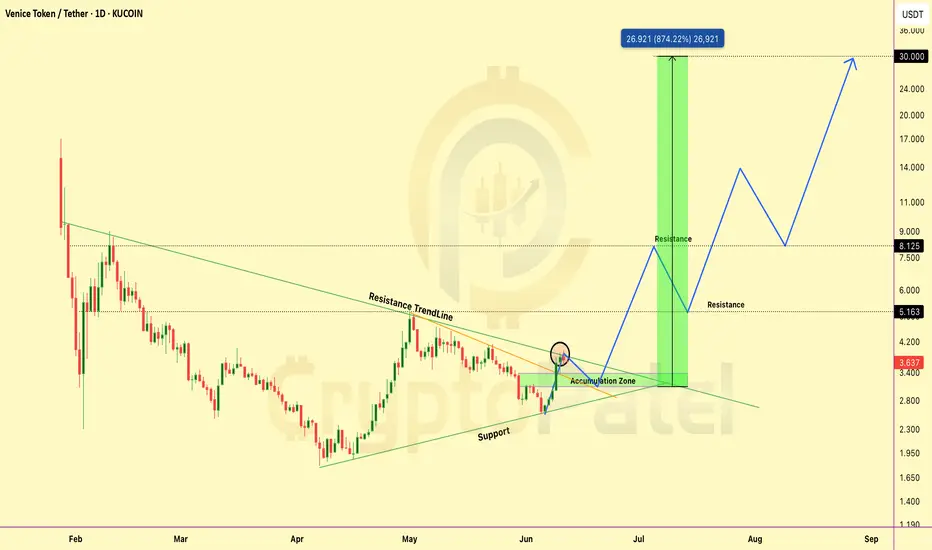
Is VVV The Next 10x RWA Play? Breakout + Strong Fundamentals!VVV is starting to show one of the strongest setups on my radar right now.
Here’s why this could turn into a major long-term bullish play 👇
Technical Picture:
✅ Broke LTF (lower time frame) resistance trendline
✅ Now attempting to break HTF (higher time frame) resistance trendline
✅ Accumulation Zone: $3.40–$3
✅ Strong Support: ~$2.70
👉 If HTF breakout confirms → serious upside could follow.
My Long-Term Targets:
$5 → $10 → $20 → $30 🚀
Why VVV Is Bullish Fundamentally:
✅ Real-world utility → tokenized luxury + travel ecosystem
✅ Strong partnerships → hotels, luxury brands, travel services
✅ Scarce supply + clear token utility (staking, discounts, access)
✅ Aligns with major Web3 + AI + RWA narratives → a trend driving this cycle
✅ Still low market cap → high asymmetry → early opportunity
Summary:
👉 If HTF breakout confirms, this could easily become one of the top runners this year.
👉 Narrative + chart + fundamentals are all lining up perfectly.
🎯 Strategy: Accumulate within the zone, watch for breakout confirmation → hold for long-term targets.
👉 Keep this one on your radar.
Note: NFA & DYOR
PTCIL – Breakout From Long-Term Consolidation ZonePTCIL is showing strong signs of a bullish breakout, with price holding steadily above key moving averages and positive trend indicators. Institutional accumulation appears to be behind this move, and a close above resistance could see significant upside.
There is a high chances for upcoming move in bullish side

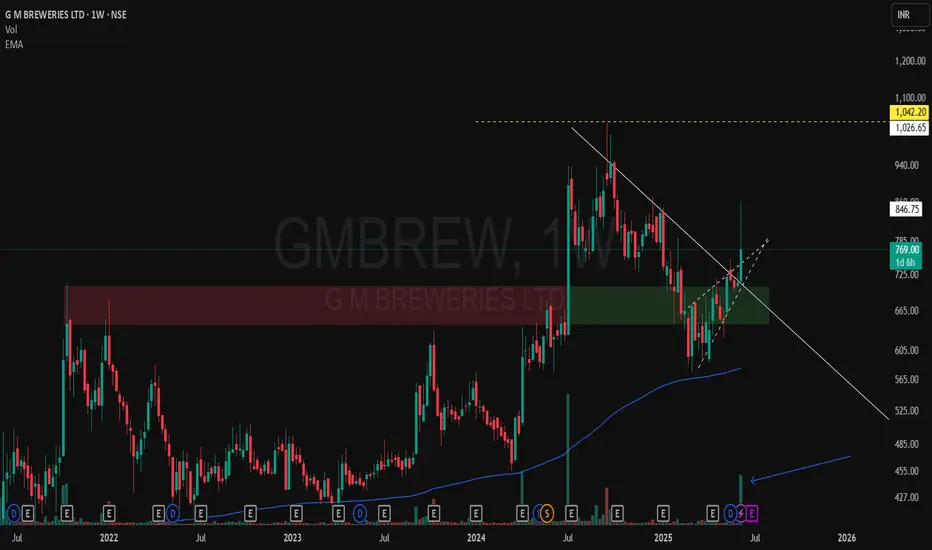
GM BREWERIES – A Classic CT Breakout with Strong Demand Flip🔍 A solid Weekly Time Frame (WTF) structure is visible here on GMBREW:
-The red-green zone highlights a classic supply turning into demand, supporting the structure.
-A clear Counter Trendline (CT) breakout (white line) is now visible, showing strength with increasing momentum.
-Notice the strong spike in volume – this breakout isn't silent. Participation has significantly picked up.
-Yellow line represents the MTF supply, which could act as the next area of interest.
-Price is currently showing a wick, so weekly closing behavior will be key from here.
-No predictions – just a technical snapshot. Structure, volume, and zones are aligning well here. Let’s see how it unfolds. 📊
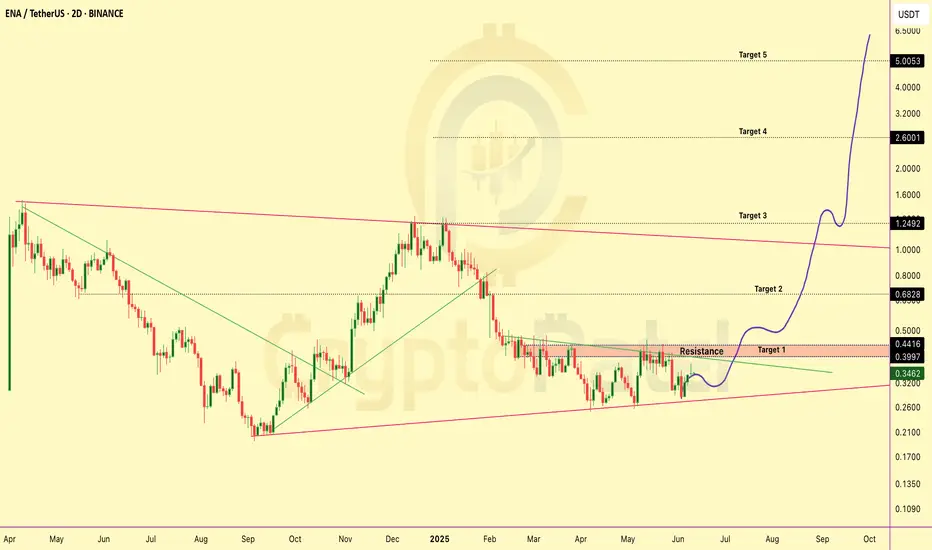
ENA/USDT Chart Analysis — Is It the Right Time To Accumulate?ENA/USDT Chart Analysis — Is It the Right Time To Accumulate?
MIL:ENA is still trading nearly -77% below its all-time high (ATH) of $1.52, currently hovering around $0.34.
Right now, the price is sitting above a strong support zone near $0.27, making the current range of $0.34–$0.30 an attractive accumulation zone — especially for long-term investors.
Short & Long-Term Targets:
Short-Term Targets: $0.44 → $0.68 → $1.25
Long-Term Potential: $2.60 → $5+
Key Levels To Watch:
Major Resistance: $0.45 — a breakout above this level could pave the way toward the $1 zone.
Strong Support: $0.27 — holding this level is critical to maintain bullish momentum.
Risk Note: As always, this is the crypto market — highly volatile and inherently risky. Please do your own research and manage risk wisely. This is NOT financial advice.
👉 Will ENA deliver another big leg up? Let us know your thoughts!
Note: NFA & DYOR
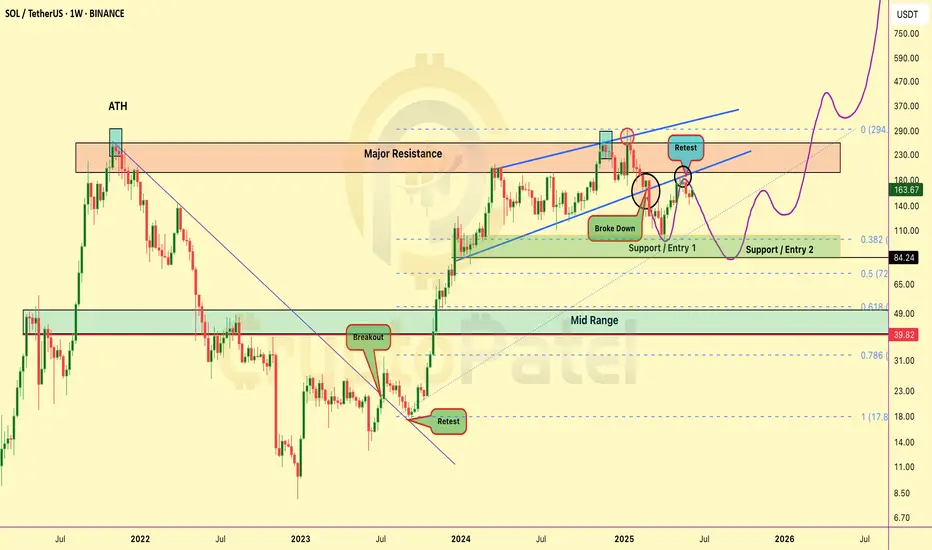
Is $SOL about to DUMP… or set up a MASSIVE BUY ZONE?Is CRYPTOCAP:SOL about to DUMP… or set up a MASSIVE BUY ZONE?
Solana is now at a critical level on the higher timeframe chart:
✅ After a breakdown, SOL is now retesting the bearish retest zone
✅ Strong resistance seen at $170–$180
✅ If rejected → price could dip toward the $100 range
But here’s the key: A dip to $100 would be a massive long-term buying opportunity for many investors (including me).
Long-term targets? I’m still eyeing $500 → $1000 if the macro trend plays out.
👉 Keep a close eye — the next few weeks could set up the next big move for $SOL.
Are you ready? Will you be buying the dip? Comment below! 👇
NFA & DYOR
Option Trading Master ClassOption Trading Master Class – Overview
🔹 Module 1: Basics of Options
What are Options? (Call vs Put)
Terminologies: Strike Price, Premium, Expiry, Lot Size
European vs American Options
🔹 Module 2: Options Pricing & Greeks
Intrinsic vs Extrinsic Value
Option Greeks: Delta, Gamma, Theta, Vega, Rho
How volatility affects option price
🔹 Module 3: Strategies for Beginners
Covered Call, Protective Put
Bull Call Spread, Bear Put Spread
Pros & Risks of each strategy
🔹 Module 4: Advanced Strategies
Iron Condor, Straddle, Strangle
Butterfly Spreads, Calendar Spreads
Adjusting positions for risk
🔹 Module 5: Live Market Application
Using Option Chain Analysis
Open Interest & Volume Interpretation
Entry/Exit points with technical support
🔹 Module 6: Psychology & Risk Management
Avoiding overtrading & expiry traps
Position sizing, SL rules
Emotional discipline in volatile markets

ETH Long Swing Setup – Breakout Retest of Key ResistanceETH has broken above the critical $2,750 resistance, signaling bullish momentum. We’re now watching for a retrace into the $2,700–$2,750 zone, which is expected to act as support for a continuation higher.
📌 Trade Setup:
• Entry Zone: $2,700 – $2,750
• Take Profit Targets:
o 🥇 $3,000
o 🥈 $3,200
o 🥉 $3,700
• Stop Loss: Daily close below $2,650
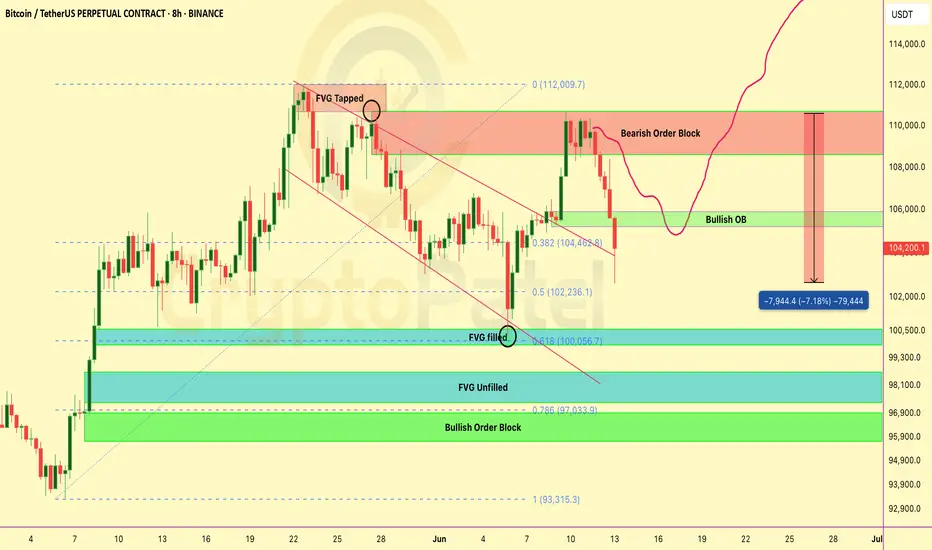
This BTC Pullback Could Be The Last Dip Before $120K+ — Are You #Bitcoin has just delivered a textbook breakout — but what comes next might surprise you. Let’s break it down: 👇
🔸 Bearish Order Block @ $109K–$110K
Price tapped into this zone and is currently reacting. Expect short-term volatility here.
🔸 FVG (Fair Value Gap) Filled + Tapped
A clean move back up filled the previous FVG — this typically signals strength but also invites sellers at OB zones.
🔸 Key Bullish Order Block @ $106K
If BTC pulls back, this zone will be crucial. A strong defense here could ignite the next leg up.
🔸 Fib Levels Aligned:
0.382 Fib @ ~$104.5K
0.5 Fib @ ~$102.2K
0.618 Fib & Bullish OB cluster @ ~$100K ( Filled )
Possible Play Ahead:
A dip toward $106K–$104K is healthy → watch for buyer reaction.
If CRYPTOCAP:BTC holds the $106K OB and bounces, a move back toward $112K+ ATH retest is very likely.
Big Picture:
The breakout from the descending channel + OB retest gives BTC strong bullish structure — as long as the $106K zone holds.
Are you ready for the next BTC move?
📈 Comment below: BULLISH or BEARISH?
🔄 Retweet to keep others in the loop!
NFA & DYOR

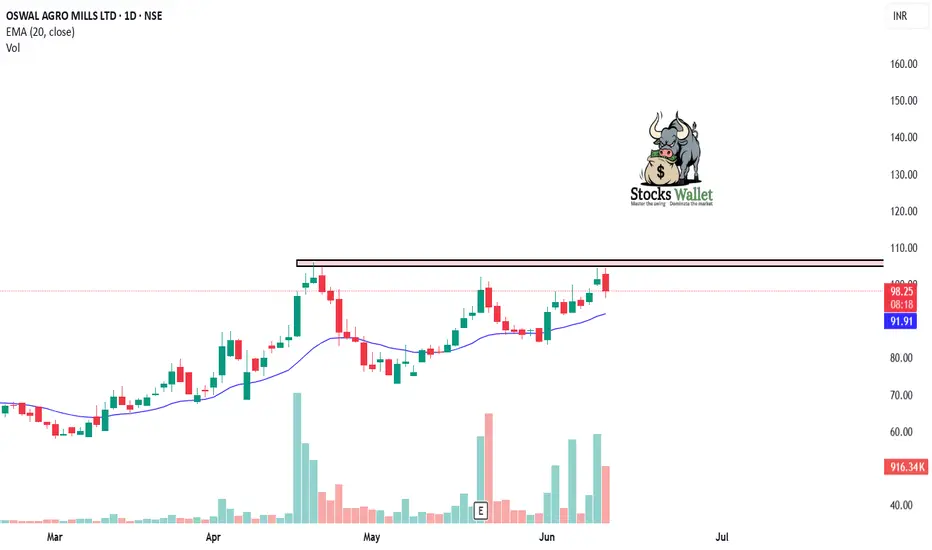
Oswal Agro – Breakout From Long-Term Consolidation Zone🌱 Oswal Agro – Breakout From Long-Term Consolidation Zone.
Chart: Oswal Agro Mills (OSWALAGRO) – Daily Timeframe
Oswal Agro has given a breakout from a long consolidation range, indicating a potential start of a new uptrend. The price action has broken above key resistance near ₹101 with strong bullish candles and increasing volume, suggesting accumulation by smart money.
🔹 Technical Highlights:
Breakout above ₹106 after nearly 3-month sideways movement
Volume spike on breakout candle – confirms strength
Price trading above 20 EMA and 50 EMA
MACD crossover shows bullish momentum
RSI above 60 and trending upward – healthy strength
📌 Trade Setup:
Entry Range: ₹106-107
Target 1: ₹125
Target 2: ₹140
Stop Loss: ₹82. (closing basis)
The breakout could lead to multi-day bullish momentum if sustained above ₹30. Watch for retests or consolidation near breakout levels for low-risk entry opportunities.
⚠️ Educational post only – trade with proper risk management and research.
Technical Cass 9Hammer:
Doji :
Three-white soldiers:
Bullish Engulfing:
Tweezer Bottom:
How to confirm candlestick pattern?
Here are two reliable methods for confirming candlestick patterns with indicators:
MACD: A bullish crossover occurring alongside a bullish candlestick strengthens the case for upward movement.
RSI: Divergence between price and RSI can signal potential reversals, especially when aligned with candlestick patterns.

#Ethereum Breakout Attempt #Ethereum Breakout Attempt 📢
After weeks of consolidation inside this range → CRYPTOCAP:ETH is now testing a breakout above major resistance $2750
👉 If this breakout holds → we could see a BIG upward rally toward $3500–$4000 in the coming weeks. 🚀
Keep an eye on this level — the next move could be massive.

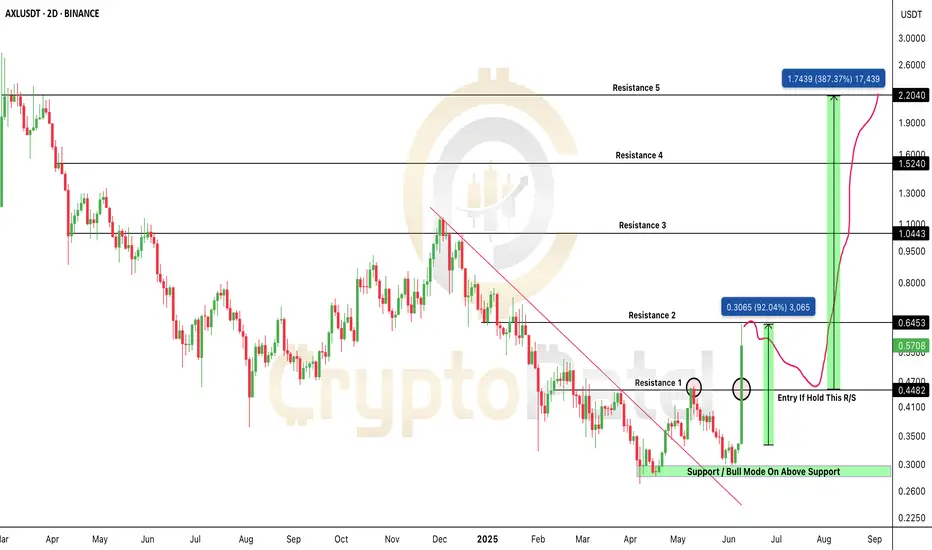
$AXL/USDT — Massive 90% Breakout, But Is It Time To Buy?$AXL/USDT — Massive 90% Breakout, But Is It Time To Buy?
NYSE:AXL has exploded +90% in just 2 days, breaking out of a long-term downtrend with huge volume.
The chart looks fire — but traders, beware:
High volatility = high risk at these levels.
Here’s the technical read:
✅ Downtrend broken
✅ $0.4482 resistance flipped → acting as strong support
✅ Structure is bullish — but a healthy correction is expected
My current view:
→ I do NOT suggest entering at this level.
→ If already holding → now is a good time to book partial profits.
👉 I expect a ~30% pullback from here.
👉 A 2-day close above $0.4482 will confirm strength and create a good accumulation zone.
👉 If not → deeper pullback toward $0.44–$0.34 zone likely.
Best Accumulation Zone:
$0.44–$0.34 — patience required — don’t chase tops.
Targets after correction: $1 → $2 → $3 → $5
Stop Loss: below $0.31
Bottom line:
The trend shift is real — but after a parabolic +90% move, entering now is chasing risk.
NFA & DYOR
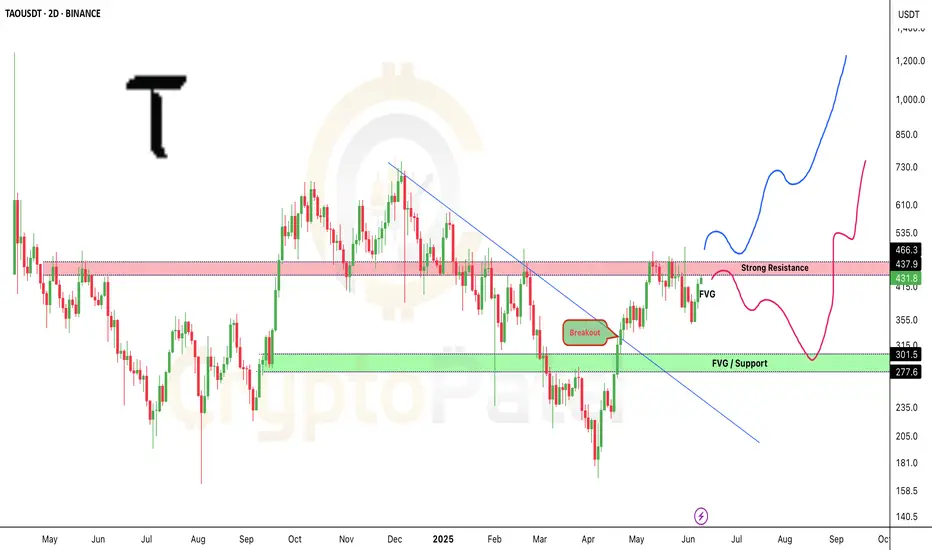
$TAO at a Critical Make-or-Break Zone!LSE:TAO at a Critical Make-or-Break Zone!
LSE:TAO just delivered a clean trendline breakout, with price now approaching a major decision area:
🔹 Currently testing the FVG zone
🔹 Strong Resistance overhead is the next key level to watch
Scenarios:
✅ A breakout & hold above resistance → Targets open toward $730–$1,200+
❌ A rejection → Potential retest of the $301–$277 support zone (FVG)
I’m personally watching this setup VERY closely — high volatility expected ahead. Are you prepared for the next move?
Note: NFA & DYOR