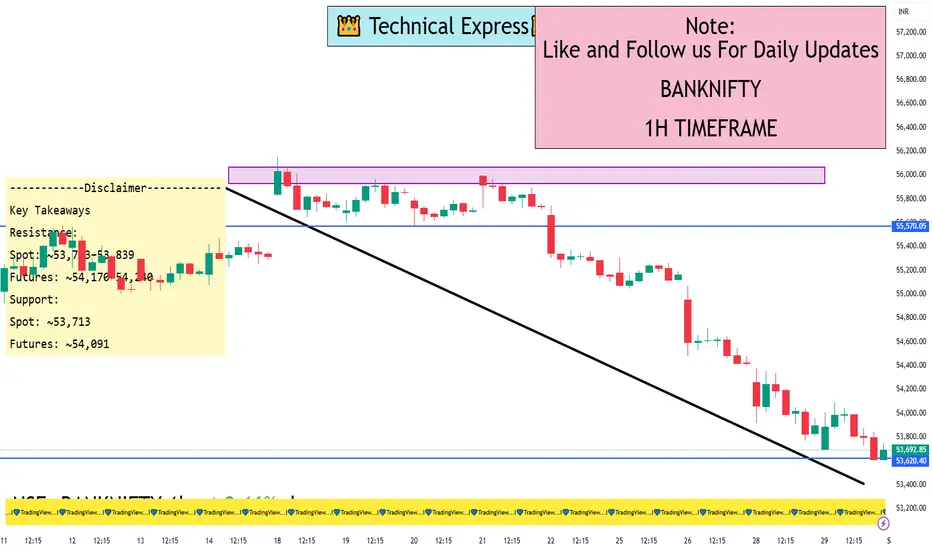
Bank Nifty Index 1 Hour ViewHourly Technical Summary (as of August 29, 2025, ~10:00 AM GMT)
Investing.com’s “Nifty Bank (NSEBANK)” technicals on the hourly chart show:
Overall Summary: Strong Sell
Moving Averages: 12 out of 12 (both Simple and Exponential across various periods) suggest Sell
Key Indicators:
RSI (14): ~25 – Sell
Stochastic oscillator: Overbought
MACD: Sell
ADX: Strong Sell (indicating trending weakness)
Other metrics (CCI, ROC, Bull/Bear Power) – mostly Sell
Pivot-levels (Hourly):
Classic:
S1: 53,713
Pivot: 53,783
R1: 53,839
Fibonacci: similar to above
Camarilla: tighter range around 53,783
How to Use This
Short-term traders might look to enter on bounces near the resistance end of the range with tight stop-loss, targeting support.
Breakout traders should watch if support breaks — could see accelerated decline — or if resistance is broken with volume, signaling possible reversal.
Risk management is key given mixed oscillator readings and macro volatility.
Do keep in mind:
These are technical snapshots as of August 29, 2025. If you're looking for real-time or updated levels, regularly check live tools like TradingView, Investing.com, or your trading platform.
Always blend technical levels with broader market context and risk tolerance before taking action.
Trading
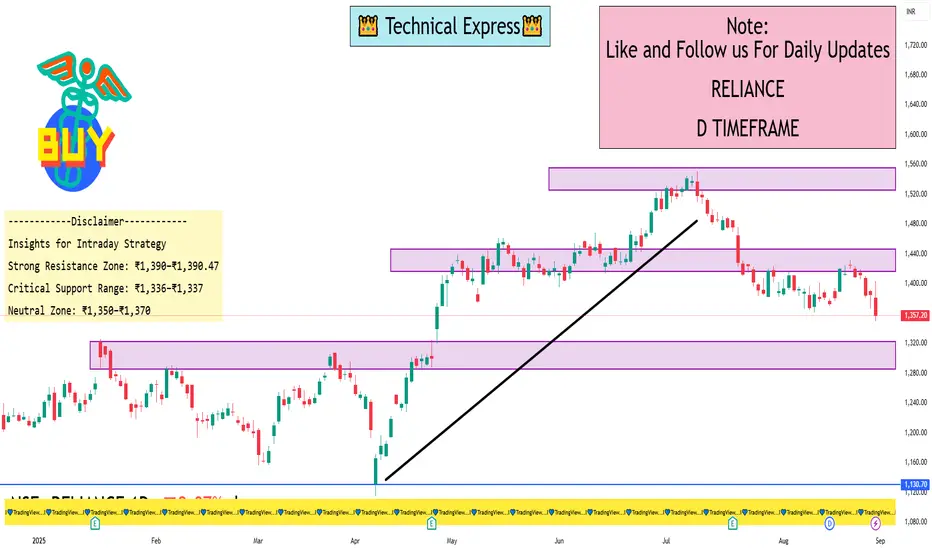
Reliance Industries 1 Day ViewIntraday Overview
Current Price: ~₹1,357.20 (as of August 29, 2025), reflecting a -2.07% drop from the previous close
Daily Price Range:
Open: ₹1,381.10
High: ₹1,403.50
Low: ₹1,350.00
This indicates a volatile session with a significant pullback from intraday highs.
Key Metrics & Context
One-Day Return: Approximately -2.08%, aligning with both Economic Times and Investing.com data
Recent Trend: The stock has seen a modest correction of around -4.23% over the past month
Support Zone: Technical commentary suggests buyers stepping in near ₹1,400–₹1,410, placing this zone as a key support area on the daily chart
Volatility & Market Movement:
NSE data confirms a high intraday range between ₹1,350 and ₹1,403
Beta and VWAP metrics reinforce its typical intraday behavior
Final Take
Reliance Industries closed the day down ~2%, revealing intraday vulnerability after failing to sustain gains above ₹1,400. If that support holds, a short-term rebound could follow. Otherwise, a deeper dip toward ₹1,350–₹1,360 remains on the table.
Basic Trading Orders1. Introduction to Trading Orders
A trading order is an instruction to a broker or an exchange to buy or sell a financial instrument. The order specifies certain conditions like quantity, price, and execution rules. Depending on the type of order, execution may happen immediately, in the future, or only when certain conditions are met.
Trading orders can be as simple as:
“Buy 100 shares of Infosys at ₹1,600”
or as complex as:
“Buy 500 shares of Reliance if the price drops below ₹2,400, but only if it happens today, and sell them automatically if it rises above ₹2,480.”
Thus, trading orders bridge the gap between an investor’s intent and the actual execution of trades in the market.
2. Why Trading Orders Matter
Precision in Execution: Orders allow traders to execute trades at desired prices, avoiding unwanted slippage.
Risk Management: Stop-loss and conditional orders prevent excessive losses.
Automation: Orders enable traders to act even when they are not actively monitoring markets.
Strategy Implementation: Different order types help in executing strategies like scalping, swing trading, or hedging.
Psychological Discipline: By pre-defining entries and exits, traders reduce emotional decision-making.
3. Classification of Trading Orders
Trading orders can broadly be classified into:
Market Orders
Limit Orders
Stop Orders (Stop-Loss Orders)
Stop-Limit Orders
Day Orders & Good-Till-Cancelled (GTC) Orders
Immediate-or-Cancel (IOC) Orders
Fill-or-Kill (FOK) Orders
Other Advanced Variations (Trailing Stop, Bracket Orders, OCO, etc.)
We’ll focus mainly on the basic trading orders, while also touching upon variations.
4. Market Order
Definition
A market order is the simplest type of order: an instruction to buy or sell immediately at the best available current market price.
Mechanism
When a trader places a market buy order, it matches with the lowest available sell (ask) price.
When placing a market sell order, it matches with the highest available buy (bid) price.
Execution is guaranteed, but the exact price may vary slightly due to market volatility.
Example
If Infosys stock is quoted at ₹1,600 (bid ₹1,599, ask ₹1,601):
A market buy order executes at ₹1,601.
A market sell order executes at ₹1,599.
Advantages
Immediate execution.
Simple and beginner-friendly.
Ensures participation in fast-moving markets.
Disadvantages
No control over price.
Slippage risk during volatile periods.
5. Limit Order
Definition
A limit order specifies the maximum price you are willing to pay when buying or the minimum price you are willing to accept when selling. Execution happens only if the market reaches that price.
Mechanism
Buy Limit Order: Executes at the specified price or lower.
Sell Limit Order: Executes at the specified price or higher.
Example
If Reliance is trading at ₹2,450:
Buy Limit at ₹2,400 → Order executes only if price falls to ₹2,400 or below.
Sell Limit at ₹2,500 → Order executes only if price rises to ₹2,500 or above.
Advantages
Full control over execution price.
Useful for buying at dips and selling at rallies.
Disadvantages
No guarantee of execution (price may never reach the limit).
Risk of missing opportunities in fast markets.
6. Stop Order (Stop-Loss Order)
Definition
A stop order is triggered only when the market reaches a specified stop price. It then converts into a market order.
Types
Buy Stop: Placed above market price to enter a trade once momentum confirms.
Sell Stop (Stop-Loss): Placed below market price to limit potential losses.
Example
Infosys trading at ₹1,600:
Buy Stop at ₹1,650 → Buy only if price breaks above ₹1,650.
Sell Stop at ₹1,550 → Sell if price drops below ₹1,550 (to limit loss).
Advantages
Essential for risk management.
Automates exits and entries.
Disadvantages
May trigger due to short-term volatility (“stop hunting”).
Executes at next available market price, which may differ.
7. Stop-Limit Order
Definition
A stop-limit order combines stop and limit orders. When the stop price is reached, the order becomes a limit order rather than a market order.
Mechanism
Offers more control by ensuring execution only within a specified price range.
But risks non-execution if the market skips through the limit level.
Example
Infosys at ₹1,600:
Stop ₹1,550, Limit ₹1,545 → If price falls to ₹1,550, a sell limit order at ₹1,545 is placed.
Advantages
Protection from large slippage.
Allows precise strategy.
Disadvantages
May not execute if market gaps below limit price.
8. Day Orders vs GTC Orders
Day Order
Valid only for the trading day.
If not executed by market close, it expires.
Good Till Cancelled (GTC)
Remains active until executed or manually cancelled.
Useful for long-term strategies.
9. IOC and FOK Orders
Immediate-or-Cancel (IOC)
Executes all or part of the order immediately.
Cancels any unexecuted portion.
Fill-or-Kill (FOK)
Executes the entire order immediately.
If not possible, cancels completely.
10. Practical Examples of Basic Trading Orders
Intraday Trader: Uses market orders for quick scalping.
Swing Trader: Places limit orders to buy dips and sell rallies.
Long-Term Investor: Uses GTC limit orders to accumulate at attractive levels.
Risk-Conscious Trader: Relies on stop-loss orders to protect capital.
Conclusion
Basic trading orders are the foundation of market participation. They empower traders to:
Control price and timing.
Manage risks effectively.
Automate trades to reduce emotional errors.
While market, limit, stop, and stop-limit orders form the backbone of trading, advanced variations like GTC, IOC, FOK, and bracket orders enhance flexibility. A trader’s success depends not just on strategy but on the proper use of these orders to execute that strategy in real markets.
In essence, understanding trading orders is like learning the grammar of a language. Without mastering them, one cannot communicate effectively with the markets.

Types of Financial InstrumentsIntroduction
Financial instruments are the lifeblood of the global financial system. They represent monetary contracts between parties and are used for various purposes such as raising capital, investing, trading, risk management, and hedging. Whether it’s a simple bank deposit, a government bond, or a complex derivative like a swap, financial instruments act as the medium through which money flows in the economy.
Broadly speaking, financial instruments can be classified into two major categories: cash instruments (whose value is directly determined by markets) and derivative instruments (whose value is derived from underlying assets such as stocks, commodities, or currencies). Within these categories exist several subtypes, ranging from equity shares and bonds to futures, options, and structured products.
In this article, we will examine financial instruments in detail, covering their types, features, roles, and global significance.
1. Meaning and Characteristics of Financial Instruments
A financial instrument can be defined as:
“A tradable asset, security, or contract that represents a legal agreement involving monetary value.”
Key characteristics include:
Monetary Value – Each instrument carries a certain value in terms of money.
Transferability – Most financial instruments can be traded between parties.
Liquidity – They vary in liquidity; shares of large companies are highly liquid, while structured products may be less so.
Risk and Return – They balance between safety and profitability.
Maturity – Some instruments (like equity shares) have no maturity, while others (like bonds) mature after a specific period.
2. Classification of Financial Instruments
Financial instruments can be classified into multiple categories depending on their structure and usage:
A. Based on Nature of Contract
Cash Instruments
Directly influenced by market conditions.
Examples: Deposits, loans, equity shares, bonds.
Derivative Instruments
Value derived from underlying assets.
Examples: Futures, options, forwards, swaps.
B. Based on Ownership
Equity-based Instruments – Ownership in a company (shares).
Debt-based Instruments – Borrowed funds to be repaid (bonds, debentures).
C. Based on Market
Primary Instruments – Issued directly by companies or governments to raise funds.
Secondary Instruments – Traded between investors on exchanges.
3. Cash Instruments
Cash instruments are the simplest and most common. They are valued directly by supply and demand in financial markets.
3.1 Equity Instruments (Shares)
Represent ownership in a company.
Two main types:
Common/Equity Shares: Provide ownership rights, voting power, and dividends.
Preference Shares: Fixed dividends, priority over common shareholders during liquidation, but usually no voting rights.
Importance:
Provide capital to businesses.
Allow investors to share profits and growth of companies.
3.2 Debt Instruments (Bonds & Debentures)
Debt instruments represent a loan given by the investor to an issuer (corporation or government).
Government Bonds – Considered risk-free, issued by sovereign entities.
Corporate Bonds – Issued by companies, carry credit risk.
Municipal Bonds – Issued by local governments.
Debentures – Unsecured bonds relying on issuer’s creditworthiness.
Key Features:
Fixed interest (coupon).
Redemption at maturity.
Credit rating plays a crucial role in pricing.
3.3 Money Market Instruments
Short-term financial instruments with high liquidity and low risk.
Examples:
Treasury Bills (T-Bills).
Commercial Papers (CPs).
Certificates of Deposit (CDs).
Repurchase Agreements (Repos).
3.4 Loans and Deposits
Bank Loans: Credit extended by banks with fixed repayment terms.
Fixed Deposits (FDs): Deposits made with banks for fixed tenure at agreed interest.
4. Derivative Instruments
Derivatives derive their value from an underlying asset such as stocks, indices, commodities, currencies, or interest rates. They are widely used for hedging, speculation, and arbitrage.
4.1 Forwards
Customized agreements between two parties to buy/sell an asset at a predetermined future date and price.
Traded over-the-counter (OTC).
High counterparty risk.
4.2 Futures
Standardized contracts traded on exchanges.
Obligates buyer/seller to transact underlying asset on a future date at a fixed price.
Common in commodities, currencies, and stock indices.
4.3 Options
Provide the right, but not obligation, to buy/sell an asset at a predetermined price.
Call Option: Right to buy.
Put Option: Right to sell.
Used for hedging and speculative trading.
4.4 Swaps
Contracts to exchange cash flows between two parties.
Types include:
Interest Rate Swaps – Fixed vs floating rate exchange.
Currency Swaps – Exchange of principal and interest in different currencies.
Commodity Swaps – Based on commodity price fluctuations.
5. Hybrid Instruments
These combine characteristics of debt and equity.
5.1 Convertible Bonds
Start as debt but can be converted into equity shares at later stages.
Attractive to investors seeking both safety and growth.
5.2 Preference Shares (with Debt Features)
Hybrid nature: act like equity but provide fixed returns like debt.
5.3 Warrants
Provide the right to buy company shares at a fixed price in future.
Often issued along with bonds to make them attractive.
6. Based on Risk and Return
Financial instruments also differ in terms of risk profile:
Low-risk instruments – Treasury bills, government bonds.
Moderate-risk instruments – Corporate bonds, preference shares.
High-risk instruments – Equity shares, derivatives, cryptocurrencies.
7. Structured and Alternative Financial Instruments
With globalization and financial innovation, new categories of instruments have emerged:
7.1 Structured Products
Custom-designed financial products combining derivatives with bonds or equities.
Example: Capital-protected notes.
7.2 Securitized Instruments
Pooling financial assets and selling them as securities.
Examples: Mortgage-backed securities (MBS), Asset-backed securities (ABS).
7.3 Alternative Assets
Hedge funds, private equity, venture capital.
Cryptocurrencies and digital tokens also fall under this category.
8. International Financial Instruments
Financial instruments also differ based on geography and cross-border usage:
Eurobonds – Bonds issued in currency different from the issuer’s home country.
Global Depository Receipts (GDRs) & American Depository Receipts (ADRs) – Allow companies to raise funds abroad.
Foreign Exchange Instruments – Spot, forwards, and swaps in currency markets.
9. Role of Financial Instruments in the Economy
Capital Formation – Companies raise funds through shares and bonds.
Liquidity Creation – Instruments can be traded in secondary markets.
Risk Management – Derivatives allow hedging against price fluctuations.
Efficient Resource Allocation – Savings flow into productive investments.
Global Integration – International instruments connect economies.
10. Regulatory Framework for Financial Instruments
Since financial instruments impact millions of investors, they are regulated by authorities:
India: SEBI (Securities and Exchange Board of India).
USA: SEC (Securities and Exchange Commission).
Global: IOSCO (International Organization of Securities Commissions).
Regulations cover disclosure norms, investor protection, insider trading, and systemic risk management.
11. Risks Associated with Financial Instruments
Market Risk – Fluctuations in prices.
Credit Risk – Default by borrower.
Liquidity Risk – Inability to sell asset quickly.
Operational Risk – Failures in systems or processes.
Regulatory Risk – Sudden changes in laws or policies.
12. Future of Financial Instruments
The landscape is evolving rapidly:
Digital Assets & Cryptocurrencies – Bitcoin, Ethereum, and tokenized securities.
Green Bonds & ESG-linked Instruments – Promoting sustainable finance.
Blockchain-based Smart Contracts – Transparent, decentralized trading.
Artificial Intelligence in Trading – Algorithm-driven financial products.
Conclusion
Financial instruments are at the core of global finance, enabling businesses, governments, and individuals to mobilize capital, invest, manage risks, and generate returns. From traditional cash instruments like bonds and shares to complex derivatives and innovative products like cryptocurrencies, they represent the dynamic evolution of money and markets.
Understanding the types, features, risks, and applications of these instruments is essential for investors, traders, policymakers, and anyone involved in the financial ecosystem. As global markets evolve, financial instruments will continue to adapt, reflecting technological progress and the changing needs of economies.
Role of Brokers and Sub-Brokers in IndiaIntroduction
The Indian financial market is one of the largest and fastest-growing markets in the world, supported by a strong regulatory framework, technological adoption, and rising investor participation. Stock exchanges like the Bombay Stock Exchange (BSE) and the National Stock Exchange (NSE) are at the center of this growth, facilitating billions of trades every day. But ordinary investors cannot directly access these exchanges—there is an important intermediary system that bridges the gap between the investor and the stock market.
This intermediary system consists of stock brokers and sub-brokers, who play a pivotal role in connecting individuals and institutions to the securities market. Their functions go beyond simply buying and selling shares—they are responsible for advisory services, compliance, risk management, investor education, and ensuring fair trade execution.
In this article, we will explore in detail the role of brokers and sub-brokers in India, their regulatory framework, services, business models, challenges, and the evolving dynamics of brokerage in a digital-first economy.
Chapter 1: Understanding Brokers in India
1.1 Who is a Broker?
A stock broker is a market intermediary who is authorized to trade in securities on behalf of investors. Brokers are registered members of recognized stock exchanges like BSE, NSE, MCX, etc., and they execute buy/sell orders for clients in return for a commission or brokerage fee.
A broker can be:
Full-service broker: Offers a wide range of services including investment advice, research, portfolio management, and wealth management. Examples: ICICI Direct, Kotak Securities, HDFC Securities.
Discount broker: Focuses on low-cost trading with minimal services, leveraging technology to reduce costs. Examples: Zerodha, Upstox, Angel One, Groww.
1.2 Role of Brokers in the Indian Capital Market
The broker’s role is not limited to just order execution. Their responsibilities include:
Order Execution: Placing buy/sell orders for clients at the best possible prices.
Advisory Services: Guiding investors on market trends, stock recommendations, and investment strategies.
Research & Analysis: Providing technical, fundamental, and sectoral research reports.
Compliance & KYC: Ensuring client KYC, anti-money laundering (AML) checks, and regulatory compliance.
Risk Management: Monitoring margin requirements, exposure limits, and preventing defaults.
Investor Education: Conducting webinars, training, and knowledge sessions for retail investors.
Chapter 2: Understanding Sub-Brokers in India
2.1 Who is a Sub-Broker?
A sub-broker is an agent or franchisee who works under a registered broker to provide access to clients. Unlike brokers, sub-brokers are not direct members of the stock exchange. They act as local representatives of big brokerage houses, extending their services to smaller towns and cities.
For example: A small-town investor in Uttar Pradesh may trade via a sub-broker of ICICI Direct or Angel One, instead of directly connecting with the central brokerage.
2.2 Functions of Sub-Brokers
Client Acquisition: Bringing in new investors from local regions.
Client Servicing: Assisting clients with account opening, trade execution, and documentation.
Relationship Management: Maintaining trust and long-term relations with investors.
Education: Guiding first-time investors about markets and trading platforms.
Revenue Sharing: Earning a portion of brokerage generated by clients they onboard.
2.3 Sub-Broker vs Authorized Person (AP)
Earlier, SEBI recognized “sub-brokers” as intermediaries. However, since 2018, the concept of sub-brokers has been merged with the category of Authorized Persons (APs).
A sub-broker license is no longer issued.
New intermediaries now register as Authorized Persons under brokers, making the system simpler and more transparent.
Chapter 3: Regulatory Framework Governing Brokers and Sub-Brokers
3.1 SEBI Regulations
The Securities and Exchange Board of India (SEBI) regulates all brokers and sub-brokers in India. Key responsibilities include:
Registration of brokers and APs.
Setting capital adequacy requirements.
Ensuring fair practices and investor protection.
Monitoring brokerage charges.
Enforcing compliance, penalties, and suspensions when required.
3.2 Stock Exchanges’ Role
Exchanges like NSE and BSE maintain:
Membership eligibility criteria.
Trading and risk management systems.
Grievance redressal mechanisms for clients.
3.3 Compliance Requirements for Brokers
Net Worth Requirements: Minimum net worth for full-service and discount brokers.
Deposits: Security deposits with stock exchanges.
KYC Norms: Adherence to KYC and AML regulations.
Audit Reports: Submission of financial and compliance audits.
Chapter 4: Services Offered by Brokers and Sub-Brokers
4.1 Trading Facilities
Equity delivery & intraday trading.
Futures & options (F&O) derivatives trading.
Commodity trading (MCX, NCDEX).
Currency derivatives.
4.2 Investment Services
Mutual funds distribution.
IPO investments.
Bonds, debentures, and government securities.
Portfolio management services (PMS).
4.3 Research & Advisory
Technical charts, indicators, and patterns.
Fundamental analysis of companies.
Sectoral & macroeconomic research.
Personalized advisory for HNIs (High Net Worth Individuals).
4.4 Technology & Platforms
Modern brokers offer:
Mobile trading apps.
Algo-trading and APIs.
AI-based portfolio analysis.
Robo-advisory services.
Chapter 5: Business Models of Brokers and Sub-Brokers
5.1 Brokerage Fee Models
Percentage-based brokerage: Charged as % of transaction value (common in full-service brokers).
Flat-fee brokerage: Fixed fee per trade (popular with discount brokers like Zerodha, Groww).
5.2 Revenue Sharing Model with Sub-Brokers/APs
Sub-brokers earn a percentage (30–60%) of the brokerage generated by their clients.
Larger franchisees with bigger client bases get better revenue-sharing ratios.
5.3 Value-Added Services
Insurance distribution.
Wealth management.
Research subscriptions.
Chapter 6: Importance of Brokers and Sub-Brokers in India
Market Access: Enable lakhs of investors to trade without being direct members of exchanges.
Financial Inclusion: Expand capital market reach to tier-2 and tier-3 cities.
Liquidity Creation: More participants = higher market liquidity.
Investor Education: Teach first-time traders about risks and opportunities.
Compliance & Safety: Safeguard investors through regulated trading systems.
Chapter 7: Challenges Faced by Brokers and Sub-Brokers
Competition from Discount Brokers: Traditional brokers face pricing pressure.
Regulatory Burden: Constant compliance requirements increase costs.
Technological Upgradation: Need to invest heavily in digital platforms.
Client Defaults & Fraud: Risk of misuse of margin or client funds.
Thin Margins: Reduced brokerage rates have lowered profitability.
Chapter 8: Future of Brokers and Sub-Brokers in India
Shift to Technology: AI, machine learning, and algo-trading adoption.
Rise of Discount Brokers: Market share shifting to low-cost platforms like Zerodha & Groww.
Hybrid Model: Combination of advisory + low-cost execution.
Financial Inclusion: Deeper penetration in rural India through APs and digital platforms.
Global Integration: Indian brokers offering access to global equities, ETFs, and commodities.
Conclusion
Brokers and sub-brokers (or Authorized Persons) form the backbone of India’s stock market ecosystem. They democratize access to markets, educate investors, provide liquidity, and ensure regulatory compliance. Over the decades, their role has evolved from traditional floor-based trading to digital-first platforms, with a growing emphasis on low-cost execution, technology, and advisory services.
While discount brokers are reshaping the competitive landscape, full-service brokers and sub-brokers remain vital for personalized services, financial literacy, and expanding market reach. The future will likely see a convergence of technology, advisory, and financial inclusion, making brokers and sub-brokers even more crucial in India’s journey toward becoming a global financial powerhouse.

Types of Market ParticipantsIntroduction
Financial markets are vast ecosystems where millions of transactions take place daily, involving buyers, sellers, intermediaries, regulators, and institutions. Each participant plays a unique role, and together, they form the lifeblood of the global economy. Just like any well-functioning system, financial markets rely on a diverse group of actors whose motives range from profit-making, hedging risks, raising capital, or ensuring stability and liquidity.
In simple terms, market participants are all the individuals, institutions, and entities that engage in trading financial instruments—stocks, bonds, derivatives, currencies, commodities, and more. Their presence ensures that markets remain liquid, efficient, and capable of transmitting signals about economic health.
Understanding the types of market participants is essential for traders, investors, policymakers, and students of finance. Different participants bring different motivations and strategies: while some seek long-term value, others look for short-term profits; while some provide regulation and order, others bring in liquidity. This dynamic interaction creates both opportunities and risks in markets.
This article provides a comprehensive exploration of the various types of market participants, categorized based on their roles, objectives, and influence.
Broad Categories of Market Participants
Before diving deep, let’s break down the broad categories:
Individual Investors / Retail Participants
Institutional Investors
Market Intermediaries (Brokers, Dealers, Exchanges, etc.)
Hedgers and Arbitrageurs
Speculators and Traders
Regulators and Policymakers
Issuers (Corporates and Governments)
Foreign Investors and Global Participants
High-Frequency Traders and Algorithmic Players
Market Makers and Liquidity Providers
Now, let’s discuss each in detail.
1. Individual Investors (Retail Participants)
Retail investors are individuals investing their personal funds in financial markets. They usually trade smaller amounts compared to institutions, but collectively they represent a massive pool of capital.
Characteristics of Retail Investors:
Use their own money (not pooled funds).
Investment horizon varies (short-term, medium-term, long-term).
Motivated by wealth creation, savings growth, retirement planning.
Increasingly influenced by technology (mobile apps, online trading platforms).
Types of Retail Investors:
Active traders: Regularly buy and sell securities for quick gains.
Passive investors: Prefer long-term investments like index funds or mutual funds.
Speculative retail investors: Engage in options, futures, and cryptocurrencies.
Role in the Market:
Retail investors enhance liquidity, provide diversity of opinion, and influence sentiment-driven movements. However, they are often more vulnerable to volatility and herd behavior.
2. Institutional Investors
Institutional investors are large organizations that invest on behalf of others. They have access to substantial capital, advanced research, and professional expertise.
Types of Institutional Investors:
Mutual Funds: Pool money from many investors to invest in diversified portfolios.
Pension Funds: Manage retirement savings and invest for long-term returns.
Insurance Companies: Invest premiums collected from policyholders to earn returns.
Sovereign Wealth Funds (SWFs): State-owned funds that invest national reserves.
Endowments and Foundations: Manage funds for universities, NGOs, and charities.
Characteristics:
Hold significant influence over markets.
Long-term investment horizon, though some engage in active trading.
Often considered more stable than retail investors.
Role in the Market:
Institutional investors are stabilizers of financial markets due to their deep pockets and diversified holdings. However, their concentrated moves can create big shifts in asset prices.
3. Market Intermediaries
Market intermediaries are the connectors that facilitate transactions. Without them, buyers and sellers would struggle to find each other efficiently.
Types of Intermediaries:
Stockbrokers: Act as agents executing trades on behalf of clients.
Dealers: Trade securities for their own accounts and provide liquidity.
Exchanges: Platforms like NSE, BSE, NYSE, NASDAQ, which match buyers and sellers.
Clearinghouses: Ensure settlement of trades and manage counterparty risk.
Depositories: Safekeep securities in electronic form (e.g., NSDL, CDSL in India).
Investment Banks: Help companies raise capital via IPOs, debt issues, mergers, and acquisitions.
Role in the Market:
Intermediaries ensure market efficiency, transparency, and liquidity. They are essential in maintaining trust and smooth functioning.
4. Hedgers
Hedgers are participants who enter markets primarily to reduce risk exposure. They are not focused on profit-making from price changes but on safeguarding their core business or portfolio.
Examples:
A farmer using futures contracts to lock in crop prices.
An airline hedging against fuel price volatility.
An investor using options to protect a stock portfolio from downturns.
Role in the Market:
Hedgers bring stability by offsetting risks. Their activity increases demand for derivative instruments and makes markets more complete.
5. Speculators and Traders
Speculators take on risk in pursuit of profit. Unlike hedgers, they actively seek to benefit from price fluctuations.
Types of Traders:
Day Traders: Buy and sell securities within the same day.
Swing Traders: Hold positions for days/weeks to capture short-term trends.
Position Traders: Hold longer-term bets based on fundamental analysis.
Options/Futures Traders: Engage in derivatives for leverage and profit opportunities.
Role in the Market:
Speculators add liquidity and price discovery. They take risks that others (hedgers) want to avoid. However, excessive speculation can increase volatility.
6. Arbitrageurs
Arbitrageurs exploit price differences of the same asset in different markets.
Examples:
Buying a stock on NSE while simultaneously selling it on BSE if there’s a price gap.
Using currency arbitrage in Forex markets.
Exploiting futures-spot price differences.
Role in the Market:
Arbitrageurs eliminate pricing inefficiencies, keeping markets aligned and fair. They are critical to maintaining balance.
7. Regulators and Policymakers
Markets cannot function smoothly without oversight. Regulators set the rules, monitor activities, and prevent malpractice.
Examples:
SEBI (India): Securities and Exchange Board of India.
SEC (USA): Securities and Exchange Commission.
RBI (India): Regulates currency and banking markets.
CFTC (USA): Commodity Futures Trading Commission.
Roles of Regulators:
Protect investors.
Ensure transparency and fair play.
Prevent frauds, insider trading, and market manipulation.
Stabilize markets during crises.
8. Issuers (Corporates and Governments)
Issuers are entities that raise capital from markets by issuing securities.
Types:
Corporates: Issue equity (shares) or debt (bonds, debentures) to fund growth.
Governments: Issue bonds and treasury bills to finance expenditure.
Municipalities: Issue municipal bonds for infrastructure projects.
Role in the Market:
Issuers are the suppliers of investment products. Without them, there would be nothing to trade.
9. Foreign Investors and Global Participants
Globalization has turned local markets into international ones.
Types:
Foreign Institutional Investors (FIIs): Large funds investing in emerging markets.
Foreign Portfolio Investors (FPIs): Individuals or institutions buying foreign stocks/bonds.
Multinational Corporations: Investing cross-border for expansion.
Role:
Foreign investors bring in capital, liquidity, and global integration, but also add volatility when they withdraw funds during crises.
10. High-Frequency Traders (HFTs) and Algorithmic Participants
With technology, machines are now major participants.
Characteristics:
Use algorithms and superfast systems.
Trade thousands of times in milliseconds.
Seek to exploit micro-price differences.
Role:
HFTs improve liquidity and tighten bid-ask spreads but raise concerns about flash crashes and systemic risks.
Conclusion
The financial market is not just about numbers and charts—it is about participants with diverse objectives interacting to create opportunities, manage risks, and allocate resources. From retail investors saving for retirement to sovereign wealth funds shaping national strategies, from hedgers protecting against volatility to high-frequency traders running algorithms at lightning speed—each plays a vital role.
A proper understanding of types of market participants gives clarity about how markets work, why they move the way they do, and how risks and rewards are distributed. Just like a symphony requires different instruments, financial markets require this variety of participants to function harmoniously.
Primary Market vs Secondary MarketIntroduction
Financial markets form the backbone of modern economies, serving as a bridge between those who have surplus capital and those who need funds for productive purposes. They are not just places where securities are traded, but dynamic systems that drive economic growth, liquidity, and wealth distribution. At the heart of these systems lie two fundamental market segments: the primary market and the secondary market.
Understanding these two markets is critical for anyone interested in finance, investing, or the broader economy. While the primary market deals with the issuance of new securities, the secondary market provides the platform where those securities are subsequently traded among investors. Both markets are interdependent, yet they perform distinct roles in capital formation and liquidity.
This write-up explores in detail the concepts, functions, participants, instruments, advantages, disadvantages, examples, and global relevance of the primary and secondary markets, offering a clear comparative analysis.
1. What is the Primary Market?
The primary market, also known as the new issue market, is where securities are issued for the first time. It is the platform through which companies, governments, or other institutions raise funds by selling financial instruments like shares, bonds, debentures, or other securities directly to investors.
1.1 Key Features of the Primary Market
First-time issuance: Securities are sold for the very first time.
Funds directly to issuer: The proceeds go directly to the issuing company or government.
Capital raising function: Enables companies to fund projects, expansions, or repay debt.
Regulation: Highly regulated to protect investors (e.g., SEBI in India, SEC in the USA).
No trading: Securities are only issued, not resold in this market.
1.2 Methods of Raising Capital in the Primary Market
Initial Public Offering (IPO): When a private company offers its shares to the public for the first time.
Follow-on Public Offer (FPO): A listed company issues additional shares to raise more capital.
Rights Issue: Shares offered to existing shareholders at a discounted price.
Private Placement: Securities sold to a select group of investors (institutions, banks, HNIs).
Preferential Allotment: Issuing shares to specific investors at a fixed price.
1.3 Example of Primary Market Activity
When LIC (Life Insurance Corporation of India) launched its IPO in 2022, it raised capital by selling new shares to the public. The money collected went directly to LIC (or in some cases, to the government, which was the promoter).
2. What is the Secondary Market?
The secondary market, also known as the stock market or aftermarket, is where previously issued securities are traded among investors. Once securities are issued in the primary market, they get listed on stock exchanges, and investors can buy and sell them freely.
2.1 Key Features of the Secondary Market
Trading between investors: No fresh capital goes to the issuing company.
Liquidity: Provides a platform for investors to convert securities into cash.
Price discovery: Market forces (demand and supply) determine security prices.
Continuous trading: Investors can trade daily as long as exchanges are open.
Organized exchanges: Securities are traded on platforms like NSE, BSE, NYSE, NASDAQ, etc.
2.2 Types of Secondary Markets
Stock Exchanges: Organized markets where equity and debt securities are traded.
Examples: NSE, BSE (India); NYSE, NASDAQ (USA); LSE (UK).
Over-the-Counter (OTC) Market: A decentralized market where securities not listed on exchanges are traded directly between parties.
2.3 Example of Secondary Market Activity
If you buy Reliance Industries shares from another investor on NSE, that transaction occurs in the secondary market. Reliance does not receive the money from your purchase — it goes to the selling investor.
3. Participants in Primary and Secondary Markets
3.1 Participants in the Primary Market
Issuers: Companies, governments, or institutions raising capital.
Investors: Retail investors, institutional investors, mutual funds, pension funds.
Underwriters: Banks or investment firms that guarantee the sale of securities.
Regulators: SEBI, SEC, FCA, etc., ensuring fair play and transparency.
3.2 Participants in the Secondary Market
Buyers and Sellers (Investors): Retail, institutional, FIIs, mutual funds.
Stock Exchanges: Platforms enabling trading.
Brokers & Dealers: Intermediaries facilitating transactions.
Market Makers: Entities ensuring liquidity by quoting buy/sell prices.
Regulators: Ensure fair trading, prevent fraud, and monitor disclosures.
4. Instruments Traded
4.1 Primary Market Instruments
Equity Shares (IPOs, FPOs, Rights Issues).
Debt Instruments (Bonds, Debentures).
Hybrid Instruments (Convertible debentures, preference shares).
4.2 Secondary Market Instruments
Equity Shares.
Bonds & Debentures (already issued).
Derivatives (Futures, Options).
ETFs, Mutual Funds (listed ones).
5. Importance of the Primary Market
Capital Formation: Helps companies and governments raise funds.
Industrial Growth: Enables businesses to expand and innovate.
Encourages Savings & Investment: Channelizes savings into productive use.
Diversification of Ownership: Encourages public participation in ownership.
Government Funding: Governments raise money for infrastructure via bonds.
6. Importance of the Secondary Market
Liquidity Provider: Investors can exit investments anytime.
Price Discovery Mechanism: Market sets fair value of securities.
Encourages Investment in Primary Market: Investors buy IPOs because they know secondary markets provide exit options.
Wealth Creation: Allows investors to grow wealth through trading and long-term holdings.
Economic Indicator: Stock market performance reflects overall economic health.
7. Key Differences Between Primary and Secondary Market
Basis Primary Market Secondary Market
Meaning New securities issued for the first time Previously issued securities traded
Participants Issuers, investors, underwriters Buyers, sellers, brokers
Funds Flow Goes to the issuing company/government Goes to the selling investor
Price Fixed by issuer (through book-building or valuation) Determined by demand and supply
Purpose Capital raising Liquidity and wealth creation
Trading Platform Directly between company and investors Stock exchanges or OTC
Risk High (new issue, uncertain returns) Relatively lower (market data available)
8. Advantages & Disadvantages
8.1 Advantages of the Primary Market
Provides funds for business expansion.
Encourages entrepreneurship.
Offers investment opportunities for public.
Helps government raise money for development.
8.2 Disadvantages of the Primary Market
High risk (company’s future performance uncertain).
Heavy compliance and regulatory costs.
Limited exit options until securities are listed in the secondary market.
8.3 Advantages of the Secondary Market
Provides liquidity and flexibility.
Encourages savings and investments.
Facilitates portfolio diversification.
Reflects investor confidence and economic conditions.
8.4 Disadvantages of the Secondary Market
Market volatility and speculation.
Risk of losses due to sudden price movements.
Subject to manipulation and insider trading (if not regulated well).
9. Case Studies
Case Study 1: Infosys IPO (1993)
Infosys raised capital via its IPO in the primary market. Initially undervalued, the shares later grew multifold in the secondary market, rewarding long-term investors.
Case Study 2: Tesla, Inc. (USA)
Tesla raised billions through IPO and follow-on offerings in the primary market. In the secondary market, its stock witnessed massive growth, creating wealth for investors worldwide.
Case Study 3: Indian Government Bonds
The Indian government issues bonds in the primary market to finance fiscal needs. These bonds later trade in the secondary bond market, offering liquidity to investors.
10. Interrelationship Between Primary and Secondary Market
A vibrant secondary market encourages participation in the primary market because investors know they can exit later.
Strong primary market activity provides fresh investment opportunities for secondary market trading.
Both markets complement each other — one raises funds, the other ensures liquidity.
11. Global Perspective
USA: NYSE & NASDAQ dominate secondary markets; IPOs (primary market) attract global investors.
India: NSE & BSE secondary markets are vibrant; IPO activity growing (e.g., Zomato, Nykaa, Paytm IPOs).
China: Shanghai & Shenzhen exchanges are growing rapidly, supporting capital formation.
Europe: London Stock Exchange and Euronext play dual roles in both markets.
12. Conclusion
The primary and secondary markets are two integral pillars of the financial system. While the primary market focuses on capital formation by enabling issuers to raise funds, the secondary market provides liquidity, price discovery, and investment opportunities for participants.
Together, they create a cycle: companies raise funds, securities get listed, investors trade them, and capital continues to flow. Without the primary market, businesses would struggle to finance growth; without the secondary market, investors would lack exit options, and the primary market would lose appeal.
Thus, both markets complement each other and are essential for economic growth, financial stability, and wealth creation.

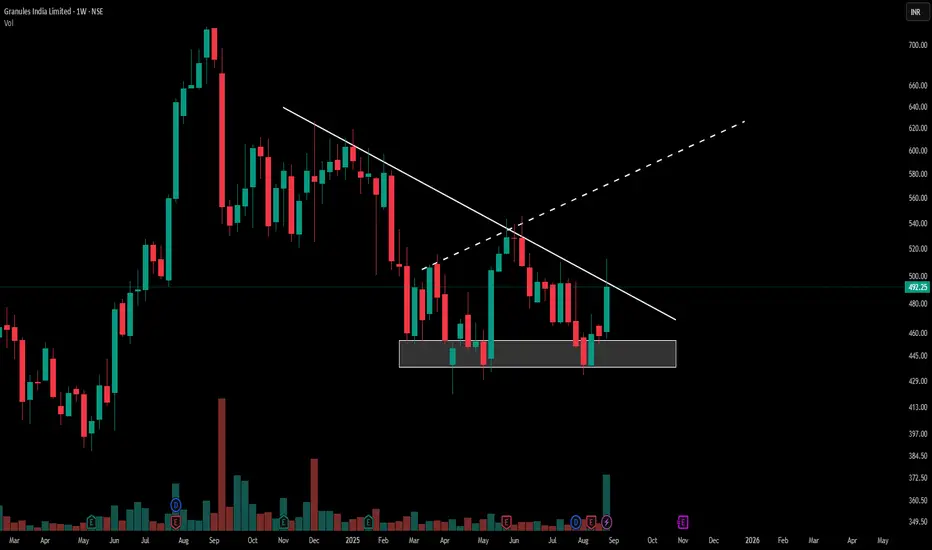
Granules India: Critical Descending TriangleGranules India Limited presents a descending triangle pattern on the weekly chart. The price has moved from the established support zone near ₹440-450 and is currently challenging the resistance trendline around ₹492.25. This movement appears with a marked increase in trading volume, highlighting the level where buyers and sellers are most active.
Pattern Character
A descending triangle pattern is identified by a series of lower highs against a stable support base. Granules India’s recent action displays persistence at support and upward momentum toward resistance. The volume expansion indicates notable participation during the current move.
Chart Observation
Price action above the triangle’s resistance can indicate a change in the prevailing sentiment if confirmed by continued volume. The current structure and market activity are being closely watched by participants for further development. No forecast or recommendation is made within this post.
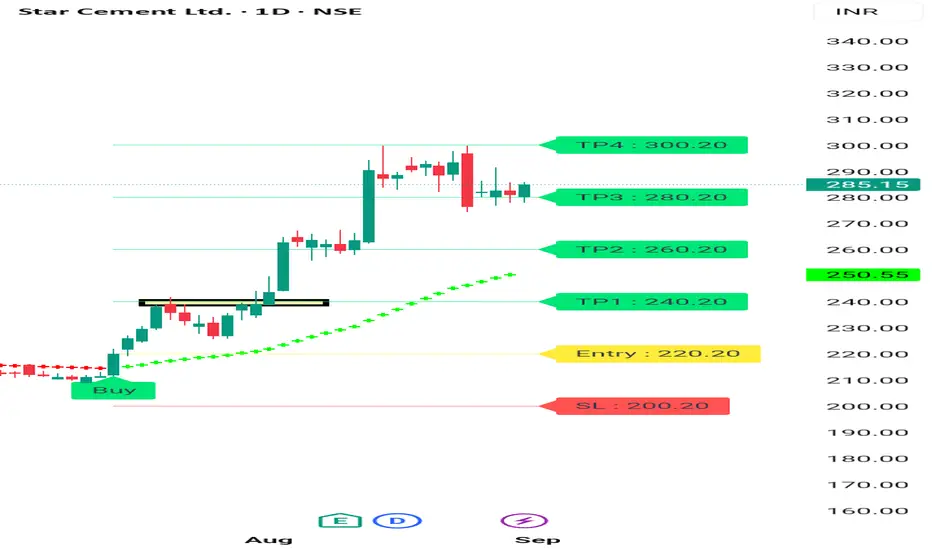
STAR CEMENT BULLISH Structure Start Cement Showing Good Strength on 1 Day Chart. Be Can See Star Cement given breakout and moving up in a higher high Pattern. It's a good sign that stock Still in Upper Range in this Falling market.
Consult your financial advisor before making any position in stock market. It's not my buy sell Reccomendation. My views are for educational purposes only.
Option Trading Advanced Options Strategies
Professional traders use combinations for specific market conditions.
Butterfly Spread
Outlook: Neutral, low volatility.
How it works: Combination of bull and bear spreads with three strikes.
Risk/Reward: Limited both ways.
Calendar Spread
Outlook: Neutral with time decay advantage.
How it works: Sell near-term option, buy longer-term option (same strike).
Benefit: Profit from faster time decay of short option.
Ratio Spread
Outlook: Directional but with twist.
How it works: Buy one option and sell more options of the same type.
Risk: Potentially unlimited.
Reward: Limited to premium collected.
Collar Strategy
Outlook: Hedge with limited upside.
How it works: Own stock, buy protective put, sell covered call.
Use: Lock in gains, reduce downside.
Risk Management in Options Trading
Options carry significant risks if misused. Successful traders emphasize:
Position Sizing: Never risk too much on one trade.
Diversification: Spread across multiple strategies/assets.
Stop-Loss & Adjustments: Exit losing trades early.
Implied Volatility (IV) Awareness: High IV increases premiums; selling strategies may be better.

Divergence SectersIntermediate Options Strategies
These involve combining calls and puts to create structured payoffs.
Bull Call Spread
Outlook: Moderately bullish.
How it works: Buy a call (lower strike), sell another call (higher strike).
Risk: Limited to net premium.
Reward: Limited to strike difference minus premium.
Example: Buy ₹100 call at ₹5, sell ₹110 call at ₹2. Net cost ₹3. Max profit = ₹7.
Bear Put Spread
Outlook: Moderately bearish.
How it works: Buy a put (higher strike), sell another put (lower strike).
Risk: Limited to net premium.
Reward: Limited.
Iron Condor
Outlook: Neutral, low volatility.
How it works: Sell OTM call and put, buy further OTM call and put.
Risk: Limited.
Reward: Premium collected.
Best for: Range-bound markets.
Straddle
Outlook: Expect big move (up or down).
How it works: Buy one call and one put at same strike/expiry.
Risk: High premium cost.
Reward: Unlimited if strong move.
Strangle
Outlook: Expect volatility but uncertain direction.
How it works: Buy OTM call + OTM put.
Risk: Lower premium than straddle.
Reward: Unlimited if strong price move.

Part 2 Support and ResistanceWhy Use Options?
Options provide traders with:
Leverage: Control a large position with a smaller investment.
Flexibility: Create strategies for any market scenario.
Risk Management: Hedge against adverse price movements.
Income Generation: Sell options to collect premium.
Simple Options Trading Strategies
These strategies are suitable for beginners. They involve limited positions and simple risk-reward profiles.
Long Call
Outlook: Bullish
How it works: Buy a call option when expecting price to rise.
Risk: Limited to premium paid.
Reward: Unlimited upside.
Example: Stock trading at ₹100, buy a call with strike ₹105 for ₹3 premium. If stock rises to ₹120, profit = (120–105–3) = ₹12.
Long Put
Outlook: Bearish
How it works: Buy a put option when expecting price to fall.
Risk: Limited to premium paid.
Reward: Potential profit increases as price drops (limited to strike price minus premium).
Example: Stock at ₹100, buy a put strike ₹95 for ₹2. If stock falls to ₹85, profit = (95–85–2) = ₹8.
Covered Call
Outlook: Neutral to mildly bullish
How it works: Own stock and sell a call against it.
Risk: Downside risk in stock, upside capped at strike.
Reward: Earn premium income.
Protective Put
Outlook: Hedge
How it works: Own stock and buy a put to protect downside.
Risk: Limited (stock downside hedged).
Reward: Unlimited upside, protection from losses.

Part 1 Support and ResistanceIntroduction
Options trading is one of the most fascinating and versatile aspects of the financial markets. Unlike stocks, which give ownership in a company, or bonds, which provide fixed income, options are derivative instruments whose value is derived from an underlying asset such as stocks, indices, commodities, or currencies. They give traders the right, but not the obligation, to buy or sell the underlying asset at a predetermined price before a specific expiration date.
Because of this unique characteristic, options allow traders and investors to design strategies that suit a wide range of market conditions—whether bullish, bearish, or neutral. Through careful strategy selection, one can aim for limited risk with unlimited upside, hedge existing positions, or even profit from sideways markets where prices don’t move much.
This article explores options trading strategies in detail. We’ll cover the building blocks of options, common strategies, advanced combinations, and risk management. By the end, you’ll have a strong foundation to understand how professional traders use options to manage portfolios and generate returns.
1. Basics of Options
Before diving into strategies, it’s important to review some fundamental concepts.
1.1 What is an Option?
Call Option: Gives the holder the right (not obligation) to buy the underlying asset at a predetermined price (strike price) before or on expiration.
Put Option: Gives the holder the right (not obligation) to sell the underlying asset at a predetermined price before or on expiration.
1.2 Key Terms
Premium: The price paid to buy an option.
Strike Price: The agreed price to buy or sell the underlying.
Expiration Date: The last day the option can be exercised.
Intrinsic Value: Difference between underlying price and strike (if favorable).
Time Value: Portion of the premium that reflects time until expiration.
1.3 Options Styles
European Options: Exercisable only at expiration.
American Options: Exercisable any time before expiration.

ETH HnSA Head N Shoulder is being made in ETH in 4hr tf. It is also break a rising trendline support.
Entry- 4395-4400
SL- 4550
Target- One can look to book after one is to one or can also target the recent low it made that is 4200.
Disclaimer- This is just for educational purpose. Please take advice before making any decision.
Jai Shree Ram.

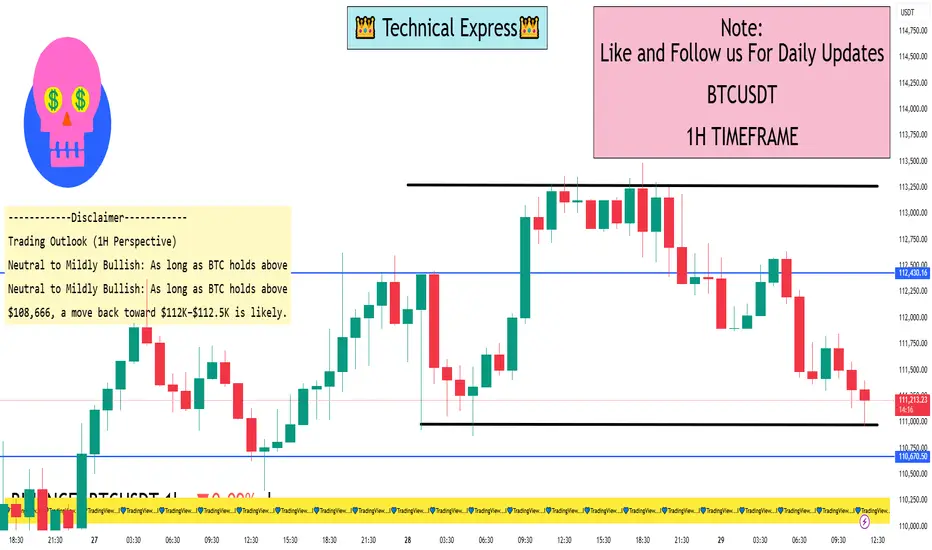
BTC/USDT 1 Hour View1-Hour Technical Snapshot
Key Levels
Support Zones:
~$110,000–$110,600 — viewed as a critical short-term support / demand area. It’s where BTC could stabilize if the current slide continues
~$108,666 — a deeper support level; a break below this risks a pullback toward $101,000, near the 200-day moving average
Resistance Zones:
~$112,000–$112,500 — a key resistance or supply area, with potential selling pressure around this range
~$124,474 — the recent monthly closing high and psychologically significant level; clearing this would be a strong bullish confirmation
Market Sentiment & Setup
Bullish Case: BTC sitting near $111,600 is seen by some analysts as a potential entry zone for a bullish continuation pattern (like a bull flag). A break above $115,544 (20-day SMA) could fuel a push toward $125,000
Bearish Risk: If $108,666 support fails, the risk is for a deeper drop toward $101,000, negating the bullish setup
Other indicator-based technical analysis tools (like TradingView’s technical summary) reflect a neutral bias on 1H charts, while longer-term timeframes lean more bullish
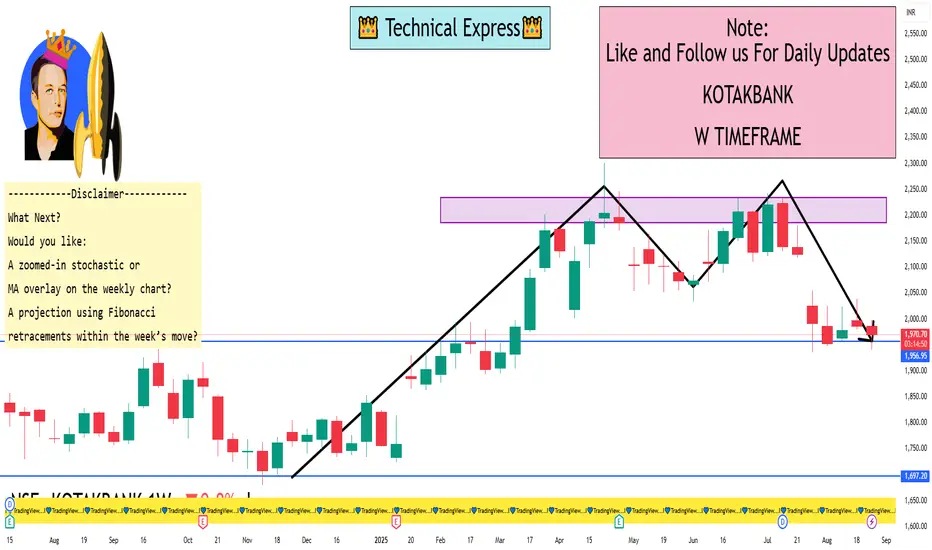
Kotak Mahindra Bank 1 Week ViewWeekly Technical Levels & Analysis
Pivot-Based Levels (from TopStockResearch)
Weekly Support Zones (Standard pivots):
S1: ₹1,964.87
S2: ₹1,943.13
S3: ₹1,906.07
Weekly Resistance Zones:
R1: ₹2,001.93
R2: ₹2,060.73
R3: ₹2,082.47
These pivot levels often act as short-term barriers and support and can help anticipate price behavior within the current weekly range.
Elliott Wave Analysis (from FXStreet)
The stock appears to be beginning Wave 3 in an Elliott Wave count—typically the strongest impulse phase.
The invalidating level for this bullish count is pegged at ₹1,681. As long as the price stays above this, the bullish structure remains valid.
This suggests strong upward potential in the medium term.
TVS Motor Company 1 Day ViewFinancial Overview
I couldn’t retrieve real-time price data through the finance tool, but as of August 29, 2025, here’s what’s visible:
Current trading range: ₹3,238 – ₹3,306 for the day
52-week high: ₹3,349, 52-week low: ₹434
1-Day Key Levels
Pivot Points (as of Aug 29, 2025)
Calculated daily pivot levels provide actionable reference zones:
Standard pivots (Support → Resistance):
S3: ₹3,115.33
S2: ₹3,180.67
S1: ₹3,218.33
Pivot (P): ₹3,283.67
R1: ₹3,321.33
R2: ₹3,386.67
Central Pivot Range (CPR):
Bottom CPR: ₹3,269.83
Top CPR: ₹3,297.50
Fibonacci-based retractions/projections: Highlight retracement levels
Retracement: ₹3,208.70 — ₹3,121.90 — ₹3,051.75
Projection: ₹3,396.30 — ₹3,483.10 — ₹3,553.25
Strategy Perspective (1-Day Frame)
Bullish scenario:
If TVS continues above the pivot zone (₹3,284–₹3,297), next targets include R1 (₹3,321) and possibly the broader resistance bands (~₹3,350–₹3,386).
Bearish scenario:
A drop below ₹3,218–₹3,255 may expose lower supports like ₹3,180 and even ₹3,115.
The “Strong Buy” from Investing.com suggests potential for upward momentum, but the majority of technical indicators lean bearish, signaling caution. Mixed moving-average readings add complexity.

Laxmi Organic Industries Ltd. 1 Day View1-Day Technical Overview & Key Levels
Daily Technical Indicators (Investing.com – Aug 28, 2025)
Overall sentiment: Neutral on the daily timeframe
Indicators:
RSI(14): ~32.74 — signals Sell (approaching oversold)
MACD: –2.49 — Sell
Stochastic: ~35.07 — Sell
Many indicators lean bearish, though the summary remains neutral
Moving Averages (Investing.com – Aug 28, 2025)
Mixed signals:
Sell from MA5, MA10, MA20, MA50.
Buy from MA100, MA200.
Overall: 4 buy vs 8 sell signals from various MAs
Pivot Points & Intraday Levels (Investing.com – Aug 28, 2025)
Classic Pivot:
Support: S1 = ₹207.57, S2 = ₹207.24, S3 = ₹206.83
Pivot: ₹207.98
Resistance: R1 = ₹208.31, R2 = ₹208.72, R3 = ₹209.05
Fibonacci Pivot:
Similar zone: S1 ≈ ₹210.54, Pivot ≈ ₹207.98, R1 ≈ ₹216.99
Suggested Next Steps
Watch price action around ₹205–210 for reversal setups (bullish engulfing, RSI bounce).
A sustained break above ₹213–215 could open the way toward ₹220+.
Conversely, failure to hold ₹205–208 might trigger deeper correction toward ₹200 or below.
Consider combining daily with intraday (hourly/15-minute) to capture momentum early.

Trading Psychology & DisciplineIntroduction
In the world of financial markets, traders often focus on technical analysis, fundamental research, algorithms, and news-driven events to make decisions. While these tools are essential, there is one element that is frequently underestimated yet plays a much bigger role in success: trading psychology and discipline.
Trading is not just about numbers, charts, or strategies—it is a game of emotions, mindset, and self-control. Even the most sophisticated strategies fail if the trader cannot control fear, greed, and impulsive behavior. On the other hand, an average trading system can become profitable in the hands of a disciplined and emotionally balanced trader.
This discussion will explore the psychological aspects of trading, the emotional challenges, common behavioral biases, and how discipline can transform a trader’s performance. We’ll also look at techniques and practices to build a resilient trading mindset.
1. The Role of Psychology in Trading
Trading psychology refers to the emotions and mental state that influence how traders make decisions in the market. Unlike professions where skills and experience directly translate into results, trading is unique because psychological factors often override logic.
For example:
A trader may have a solid strategy to exit a position at a 10% profit. But when the time comes, greed makes them hold longer, hoping for more, and the market reverses.
Another trader may see a perfect setup but doesn’t enter the trade because of fear after a previous loss.
This illustrates that psychology can either support or sabotage trading success. Research shows that 80–90% of retail traders lose money consistently—not always because of poor strategies, but due to a lack of discipline and emotional control.
2. Key Emotional Challenges in Trading
Let’s examine the major psychological challenges that traders face.
a) Fear
Fear is the most dominant emotion in trading. It manifests in different ways:
Fear of losing money (not taking a trade).
Fear of missing out (FOMO—jumping into a trade too late).
Fear of being wrong (holding on to losing positions).
Fear often leads to hesitation, early exits, or missed opportunities.
b) Greed
Greed drives traders to:
Overstay in profitable trades.
Over-leverage positions.
Overtrade (taking too many trades in a day).
While the market rewards patience, greed often blinds judgment.
c) Hope
Many traders fall into the trap of hope, especially with losing trades. Instead of cutting losses, they keep hoping the market will reverse in their favor. Hope replaces rational decision-making.
d) Revenge Trading
After a loss, traders sometimes feel the need to recover money immediately. This leads to impulsive trades without proper setups—often resulting in bigger losses.
e) Overconfidence
Success can be as dangerous as failure. After a winning streak, traders may become overconfident, take unnecessary risks, or abandon risk management—leading to devastating drawdowns.
3. Behavioral Biases in Trading
Trading psychology overlaps with behavioral finance, where human biases cloud rational thinking. Some common biases include:
Loss Aversion Bias – The pain of loss is psychologically stronger than the pleasure of gain. Traders avoid booking small losses, leading to bigger ones.
Confirmation Bias – Traders look only for information that supports their trade idea, ignoring opposing signals.
Anchoring Bias – Traders anchor to a certain price level (like the price they bought at) and refuse to sell below it.
Herd Mentality – Following the crowd without analysis, often during market bubbles.
Recency Bias – Giving more weight to recent outcomes rather than long-term performance.
These biases affect judgment and lead to poor decision-making.
4. The Importance of Discipline in Trading
If psychology is the foundation, discipline is the structure that holds a trader’s career together. Discipline in trading means sticking to rules, risk management, and strategies regardless of emotions.
A disciplined trader:
Enters trades only when rules align.
Exits trades at predefined stop-loss or target levels.
Maintains position sizing regardless of emotions.
Accepts losses as part of the business.
Avoids impulsive and revenge trading.
Discipline converts trading from gambling into a professional business.
5. The Mindset of a Successful Trader
Professional traders think differently from amateurs. They focus on process over outcome. Their mindset includes:
Probability Thinking
No trade is guaranteed. Each trade is just one outcome in a series of probabilities. Accepting this reduces emotional pressure.
Detachment from Money
Professionals see money as a tool, not an emotional anchor. They measure success in terms of following their plan, not short-term profits.
Adaptability
Markets change constantly. Disciplined traders adapt rather than stubbornly sticking to failing strategies.
Patience
They wait for high-probability setups rather than forcing trades.
Long-term Focus
Success is measured in months and years, not a single trade.
6. Building Trading Discipline
Discipline is not automatic—it requires conscious practice. Here’s how traders can develop it:
a) Create a Trading Plan
A trading plan defines:
Entry and exit rules.
Position sizing.
Risk-reward ratios.
Markets and timeframes to trade.
Maximum daily/weekly losses.
Without a plan, emotions take over.
b) Use Risk Management
Risk per trade should never exceed 1–2% of capital. Stop-loss orders should be predefined. This ensures survival even during losing streaks.
c) Keep a Trading Journal
A journal helps track:
Why you entered a trade.
Emotions felt during the trade.
What went right/wrong.
Over time, patterns emerge, revealing weaknesses in psychology and strategy.
d) Practice Mindfulness
Mindfulness techniques such as meditation, deep breathing, or visualization help traders stay calm during stressful market conditions.
e) Accept Losses as Normal
Even the best traders lose frequently. What matters is keeping losses small and letting winners run. Accepting losses removes emotional baggage.
f) Avoid Overtrading
Set daily/weekly limits on trades. This prevents emotional exhaustion and impulsive decisions.
7. Practical Techniques to Improve Trading Psychology
Here are actionable steps:
Pre-Market Routine – Spend 10–15 minutes visualizing scenarios, checking news, and calming the mind.
Set Daily Goals – Focus on execution (e.g., “Follow my plan”) rather than monetary goals.
Take Breaks – Step away after a loss or win streak to reset emotionally.
Limit Screen Time – Over-monitoring leads to anxiety. Check setups at predefined times.
Simulation/Backtesting – Helps build confidence in a system before using real money.
Accountability Partner – Sharing trades with another trader builds discipline.
8. Case Studies: Trading Psychology in Action
Case 1: The Fearful Trader
A new trader avoids trades after a big loss. Despite seeing good setups, fear paralyzes action. Over time, opportunities are missed, and frustration builds.
Lesson: Risk management and small position sizing reduce fear.
Case 2: The Greedy Trader
Another trader doubles account quickly during a bull run, but refuses to book profits. Overconfidence leads to leverage, and one market crash wipes out everything.
Lesson: Discipline and humility are essential.
Case 3: The Disciplined Trader
A professional trader takes 40% win rate trades but manages risk with 1:3 reward ratios. Despite losing more trades than winning, account grows steadily.
Lesson: Discipline beats emotions.
9. The Role of Technology and Psychology
Modern trading platforms provide tools like:
Automated trading systems – Reduce emotional interference.
Alerts and stop-loss automation – Enforce discipline.
Analytics dashboards – Help track performance.
But even with technology, psychology remains the deciding factor, since traders often override systems when emotions take over.
10. Long-Term Development of Trading Mindset
Trading psychology is not built overnight. It requires years of consistent practice. Key long-term practices include:
Reading trading psychology books (e.g., Trading in the Zone by Mark Douglas).
Engaging in regular self-reflection.
Accepting that markets are uncertain.
Developing resilience to handle both drawdowns and success.
The goal is to become a trader who is calm in chaos, rational under stress, and disciplined under temptation.
Conclusion
Trading psychology and discipline are the invisible forces behind every successful trader. Strategies and indicators provide the “how,” but psychology answers the “why” and “when.”
Fear, greed, and biases sabotage results.
Discipline enforces consistency and professionalism.
A strong trading mindset focuses on probabilities, risk management, and patience.
Ultimately, trading is not a battle with the market—it is a battle with oneself. Mastering psychology and discipline transforms trading from an emotional rollercoaster into a structured, profitable business.
As the saying goes:
“In trading, your mind is your greatest asset—or your biggest enemy. The choice is yours.”

Trading Indicators & ToolsIntroduction
Trading in the stock market, forex, commodities, or crypto world is not just about intuition. Successful traders rely on indicators and tools that help them make more informed decisions. These tools act like a map and compass for navigating financial markets, providing signals about when to buy, when to sell, and when to stay on the sidelines.
Without indicators, trading would be like driving a car with your eyes closed – you might move forward, but you’d have no idea what lies ahead. Indicators, on the other hand, help you read market trends, identify opportunities, and manage risks effectively.
In this guide, we’ll explore trading indicators and tools in detail – their types, how they work, strengths and weaknesses, and how traders can combine them for better results.
Chapter 1: What Are Trading Indicators?
A trading indicator is a mathematical calculation based on price, volume, or open interest of a security. These indicators help traders understand market psychology, supply and demand, and price movement patterns.
Indicators are broadly divided into:
Leading Indicators – Predict future price movements (e.g., RSI, Stochastic Oscillator).
Lagging Indicators – Confirm trends after they occur (e.g., Moving Averages, MACD).
Simply put:
Leading indicators = prediction.
Lagging indicators = confirmation.
Chapter 2: Types of Trading Indicators
Let’s explore the major categories.
1. Trend Indicators
These show the direction of the market – whether it’s going up, down, or sideways.
Moving Averages (SMA, EMA): Smooth out price data to identify the overall direction.
MACD (Moving Average Convergence Divergence): Combines moving averages to show trend strength and direction.
Parabolic SAR: Dots above/below candles that signal trend direction and potential reversals.
Use: Trend indicators help traders stay aligned with the broader market direction.
2. Momentum Indicators
These measure the speed of price movements.
RSI (Relative Strength Index): Identifies overbought (>70) and oversold (<30) levels.
Stochastic Oscillator: Compares closing price to price range over time.
CCI (Commodity Channel Index): Detects price deviations from historical averages.
Use: Momentum tools are useful for spotting reversals or confirming trends.
3. Volatility Indicators
These track how much prices are moving up and down.
Bollinger Bands: Price channels based on standard deviation from a moving average.
ATR (Average True Range): Measures overall market volatility.
Keltner Channels: Similar to Bollinger Bands but based on ATR.
Use: Volatility tools help traders decide on stop-loss levels and position sizing.
4. Volume Indicators
These measure the strength of price movements by analyzing trading volume.
OBV (On-Balance Volume): Adds/subtracts volume to confirm price trends.
VWAP (Volume Weighted Average Price): Average price adjusted by volume – key for intraday traders.
Chaikin Money Flow: Tracks buying and selling pressure.
Use: Volume indicators confirm whether trends are strong or weak.
5. Support & Resistance Tools
These identify price zones where markets historically pause or reverse.
Pivot Points: Key levels based on previous high, low, and close.
Fibonacci Retracement: Levels (23.6%, 38.2%, 61.8%) used to predict pullbacks.
Trendlines: Simple but powerful lines drawn across highs/lows.
Use: Excellent for entry, exit, and stop-loss planning.
Chapter 3: Popular Trading Indicators Explained
1. Moving Averages (MA)
Simple Moving Average (SMA): Average of closing prices over a period.
Exponential Moving Average (EMA): Gives more weight to recent prices.
Traders often use Golden Cross (50-day MA crosses above 200-day MA) as bullish and Death Cross as bearish.
2. Relative Strength Index (RSI)
Ranges between 0–100.
Above 70 → Overbought (price may fall).
Below 30 → Oversold (price may rise).
RSI is best used with trend analysis, not as a standalone.
3. Bollinger Bands
Middle band = 20-day SMA.
Upper/lower bands = ±2 standard deviations.
When price touches upper band → Overbought.
When price touches lower band → Oversold.
Traders use “Bollinger Band Squeeze” to spot breakout opportunities.
4. MACD (Moving Average Convergence Divergence)
MACD Line = 12-day EMA – 26-day EMA.
Signal Line = 9-day EMA of MACD.
Histogram shows difference between them.
Crossovers are key signals:
MACD > Signal Line = Bullish.
MACD < Signal Line = Bearish.
5. Fibonacci Retracement
Traders apply Fibonacci ratios (23.6%, 38.2%, 50%, 61.8%) on charts to find support/resistance. It works because many traders watch these levels, creating self-fulfilling prophecies.
6. VWAP (Volume Weighted Average Price)
Commonly used by institutional traders.
VWAP acts as a benchmark price for the day.
Above VWAP → Bullish; Below VWAP → Bearish.
Chapter 4: Essential Trading Tools
Indicators are only half the story. Traders also need tools for execution, analysis, and risk management.
1. Charting Platforms
TradingView, MetaTrader, Thinkorswim, Zerodha Kite.
Offer real-time charts, indicators, drawing tools.
2. Screeners
Stock screeners filter stocks based on volume, price, RSI, moving averages, etc.
Popular: Finviz, Chartink, Screener.in.
3. Order Types & Tools
Market Order, Limit Order, Stop-Loss, Trailing Stop.
Tools like OCO (One Cancels Other) help automate exits.
4. Risk Management Tools
Position size calculators.
Portfolio trackers.
Risk-reward ratio analyzers.
5. News & Data Tools
Bloomberg, Reuters, Economic Calendars.
Vital for event-driven trading.
Chapter 5: How to Use Indicators Effectively
Don’t overload your chart – Too many indicators cause confusion.
Combine wisely – Mix a trend indicator (MA) with a momentum tool (RSI) for confirmation.
Backtest strategies – Check how indicators would have performed historically.
Understand false signals – Indicators aren’t 100% accurate; use stop-loss.
Adapt to market type – Trend indicators work best in trending markets; oscillators in sideways markets.
Chapter 6: Combining Indicators into Strategies
Here are a few proven combinations:
1. Moving Average + RSI
Use MA for trend direction.
Enter when RSI confirms overbought/oversold within trend.
2. Bollinger Bands + MACD
Bands identify volatility.
MACD confirms direction of breakout.
3. Fibonacci + Volume
Use Fibonacci retracement to identify pullback levels.
Confirm with OBV or VWAP for strong buying/selling activity.
Chapter 7: Pros & Cons of Trading Indicators
✅ Advantages
Simplify decision-making.
Provide objective entry/exit signals.
Help manage risk.
Can be automated into strategies.
❌ Disadvantages
Lagging nature (esp. moving averages).
False signals in choppy markets.
Over-reliance can ignore fundamentals.
Need practice and discipline.
Chapter 8: Real-World Application
Day Traders: Focus on VWAP, RSI, Bollinger Bands for intraday moves.
Swing Traders: Rely on Moving Averages, MACD, Fibonacci for 3–15 day trades.
Long-Term Investors: Use 200-day MA, volume indicators, and trendlines.
Algo Traders: Automate strategies using multiple indicators.
Chapter 9: Risk Management with Indicators
Indicators are not just for entries but also for protecting capital.
ATR helps set stop-loss based on volatility.
Support/resistance from Fibonacci prevents premature exits.
Volume indicators confirm whether risk-taking is justified.
Chapter 10: Future of Trading Indicators & Tools
With AI and machine learning, indicators are evolving into smarter systems:
Predictive analytics based on big data.
Sentiment analysis using social media.
AI-driven bots combining multiple signals.
Yet, the core remains the same: indicators help make sense of price action.
Conclusion
Trading indicators and tools are like a trader’s toolbox. Each tool has a purpose – some measure trend, some momentum, some volume, some volatility. The key is not to use all at once, but to understand each, master a few, and combine them smartly.
The most successful traders don’t rely on magic formulas; they rely on discipline, strategy, and the right mix of indicators and tools. Indicators guide you, but your psychology, money management, and consistency decide whether you succeed or fail.
Steady Climb: Gold Confirms Breakout, Support Shifts to 3400We have seen impressive strength on gold with a slow but steady breakout above 3400, confirming a bullish tone in the market. Price has also cleared the previous swing high near 3410, turning this zone into fresh support (3400–3410). Alongside this, the rising trendline support (black line) continues to guide the uptrend, adding confidence to the move.
From a price action perspective, this breakout looks healthy and signals that buyers are gaining control. The next big level to watch is the 3450 zone, which stands as the key breakout area for a larger move higher. On the flip side, as long as 3400–3410 holds, the bullish outlook remains intact.
With both the monthly and weekly closing happening today, the candle close will be crucial in setting the tone for the next leg. A strong close above 3410 would further validate the bullish breakout, while any failure to hold above support could bring some profit-taking. For now, the overall structure favors the bulls.

Part 2 Master Candlestick PatternAdvanced Strategies for Experienced Traders
If you’ve mastered the basics, here are some advanced setups:
Bull Call Spread → Buy 1 Call, Sell higher strike Call.
Bear Put Spread → Buy 1 Put, Sell lower strike Put.
Butterfly Spread → Profit from low volatility (range-bound market).
Calendar Spread → Buy long-term option, sell short-term option.
These strategies help balance risk vs reward.
SEBI Regulations & Margins
In India, SEBI ensures options trading is safe:
Option sellers must keep high margins.
Brokers must collect upfront premiums.
Intraday exposure limits are monitored.
This protects retail traders from excessive risks.

Trading Master Class With ExpertsReal-Life Applications of Options
Options are not just trading tools; they have practical uses:
Insurance companies use options to hedge portfolios.
Exporters/Importers hedge currency risks using options.
Banks use interest rate options to manage risk.
Investors use protective puts to safeguard their stock portfolios.
Psychology of Options Trading
Trading options requires discipline. Many beginners blow up accounts because:
They buy cheap OTM options hoping for jackpots.
They ignore time decay.
They overtrade due to low cost of entry.
A successful option trader thinks like a risk manager first, profit seeker second.
