Part 5 Advance Option Trading Strategies ⭐Understanding Strike Prices
Strike price is the level at which you have the right to buy (CE) or sell (PE).
If the market is at 22,000:
22,000 is ATM (At The Money)
Above 22,000 is OTM (Out of The Money) call
Below 22,000 is ITM (In The Money) call
Strike price decides:
Premium value
Volatility impact
Time decay speed
OTM options are cheap but risky.
ITM options are expensive but stable.
Tradingforliving

Part 4 Institutional Trading VS. Technical AnalysisCall Option (CE) — The Simplest Explanation
A Call Option is a contract that gives you the right to buy at a fixed price.
You buy a CE when you expect:
✔ PRICE will go UP.
Profit Logic:
Price goes ABOVE strike price + premium.
Loss Logic:
Maximum loss is only the premium.

STARHEALTH 1 Week Time Frame 📊 Weekly Price Range (1‑Week History)
High (last week): ~₹469.8
Low (last week): ~₹442.45
(Source: Marketscreener weekly price extremes)
📌 Key Weekly Support Levels
Support zones you may watch on the weekly timeframe:
1. Support 1: ~₹440–₹442 (recent weekly low)
2. Support 2: ~₹430 area (round‑number psychological / pivot cluster)
3. Support 3: ~₹408–₹415 range (broader structural support from pivot supports seen on shorter pivots)
Weakness below ₹430 could open the lower band towards ₹405–₹410.
📌 Key Weekly Resistance Levels
Potential weekly resistance zones to monitor:
1. Resistance 1: ~₹470–₹472 (recent weekly highs & EMA cluster)
2. Resistance 2: ~₹480–₹485 (psychological and medium MA area)
3. Resistance 3: ~₹495+ (upper pivot / longer‑term range top)
A weekly close above ₹480–₹485 would indicate stronger upside pressure.
📈 Technical Indicator Context (Weekly)
RSI and weekly momentum indicators on some platforms suggest neutral‑to‑slightly bullish conditions rather than extreme overbought levels.
Weekly pivot and moving average positions (when available) confirm ₹462–₹470 as an important zone for bullish continuation.

Mastering Emotional Discipline for Long-Term Trading SuccessCan You Control Revenge Trading?
Revenge trading is one of the most common yet destructive behaviors in financial markets. It happens when a trader, after experiencing a loss, immediately tries to “win back” the money by placing impulsive, emotionally driven trades. Instead of following a well-defined strategy, the trader reacts to frustration, anger, fear, or ego. The result is often a spiral of losses that damages not only the trading account but also confidence and mental well-being. The critical question every trader eventually faces is: can you control revenge trading? The answer is yes—but only with awareness, discipline, and structured systems in place.
Understanding Revenge Trading
Revenge trading is rooted in human psychology. When money is lost, the brain interprets it as a threat or injustice, triggering emotional responses similar to anger or anxiety. Traders feel compelled to “fix” the loss quickly, believing that another trade will restore balance. This mindset shifts focus away from probability and risk management toward emotional satisfaction. The market, however, is indifferent to emotions. It does not reward urgency or desperation; it rewards discipline, patience, and consistency.
Revenge trading often shows up in specific patterns: increasing position size after a loss, abandoning stop-loss rules, overtrading in low-quality setups, or trading outside one’s planned timeframe. Many traders recognize these behaviors only after significant damage has been done, which is why controlling revenge trading requires proactive measures rather than reactive regret.
The Cost of Revenge Trading
The financial cost of revenge trading can be severe. One controlled loss can quickly turn into multiple uncontrolled losses, wiping out weeks or months of gains. Beyond money, the psychological cost is equally damaging. Traders may lose confidence in their strategy, begin doubting their skills, or develop anxiety around trading. Over time, this emotional strain can lead to burnout or complete withdrawal from the markets.
Importantly, revenge trading also disrupts learning. Losses are valuable feedback when analyzed objectively, but revenge trading replaces analysis with emotion. Instead of asking “what went wrong?”, the trader asks “how do I get my money back?”—a question that rarely leads to improvement.
Awareness: The First Step to Control
You cannot control what you do not recognize. The first step in controlling revenge trading is self-awareness. Traders must learn to identify their emotional triggers. Common triggers include a sudden large loss, a series of small losses, missing a profitable trade, or seeing others profit while you lose. By journaling trades and emotions, traders can spot patterns between emotional states and poor decisions.
When you notice physical or mental signals—racing heart, frustration, impulsive thoughts, or the urge to place a trade immediately—it is often a warning sign. Awareness creates a pause between emotion and action, and that pause is where control begins.
Building a Rule-Based Trading System
One of the most effective ways to control revenge trading is to rely on a strict, rule-based trading system. Rules remove discretion at moments when emotions are high. These rules should define entry criteria, exit criteria, stop-loss levels, position sizing, and maximum daily loss.
For example, a daily loss limit is a powerful safeguard. If a trader decides in advance that they will stop trading after losing a certain percentage or amount in a day, it prevents emotional spirals. Similarly, fixed position sizing ensures that no single trade—or emotional impulse—can cause catastrophic damage.
The key is commitment. Rules only work if they are followed even when emotions resist them. Many successful traders treat their rules as non-negotiable, similar to safety protocols in aviation or medicine.
Risk Management as Emotional Protection
Risk management is not just about protecting capital; it is about protecting the trader’s psychology. When risk per trade is kept small, losses become easier to accept. A loss that represents 1% of capital feels manageable, while a loss of 10% can trigger panic and revenge behavior.
Proper risk-reward planning also helps. When traders know that one winning trade can cover multiple small losses, they are less likely to feel desperate after a single loss. This probabilistic mindset—understanding that losses are part of the process—reduces emotional attachment to individual trades.
The Power of Taking a Break
Sometimes the best trade is no trade. Stepping away from the screen after a loss can prevent revenge trading entirely. A short break allows emotions to settle and rational thinking to return. Professional traders often schedule mandatory breaks after significant wins or losses, recognizing that emotional extremes—positive or negative—can impair judgment.
Breaks can be structured, such as a rule to stop trading for the day after two consecutive losses, or informal, such as a walk, meditation, or physical exercise. The goal is to reset emotionally before making another decision.
Developing Emotional Discipline
Emotional discipline is a skill that improves with practice. Techniques such as mindfulness, meditation, or breathing exercises can help traders manage stress and remain present. Over time, traders learn to observe emotions without acting on them. This does not mean suppressing emotions, but rather acknowledging them and choosing not to let them dictate actions.
Reframing losses is another powerful tool. Instead of viewing losses as failures, successful traders see them as business expenses or data points. This mindset shift reduces the emotional sting and the urge to retaliate against the market.
Long-Term Perspective and Professional Mindset
Revenge trading thrives on short-term thinking. A long-term perspective weakens its grip. When traders focus on monthly or yearly performance rather than individual trades, losses feel less personal. Professional traders understand that consistency over hundreds of trades matters more than the outcome of any single one.
Adopting a professional mindset also means accepting responsibility. The market is not an enemy to defeat; it is an environment to navigate. Once traders stop blaming the market and start refining their process, emotional reactions naturally decrease.
Conclusion: Yes, You Can Control Revenge Trading
Revenge trading is not a sign of weakness—it is a natural human response to loss. However, allowing it to dictate decisions is a choice. Through awareness, structured rules, disciplined risk management, emotional regulation, and a long-term mindset, traders can control revenge trading and protect both capital and confidence.
Mastering this aspect of trading often marks the transition from a struggling trader to a consistently profitable one. Markets will always test emotions, but those who learn to respond with discipline rather than revenge gain a decisive edge. In the end, controlling revenge trading is less about controlling the market and more about mastering yourself.

Carbon Trading & ESG Investing: Smart, Profitable GrowthIn today’s rapidly evolving global economy, sustainability is no longer just a moral choice—it is a strategic and financial imperative. Carbon Trading and ESG (Environmental, Social, and Governance) Investing stand at the center of this transformation, reshaping how businesses operate, how investors allocate capital, and how economies prepare for a low-carbon future. This powerful combination allows investors and organizations to align profitability with responsibility, creating long-term value while addressing climate change and social impact.
The Rise of Carbon Trading: Pricing Carbon, Protecting the Planet
Carbon trading is a market-based mechanism designed to reduce greenhouse gas emissions by assigning a price to carbon. Governments and regulatory bodies set emission limits, and companies that reduce emissions below their allowed levels can sell surplus carbon credits to those that exceed their limits. This creates a financial incentive for innovation, efficiency, and cleaner technologies.
Carbon markets are expanding rapidly across the world. Compliance markets, such as cap-and-trade systems, are supported by governments, while voluntary carbon markets allow corporations and investors to offset emissions proactively. As climate regulations tighten, carbon credits are increasingly viewed not just as compliance tools but as valuable financial assets. Investors who understand carbon pricing dynamics can tap into a fast-growing market driven by global climate commitments, net-zero targets, and corporate sustainability goals.
ESG Investing: Beyond Profits, Toward Purpose
ESG investing evaluates companies based on three critical pillars:
Environmental impact (carbon footprint, energy efficiency, resource use)
Social responsibility (labor practices, community engagement, diversity)
Governance standards (board structure, transparency, ethical conduct)
Rather than focusing solely on short-term financial returns, ESG investing emphasizes long-term resilience and sustainable growth. Companies with strong ESG practices tend to manage risks better, adapt faster to regulatory changes, and maintain stronger brand trust. For investors, this translates into potentially lower volatility, improved risk-adjusted returns, and alignment with global sustainability trends.
Institutional investors, sovereign funds, and retail investors are increasingly integrating ESG criteria into their decision-making. ESG is no longer a niche concept—it is becoming a core framework for evaluating corporate performance and future potential.
The Powerful Intersection of Carbon Trading and ESG Investing
Carbon trading and ESG investing are deeply interconnected. Carbon emissions are a key environmental metric within ESG analysis, and participation in carbon markets reflects a company’s commitment to climate responsibility. Firms that actively reduce emissions or invest in carbon offsets often score higher on ESG ratings, making them more attractive to sustainability-focused investors.
For investors, carbon markets provide measurable, transparent data on emissions performance. This data enhances ESG analysis, allowing for more informed investment decisions. At the same time, ESG-focused capital flows increase demand for carbon-efficient companies and low-carbon technologies, reinforcing the value of carbon trading mechanisms.
Financial Opportunities in a Low-Carbon Economy
The transition to a low-carbon economy is unlocking vast financial opportunities. Carbon credits, renewable energy projects, clean technology, and sustainability-linked financial instruments are emerging as high-growth areas. Early adopters of carbon trading strategies and ESG portfolios can benefit from structural shifts in global capital allocation.
As governments introduce carbon taxes, stricter disclosure norms, and climate-related financial regulations, companies with weak ESG profiles may face higher costs and reduced access to capital. Conversely, ESG leaders and carbon-efficient businesses are better positioned to attract investment, secure funding, and achieve sustainable profitability.
Risk Management and Long-Term Stability
One of the strongest advantages of combining carbon trading with ESG investing is enhanced risk management. Climate risks, regulatory risks, reputational risks, and social risks can significantly impact financial performance. ESG frameworks help identify and mitigate these risks early.
Carbon pricing adds transparency to climate risk by quantifying emissions exposure. Investors who account for carbon costs are better prepared for policy changes, energy transitions, and market volatility. This proactive approach strengthens portfolio resilience and supports long-term wealth creation.
Corporate Transformation and Competitive Advantage
For businesses, engaging in carbon trading and improving ESG performance is not just about compliance—it is about competitiveness. Companies that invest in clean technologies, improve governance, and adopt responsible social practices often experience operational efficiencies, stronger stakeholder relationships, and enhanced market positioning.
ESG leadership attracts global investors, improves access to capital, and boosts brand credibility. Carbon trading revenues can be reinvested into innovation and sustainability initiatives, creating a virtuous cycle of growth and responsibility.
A Future Driven by Responsible Capital
The future of investing is being shaped by sustainability. Carbon trading and ESG investing are no longer optional trends; they are foundational elements of modern financial strategy. As climate challenges intensify and stakeholder expectations rise, capital will increasingly flow toward businesses and assets that demonstrate environmental stewardship, social responsibility, and strong governance.
For investors, this represents a unique opportunity to participate in global transformation while pursuing competitive returns. For organizations, it is a call to innovate, adapt, and lead.
Conclusion: Invest with Impact, Grow with Purpose
Carbon Trading and ESG Investing together create a powerful pathway where financial growth meets global responsibility. By integrating sustainability into investment strategies, investors can protect portfolios, unlock new opportunities, and contribute meaningfully to a greener, fairer world. This is not just about investing in markets—it is about investing in the future.

Commodity MCX SecretsUnlocking Profitable Trading Opportunities in the Indian Commodity Market
The Multi Commodity Exchange of India (MCX) is the backbone of commodity trading in India, offering a structured, regulated, and transparent platform for trading commodities such as gold, silver, crude oil, natural gas, base metals, and agricultural products. While many traders participate in MCX, only a few consistently succeed. The difference lies in understanding the “secrets” of MCX trading—practical insights, strategies, and risk-management principles that go beyond basic knowledge. These secrets are not shortcuts or illegal tactics; instead, they are a combination of market understanding, discipline, timing, and professional execution.
Understanding the Nature of MCX Commodities
The first secret of MCX trading is recognizing that commodities behave very differently from equities. Commodity prices are directly influenced by global supply-demand dynamics, geopolitical events, currency movements (especially USD-INR), interest rates, weather conditions, and inventory data. For example, gold reacts strongly to inflation expectations, interest rate decisions, and global uncertainty, while crude oil is highly sensitive to OPEC decisions, geopolitical tensions, and inventory reports. Successful MCX traders deeply understand the fundamental drivers of each commodity they trade instead of treating all instruments the same.
Liquidity and Contract Selection
Another crucial MCX secret lies in choosing the right contract. MCX offers multiple contracts with different expiry dates. Professional traders focus on the most liquid contracts, usually the near-month contracts, because they offer tighter bid-ask spreads, better price discovery, and smoother execution. Illiquid contracts can lead to slippage, erratic price moves, and difficulty in exiting positions. Consistency in trading comes from staying where institutional participation is highest.
Timing the Market with Global Cues
MCX may be an Indian exchange, but commodity prices are largely driven by global markets. This means that international trading sessions—especially European and US hours—play a vital role. For energy and metal commodities, the most significant moves often occur after 6:00 PM IST when US markets become active. Experienced MCX traders align their trading hours with global volatility instead of trading randomly throughout the day. They track key global data releases such as US inflation, interest rate decisions, crude oil inventory reports, and employment data to anticipate volatility.
Technical Analysis with Commodity-Specific Adaptation
While technical analysis is widely used in equity trading, applying it blindly to MCX is a common mistake. One of the hidden secrets of MCX trading is adapting technical tools to commodity behavior. Commodities often trend strongly and respect key support and resistance levels more clearly than many stocks. Trend-following indicators like moving averages, RSI, and MACD work well when combined with volume and open interest analysis. Open interest, in particular, is a powerful but underutilized tool in MCX, as it reveals whether money is entering or exiting the market, helping traders confirm the strength of a move.
The Power of Open Interest and Volume
Open interest is one of the most important MCX secrets that retail traders often ignore. Rising prices with rising open interest indicate fresh buying and a strong trend, while rising prices with falling open interest suggest short covering and a potentially weak move. Similarly, falling prices with rising open interest indicate strong short positions. By combining price action, volume, and open interest, traders gain a clearer picture of institutional activity and avoid false breakouts.
Risk Management: The Real Secret to Survival
The biggest secret of long-term success in MCX is not prediction but risk management. Commodity markets are highly leveraged, which can amplify both profits and losses. Professional traders risk only a small percentage of their capital on each trade, strictly follow stop-loss rules, and avoid emotional decision-making. They understand that preserving capital is more important than chasing large profits. Many beginners fail not because their analysis is wrong, but because they overtrade, overleverage, and refuse to exit losing positions.
Understanding Volatility and Position Sizing
Volatility in MCX commodities can change rapidly due to news or global developments. One key secret is adjusting position size according to volatility. When markets are highly volatile, experienced traders reduce their position size to control risk. They also avoid trading during unpredictable events unless they are specifically strategy-driven traders. This flexible approach helps maintain consistency across different market conditions.
Fundamental and Seasonal Insights
Another lesser-known MCX secret is the importance of seasonality. Many commodities follow seasonal patterns based on production cycles, weather, and consumption trends. For example, agricultural commodities are influenced by monsoon patterns, sowing seasons, and harvest cycles, while energy demand varies with weather conditions. Traders who combine seasonal analysis with fundamentals gain a strategic edge by aligning their trades with historically favorable periods.
Discipline and Trading Psychology
Beyond charts and data, the psychological aspect is one of the most powerful MCX secrets. Successful traders maintain discipline, patience, and emotional control. They do not chase the market, revenge trade, or let fear and greed dictate decisions. Instead, they follow predefined trading plans, accept losses as part of the process, and focus on long-term consistency rather than short-term excitement.
Hedging and Professional Use of MCX
MCX is not only a speculative platform but also a powerful hedging tool. Businesses, importers, exporters, and investors use MCX to protect themselves against price fluctuations. Understanding how hedgers operate provides insight into market behavior, especially near expiry. Smart traders observe hedging activity to understand supply-demand pressures and price stability zones.
Conclusion
The true secrets of commodity MCX trading lie in knowledge, preparation, and discipline rather than shortcuts or tips. Understanding the unique behavior of commodities, aligning trades with global cues, using open interest and volume effectively, managing risk professionally, and maintaining psychological control are the foundations of consistent success. MCX rewards traders who treat trading as a business, not a gamble. By mastering these principles, traders can unlock sustainable opportunities in the dynamic and challenging world of commodity markets.

TATASTEEL 1 Month Time Frame 📍 Current Price (approx):
~₹184 – ₹186 per share on NSE (recent session close / live around this area) according to live market data.
🔎 1‑Month Technical Levels (Daily/Short‑Term)
🟢 Immediate Support Levels
These are zones where price tends to attract buying interest on pullbacks:
₹182–₹183 — Immediate first support around recent short‑term pullback lows.
₹178–₹180 — Stronger support band seen from recent swing reactions and range base.
₹172–₹175 — Secondary support if the above breaks, also aligns with short‑term EMA clusters.
👉 Major bullish structure remains intact as long as ₹178–₹180 holds on daily closes.
🔴 Resistance Levels to Watch
These are levels where supply / selling pressure can slow or reverse upside:
₹187–₹188 — Immediate resistance near recent highs (close to 52‑week peak).
₹190–₹192 — Next near‑term target if price decisively breaks above the ₹188 zone.
₹195–₹200 — Higher range resistance area (psychological / medium‑term).
💡 Staying above ₹187–₹188 on a close could open the run toward ₹190+ in the next few weeks.
🧠 Trading & Risk Structure (1‑Month Frame)
Bullish scenario:
✔ Holds above ₹178–₹180 support zone
✔ Clears ₹187–₹188 resistance on closing basis
➡ Upside toward ₹190–₹195 possible
Bearish risk:
⚠ Break and daily close below ₹178
➡ Sellers could push toward ₹172–₹175 support

Price Action Trading: Understanding the Language of the MarketWhat Is Price Action?
Price action refers to the analysis of a market’s price movement using historical price data, primarily through candlestick charts, bar charts, or line charts. Instead of depending on indicators like RSI, MACD, or moving averages, price action traders observe how price behaves at key levels, how candles form, and how buyers and sellers interact.
Price action trading is not about predicting the future with certainty; it is about understanding probabilities and making informed decisions based on how price reacts in specific situations.
Why Price Action Is Important
Price action is important because it is raw and direct. Indicators are derived from price, which means they are often lagging. Price action, on the other hand, gives real-time insight into market behavior.
Key advantages of price action include:
It works in all markets (stocks, forex, commodities, crypto).
It is effective across all timeframes, from intraday to long-term.
It helps traders understand market psychology.
It reduces chart clutter and over-analysis.
It adapts well to changing market conditions.
Because of these qualities, price action is widely used by professional traders, institutional desks, and experienced retail traders.
The Foundation of Price Action
To understand price action, one must first understand market structure. Market structure describes how price moves in trends and ranges.
Uptrend: Higher highs and higher lows
Downtrend: Lower highs and lower lows
Range: Price moves sideways between support and resistance
Recognizing the market structure helps traders decide whether to look for buying opportunities, selling opportunities, or range-based trades.
Support and Resistance in Price Action
Support and resistance are the backbone of price action trading.
Support is a price level where buying interest is strong enough to stop price from falling further.
Resistance is a level where selling pressure prevents price from moving higher.
Price action traders focus on how price reacts at these levels rather than assuming the level will always hold. Strong reactions, rejections, or consolidations near support and resistance provide valuable clues about market intent.
Candlestick Behavior and Storytelling
Candlesticks are the language of price action. Each candle tells a story about the battle between buyers and sellers during a specific time period.
Some important candlestick concepts in price action include:
Large candles: Indicate strong momentum.
Small candles: Suggest indecision or consolidation.
Long wicks: Show rejection of a price level.
Strong closes: Reveal who is in control—buyers or sellers.
Rather than memorizing candle patterns mechanically, effective price action traders focus on context—where the candle forms, at what level, and in which market condition.
Price Action Patterns
Price action patterns emerge from repeated human behavior in markets. Some commonly observed patterns include:
Breakouts and false breakouts
Pullbacks in trends
Reversal formations
Consolidation ranges
However, price action is not about trading patterns blindly. A pattern has meaning only when it aligns with market structure, trend direction, and key price levels.
Trends and Pullbacks
One of the most reliable price action concepts is trading with the trend. In a strong trend, price does not move in a straight line—it advances, pulls back, and then continues.
Price action traders look for:
Shallow pullbacks in strong trends.
Clear rejection signals at trend-support levels.
Continuation moves after consolidation.
This approach allows traders to enter trades with the dominant market force rather than fighting against it.
Breakouts and False Breakouts
Breakouts occur when price moves beyond a well-defined support or resistance level. While breakouts can lead to strong moves, many fail and turn into false breakouts, trapping traders.
Price action helps identify the difference by observing:
Strength of the breakout candle.
Volume and momentum (if available).
Follow-through after the breakout.
Immediate rejection back into the range.
False breakouts are especially valuable because they often lead to sharp moves in the opposite direction.
Market Psychology and Price Action
At its heart, price action is a study of human psychology. Fear, greed, hesitation, and confidence are reflected directly in price movements.
For example:
Rapid price movement shows urgency.
Slow grinding price indicates uncertainty.
Sharp rejections reveal emotional extremes.
Consolidation suggests balance between buyers and sellers.
By understanding these behaviors, traders learn to anticipate where others may panic or become overconfident, creating trading opportunities.
Risk Management in Price Action Trading
Price action is not complete without disciplined risk management. Even the best setups fail. Successful traders focus not on winning every trade but on managing losses and maximizing winners.
Key risk principles include:
Predefined stop-loss levels based on price structure.
Risking a small percentage of capital per trade.
Favorable risk-to-reward ratios.
Avoiding emotional decision-making.
Price action provides logical stop placements because it is based on real price levels rather than arbitrary indicator values.
Simplicity and Mastery
One of the greatest strengths of price action is its simplicity. However, simplicity does not mean easy. Mastery requires:
Screen time and observation.
Patience to wait for high-quality setups.
Emotional control and discipline.
Continuous learning and review.
Price action traders develop confidence not from prediction, but from consistency and clarity.
Conclusion
Price action trading is the art and science of reading the market directly through price movement. It strips away unnecessary complexity and brings the trader closer to the true source of market information. By understanding market structure, support and resistance, candlestick behavior, and market psychology, traders gain a deeper and more reliable framework for decision-making.

Discipline Wins: The Foundation of Consistent Profits for TraderUnderstanding Discipline in Trading
Discipline in trading means the ability to follow a predefined plan regardless of emotions, market noise, or short-term outcomes. It involves executing trades according to rules, managing risk consistently, and accepting losses as a normal part of the process. A disciplined trader does not trade based on excitement, fear, greed, or social influence. Instead, every decision is intentional, measured, and aligned with long-term objectives.
Most traders fail not because their strategy is bad, but because they lack the discipline to execute it properly. They enter early, exit late, increase position size impulsively, or abandon their system after a few losses. Discipline keeps the trader aligned with probability, patience, and process.
Discipline vs. Strategy: Why Discipline Matters More
A common misconception is that success comes from finding the best strategy. In reality, an average strategy executed with strong discipline often outperforms an excellent strategy executed without discipline. Even the most profitable trading systems experience drawdowns. Without discipline, traders interfere with the system during losing phases, destroying its long-term edge.
Discipline ensures consistency in execution. Markets operate on probabilities, not certainties. Only disciplined repetition allows the statistical edge of a strategy to play out over time. Without discipline, randomness dominates results.
Emotional Control: The Core of Discipline
Trading is a psychological game disguised as a financial one. Fear and greed are the two dominant emotions that disrupt discipline. Fear causes traders to exit winning trades too early or avoid valid setups. Greed pushes traders to overtrade, overleverage, or hold positions beyond their logical exit points.
Discipline acts as a shield against emotional decision-making. When traders follow rules instead of emotions, they reduce impulsive behavior. Emotional control does not mean eliminating emotions; it means not acting on them. A disciplined trader feels fear and excitement but still follows the plan.
Risk Management: Discipline in Action
Risk management is where discipline becomes tangible. Consistent traders define their risk before entering a trade and never violate it. This includes setting stop losses, position sizing correctly, and limiting overall exposure.
A disciplined trader understands that capital preservation is more important than profit maximization. One undisciplined trade with excessive risk can wipe out weeks or months of steady gains. By respecting risk limits every time, traders ensure longevity in the market.
Discipline in risk management also means accepting small losses without hesitation. Traders who refuse to take losses often turn small mistakes into catastrophic ones. Discipline turns losses into controlled business expenses rather than emotional failures.
Discipline Creates Consistency, Not Perfection
Consistency in trading does not mean winning every trade. It means producing repeatable behavior and stable performance over time. Discipline ensures that the trader shows up every day with the same mindset, the same rules, and the same respect for the process.
Markets are unpredictable in the short term, but disciplined actions produce predictable results over the long term. This is why professional traders focus more on daily execution quality than on daily profit and loss.
Avoiding Overtrading Through Discipline
Overtrading is one of the biggest account killers. Many traders feel the need to be constantly active, believing that more trades equal more profits. Discipline teaches patience—waiting only for high-quality setups that match predefined criteria.
A disciplined trader understands that not trading is also a trading decision. Sitting out during unclear market conditions protects capital and mental energy. Fewer, well-planned trades often outperform frequent impulsive ones.
Discipline Builds Trust in Yourself
When traders follow their rules consistently, they begin to trust their own process. This self-trust is critical for long-term success. Without it, traders constantly second-guess themselves, jump between strategies, and remain emotionally unstable.
Discipline creates confidence not from winning trades, but from knowing that every action taken was correct according to the plan. Even losing trades feel manageable when they are the result of disciplined execution.
Discipline and Long-Term Thinking
Short-term thinking destroys traders. Focusing on daily profits leads to emotional decisions and unnecessary pressure. Discipline shifts focus toward long-term growth, equity curves, and performance metrics.
Consistent traders treat trading as a business, not a lottery. They measure success in months and years, not hours and days. Discipline aligns actions with long-term sustainability rather than short-term excitement.
Developing Trading Discipline
Discipline is not a talent; it is a skill developed through structure and repetition. Creating a written trading plan, maintaining a trading journal, setting daily rules, and reviewing performance regularly all contribute to stronger discipline.
Routine is a powerful tool. Trading the same markets, at the same time, with the same rules reduces randomness and emotional stress. Discipline grows when actions become habitual rather than reactive.
Discipline Wins in Every Market Condition
Markets change—trending, ranging, volatile, or quiet—but discipline remains constant. Strategies may need adjustment, but disciplined behavior never goes out of style. Traders who rely on discipline adapt calmly, while undisciplined traders panic and overreact.
In volatile markets, discipline prevents emotional blowups. In slow markets, it prevents boredom-driven trades. In winning streaks, it prevents overconfidence. In losing streaks, it prevents revenge trading.
Conclusion: Discipline Is the Real Edge
At its core, discipline is the true competitive advantage in trading. It allows traders to survive uncertainty, manage risk, control emotions, and execute consistently. While indicators, tools, and strategies can be learned by anyone, discipline must be earned through effort and self-awareness.
Consistent profits do not come from predicting the market, but from mastering oneself. Traders who embrace discipline accept that success is built one well-executed decision at a time. In the long run, discipline always wins—because markets reward those who respect process over impulse.

Risk-Free Strategies for TradingMyth, Reality, and Practical Approaches
In trading and investing, the phrase “risk-free strategies” attracts enormous attention. Every participant—whether a beginner or a professional—wants returns without uncertainty. However, in real financial markets, true risk-free trading does not exist. What does exist are risk-minimized, probability-optimized, and hedged strategies that aim to reduce exposure so much that outcomes become highly controlled. Understanding this distinction is critical, because believing in absolute risk-free profits often leads traders to ignore hidden dangers such as liquidity risk, execution risk, regulatory changes, or rare market shocks.
This article explains what “risk-free” really means in trading, why zero-risk is impossible, and how traders can structure low-risk and capital-protected strategies that prioritize consistency, preservation of capital, and controlled returns.
Understanding Risk in Trading
Risk in trading refers to the possibility that actual outcomes differ from expected outcomes, including loss of capital. Risk arises from multiple sources: price volatility, leverage, timing, macroeconomic events, technological failures, and even human psychology. Even government bonds—often called risk-free—carry inflation risk and reinvestment risk.
Therefore, when traders speak of risk-free strategies, they usually mean:
Market-neutral or hedged positions
Defined-risk trades with capped downside
Arbitrage-based inefficiencies
Capital protection through structure, not prediction
These approaches do not eliminate risk entirely, but they shift risk from market direction to execution and management.
Capital Preservation as the Core Principle
The foundation of low-risk trading is capital preservation. Professional traders focus first on avoiding large drawdowns, because recovering from losses is mathematically difficult. A 50% loss requires a 100% gain to break even. Risk-conscious strategies therefore prioritize:
Small position sizing
Pre-defined maximum loss
Consistent expectancy over large samples
Avoidance of leverage abuse
By controlling downside, traders give themselves time—the most valuable asset in markets.
Hedged Trading Strategies
Hedging is one of the most powerful tools for risk reduction. A hedged strategy involves holding positions that offset each other’s risks. For example, when a trader buys one asset and sells a correlated asset, market-wide moves may have limited impact on overall portfolio value.
Common hedging concepts include:
Long–short strategies
Sector-neutral positions
Index hedging against individual stocks
Options-based protection
These strategies reduce directional exposure and focus on relative performance rather than absolute market movement.
Arbitrage and Inefficiency-Based Approaches
Arbitrage strategies attempt to profit from price differences of the same or related instruments across markets or structures. In theory, arbitrage is close to risk-free because it does not rely on price direction. In practice, risks still exist due to:
Execution delays
Transaction costs
Liquidity constraints
Regulatory limitations
Examples include statistical arbitrage, cash-and-carry trades, and inter-exchange spreads. While returns are usually small, consistency can be high when systems are disciplined and costs are controlled.
Defined-Risk Option Structures
Options allow traders to design clearly defined risk profiles. Unlike naked positions, structured option trades cap maximum loss in advance. This makes them attractive for traders seeking controlled outcomes.
Defined-risk option strategies share common features:
Known maximum loss
Known maximum gain
Time-based behavior
Reduced emotional decision-making
Although they are not risk-free, they eliminate catastrophic loss scenarios, which is a major advantage over leveraged directional trades.
Probability-Based Trading
Another approach to minimizing risk is focusing on high-probability setups rather than high returns. Probability-based trading relies on statistics, historical behavior, and repeatable patterns rather than prediction.
Key principles include:
Trading only when odds are strongly favorable
Accepting small frequent gains
Keeping losses rare and limited
Using large sample sizes to smooth outcomes
This approach mirrors how insurance companies operate: individual outcomes vary, but long-term expectancy remains positive.
Cash Management and Risk Allocation
Even the best strategy fails without proper risk allocation. Risk-aware traders never expose their entire capital to a single idea. Instead, they allocate risk per trade as a small percentage of total capital.
Typical capital protection rules include:
Risking only 0.5%–2% per trade
Limiting correlated positions
Maintaining sufficient cash buffers
Avoiding emotional over-trading
By managing exposure, traders transform trading from speculation into a controlled process.
Psychological Risk and Discipline
Psychological risk is often greater than market risk. Fear, greed, overconfidence, and revenge trading can destroy even the safest strategy. Low-risk trading therefore requires discipline and emotional control.
Traders who aim for consistency focus on:
Following rules regardless of recent outcomes
Avoiding impulsive decisions
Accepting small losses without hesitation
Treating trading as a business, not entertainment
Without discipline, even mathematically sound strategies become dangerous.
Technology and Execution Risk
Many so-called risk-free strategies fail due to execution errors rather than market movement. Slippage, delayed orders, system failures, or incorrect position sizing can turn low-risk trades into losses.
Professional traders reduce operational risk by:
Using reliable platforms
Testing strategies extensively
Automating where possible
Maintaining redundancy and monitoring systems
Risk reduction is not only about strategy design, but also about flawless execution.
Realistic Expectations from Low-Risk Trading
Low-risk strategies do not generate spectacular returns. Their strength lies in consistency and survivability. Traders using capital-protected approaches aim for steady compounding rather than rapid growth.
Realistic expectations include:
Modest but repeatable returns
Limited drawdowns
Long-term capital growth
Reduced emotional stress
This mindset separates professional trading from gambling.
Conclusion
Risk-free trading, in the literal sense, is a myth. Markets are complex systems where uncertainty cannot be eliminated. However, risk-minimized trading is very real and achievable through hedging, defined-risk structures, probability-based approaches, disciplined capital management, and strong psychological control.
The most successful traders do not chase perfect certainty. Instead, they build systems where losses are small, outcomes are controlled, and survival is guaranteed even during adverse conditions. In the long run, the trader who protects capital and respects risk will always outperform the trader who seeks shortcuts.

Mastering the Market Mindset1. Understanding the Importance of Market Mindset
Trading and investing success depends more on psychology than strategy.
Even the best technical or fundamental system fails without emotional control.
Market mindset refers to how you think, react, and decide under uncertainty.
A strong mindset allows traders to survive losses, manage risk, and stay consistent.
Professionals focus on process over profits, while amateurs chase quick gains.
2. Accepting Uncertainty as a Core Market Reality
Markets are inherently uncertain; no setup guarantees success.
Every trade is a probability game, not a prediction.
Accepting uncertainty removes fear and hesitation.
Traders who accept randomness focus on risk–reward, not outcomes.
Emotional stability comes from knowing losses are part of the business.
3. Shifting from Outcome-Based to Process-Based Thinking
Beginners judge success by profits; professionals judge success by discipline.
A good trade can lose, and a bad trade can win.
Focus on executing your plan correctly, not on individual trade results.
Consistent execution leads to long-term profitability.
Journaling helps reinforce process-oriented behavior.
4. Developing Emotional Control
Fear and greed are the biggest enemies of traders.
Fear leads to early exits and missed opportunities.
Greed leads to overtrading and oversized positions.
Emotional control is built through preparation, not willpower.
Pre-defined rules reduce emotional decision-making.
5. Mastering Loss Acceptance
Losses are business expenses, not personal failures.
Avoid revenge trading after a loss.
Detach ego from trading performance.
Small losses protect capital and confidence.
Successful traders respect stop-losses religiously.
6. Building Discipline Through Rules
Discipline means following rules even when emotions disagree.
A written trading plan is essential.
Entry, exit, position sizing, and risk rules must be predefined.
Discipline transforms trading from gambling into a profession.
Consistency comes from repeating disciplined actions.
7. Risk Management as a Mental Framework
Risk management is psychological protection.
Limiting risk per trade prevents emotional damage.
Capital preservation should be the first priority.
Professionals think in terms of maximum acceptable loss.
Survival mindset ensures long-term participation in markets.
8. Developing Patience and Selectivity
Not trading is also a trading decision.
Overtrading often comes from boredom or fear of missing out (FOMO).
High-quality setups matter more than frequency.
Waiting for confirmation builds confidence.
Patience separates professionals from amateurs.
9. Overcoming Fear of Missing Out (FOMO)
Markets offer endless opportunities.
Missing one trade does not reduce long-term potential.
Chasing price usually leads to poor risk–reward trades.
Discipline protects traders from emotional impulsiveness.
Focus on your plan, not market noise.
10. Managing Winning Streaks
Success can be as dangerous as failure.
Overconfidence leads to oversized positions.
Maintain the same rules during winning streaks.
Professionals stay humble and grounded.
Markets punish arrogance quickly.
11. Handling Drawdowns Effectively
Every trader experiences drawdowns.
Emotional reaction to drawdowns defines long-term success.
Reduce position size during difficult periods.
Analyze mistakes objectively, not emotionally.
Confidence returns through disciplined execution.
12. Developing a Long-Term Perspective
Markets reward consistency over time.
Short-term results are misleading.
Think in terms of hundreds of trades, not individual ones.
Long-term thinking reduces emotional pressure.
Compounding works best with patience.
13. Self-Awareness and Psychological Strength
Know your emotional triggers.
Identify patterns of impulsive behavior.
Trading mirrors personal strengths and weaknesses.
Self-awareness allows continuous improvement.
Mental discipline grows with experience and reflection.
14. Detaching Identity from Trading Results
You are not your P&L.
Losing trades do not define intelligence or worth.
Emotional detachment improves decision quality.
Professionals treat trading as a business, not a personal test.
Confidence comes from preparation, not results.
15. Creating a Structured Trading Routine
Routine builds psychological stability.
Pre-market analysis reduces anxiety.
Post-market review strengthens learning.
Consistency in routine improves discipline.
Structure reduces emotional chaos.
16. Avoiding External Noise and Opinions
Media headlines increase emotional volatility.
Too many opinions create confusion.
Trust your analysis and plan.
Professional traders filter information selectively.
Clarity improves execution.
17. Building Confidence Through Preparation
Confidence is earned, not assumed.
Backtesting and practice reduce uncertainty.
Preparation removes hesitation during live trading.
Knowledge strengthens emotional control.
Confidence leads to decisive action.
18. Continuous Learning and Adaptability
Markets evolve; mindset must evolve too.
Flexibility prevents rigidity and ego-driven mistakes.
Learning from mistakes builds resilience.
Adaptation is a psychological skill.
Growth mindset keeps traders competitive.
19. Developing Mental Resilience
Resilience allows recovery from setbacks.
Emotional endurance is critical in volatile markets.
Strong mindset absorbs stress without collapse.
Mental fitness improves with experience.
Resilient traders stay calm during chaos.
20. Aligning Mindset with Market Reality
Markets do not reward effort, only execution.
Discipline beats intelligence in trading.
Emotional mastery leads to consistency.
Market mindset is a continuous journey, not a destination.
Mastering mindset is the true edge in financial markets.
Conclusion
Mastering the market mindset is the foundation of long-term trading and investing success. Strategies may change, markets may evolve, but psychological discipline, emotional control, and risk awareness remain timeless. Traders who focus on mindset development gain a sustainable edge that compounds over time—turning uncertainty into opportunity and discipline into profitability.
Part 1 Master Candle Stick Patterns Risks in Option Trading
Options require deep understanding. Some risks include:
A. Time Decay (Theta)
Option value reduces every day.
B. Volatility Crush
Premium falls rapidly when volatility decreases (common after events).
C. Low Liquidity
Wider bid–ask spreads can increase trading cost.
D. Large Losses for Sellers
Shorting options without hedges can be very risky.
E. Emotional Trading
High leverage leads to overtrading.

Part 10 Trade Like Institutiona Protective Put & Married Put
Protective Put
Hold stock
Buy put
Acts like insurance.
Married Put
Buy stock + Buy put simultaneously
Useful in high-risk environments.

Understanding the Psychology Behind Financial Decision-Making1. Meaning and Concept of Behavioral Finance
Behavioral finance studies how psychological factors affect investors’ decision-making processes.
It challenges the traditional assumption that investors always act rationally and logically.
The field explains why investors often make systematic errors in judgment.
It focuses on understanding anomalies in financial markets that cannot be explained by classical theories.
2. Traditional Finance vs Behavioral Finance
Traditional finance assumes rational investors and efficient markets.
It relies on models such as Efficient Market Hypothesis (EMH) and Modern Portfolio Theory (MPT).
Behavioral finance argues that investors are influenced by emotions and mental shortcuts.
It explains market bubbles, crashes, overreactions, and underreactions.
3. Role of Psychology in Finance
Human psychology plays a critical role in financial decision-making.
Emotions such as fear, greed, hope, and regret impact investment choices.
Investors often rely on intuition rather than objective analysis.
Psychological tendencies lead to predictable patterns of behavior in markets.
4. Cognitive Biases in Behavioral Finance
Cognitive biases are systematic errors in thinking that affect judgments.
These biases arise due to limited information-processing abilities.
They cause investors to misinterpret information and make irrational decisions.
Behavioral finance categorizes biases into cognitive and emotional biases.
5. Overconfidence Bias
Investors tend to overestimate their knowledge and predictive abilities.
Overconfidence leads to excessive trading and risk-taking.
It often results in lower returns due to higher transaction costs.
Traders believe they can outperform the market consistently.
6. Herd Behavior
Herd behavior occurs when investors follow the actions of others.
Decisions are made based on crowd behavior rather than independent analysis.
This bias contributes to market bubbles and crashes.
It is common during bull markets and panic-selling phases.
7. Loss Aversion
Loss aversion means investors feel losses more strongly than gains.
The pain of losing ₹1,000 is greater than the pleasure of gaining ₹1,000.
Investors hold losing positions too long to avoid realizing losses.
This bias leads to poor portfolio performance and risk mismanagement.
8. Anchoring Bias
Anchoring occurs when investors rely heavily on initial information.
Past prices often act as anchors for future decisions.
Investors may refuse to sell below their purchase price.
This prevents objective evaluation of current market conditions.
9. Confirmation Bias
Investors seek information that confirms their existing beliefs.
Contradictory data is ignored or undervalued.
This bias reinforces incorrect assumptions and poor decisions.
It limits learning and adaptability in dynamic markets.
10. Availability Bias
Decisions are influenced by easily available or recent information.
Investors give more importance to news that is memorable or sensational.
Media coverage strongly affects investment choices.
This bias leads to overreaction to short-term events.
11. Mental Accounting
Investors treat money differently based on its source or purpose.
For example, profits are treated differently from salary income.
This leads to inefficient allocation of capital.
Rational portfolio management is compromised.
12. Prospect Theory
Developed by Daniel Kahneman and Amos Tversky.
Explains how people evaluate gains and losses asymmetrically.
Investors are risk-averse in gains and risk-seeking in losses.
It forms the foundation of behavioral finance.
13. Market Anomalies Explained by Behavioral Finance
Behavioral finance explains anomalies like momentum and reversals.
It explains why stock prices deviate from intrinsic value.
Investor sentiment causes mispricing in markets.
These anomalies persist due to limits to arbitrage.
14. Behavioral Finance and Market Bubbles
Excessive optimism leads to asset price bubbles.
Herd behavior and overconfidence fuel rapid price increases.
When reality sets in, panic selling causes crashes.
Examples include stock market bubbles and real estate booms.
15. Behavioral Finance in Trading
Traders are influenced by emotions during volatile markets.
Fear leads to premature exits, while greed leads to overtrading.
Behavioral awareness improves discipline and consistency.
Successful traders manage emotions alongside strategies.
16. Behavioral Finance in Investing
Long-term investors also suffer from biases.
Emotional reactions affect asset allocation and rebalancing.
Behavioral mistakes reduce long-term wealth creation.
Systematic investment plans help reduce emotional impact.
17. Role of Behavioral Finance in Portfolio Management
Portfolio construction considers investor psychology.
Risk tolerance is influenced by emotional comfort, not just numbers.
Behavioral profiling helps customize portfolios.
It improves investor satisfaction and adherence.
18. Behavioral Finance in Indian Markets
Indian markets show strong retail investor participation.
Herd behavior is common during IPOs and trending stocks.
News and social media heavily influence sentiment.
Behavioral finance is crucial for understanding market volatility in India.
19. Importance of Behavioral Finance for Financial Advisors
Advisors must understand client psychology.
Emotional coaching is as important as financial planning.
It helps prevent panic decisions during market downturns.
Builds long-term trust and better outcomes.
20. Managing Behavioral Biases
Awareness is the first step in controlling biases.
Having predefined rules reduces emotional decisions.
Diversification and discipline improve rationality.
Regular review and reflection help correct mistakes.
21. Criticism of Behavioral Finance
Some argue it lacks precise mathematical models.
Behavioral explanations may seem subjective.
Not all market movements can be explained psychologically.
Still, it complements traditional finance effectively.
22. Future of Behavioral Finance
Increasing relevance with retail investor growth.
Technology and AI incorporate behavioral insights.
Behavioral finance will shape investment education.
It will continue bridging the gap between theory and reality.
23. Conclusion
Behavioral finance provides a realistic view of financial markets.
It acknowledges human limitations and emotional influences.
Understanding behavioral finance improves decision-making.
It is essential for traders, investors, and policymakers in modern markets.

CHART PATTERNSChart patterns reflect collective market behaviour over periods—from hours to days to months.
They help traders predict continuation or reversal of trends.
Two broad types:
A. Continuation Patterns (trend likely to continue)
B. Reversal Patterns (trend likely to reverse)
Support–Resistance and Breakouts
Most chart patterns rely on:
Breakout levels
Necklines
Trendlines
Horizontal supports/resistances
A breakout is more reliable with:
Above-average volume
Retest confirmation
Trend alignment
Strong candle close beyond levels

Part 2 Candle Stick Patterns Understanding Options Trading
In order to understand options trading completely here are a few concepts or key terms you should know about:
1.Derivatives: Futures and Options are derivative contracts. Meaning that they are contracts that are set between two or more parties and derive their value from an underlying asset, group of assets or a benchmark in the market.
2. Call and Put options: A call option gives you the right but not the obligation to buy an underlying asset at a predetermined price at a certain expiration date, while a put option allows you to sell an underlying security at a future date and price.
3. Expiration Date: This is the date on which the options contract expires. On this day the trader can choose if they wish to exercise the contract at its strike price.
4. Strike Price: This is the predetermined price at which you can buy the options contract. The strike price decides if an option has an intrinsic value.

Pair Trading and Statistical ArbitrageMarket-Neutral Strategies for Consistent Alpha
Pair trading and statistical arbitrage are advanced trading strategies rooted in quantitative analysis, probability, and mean reversion. Unlike directional trading, which depends on predicting whether markets will rise or fall, these strategies focus on relative price movements between securities. Their core strength lies in being market-neutral, meaning profits can be generated in both bullish and bearish market conditions if executed with discipline and robust statistical models.
Understanding Pair Trading
Pair trading is one of the simplest and most widely used forms of statistical arbitrage. It involves identifying two highly correlated or economically related instruments—such as stocks from the same sector, index constituents, or companies with similar business models—and trading the price divergence between them.
The basic logic is straightforward:
When two related assets historically move together, any temporary divergence from their normal relationship is assumed to be temporary.
The trader simultaneously buys the underperforming asset and sells the outperforming asset.
When prices revert to their historical relationship, the trader exits both positions, capturing the spread profit.
For example, if two banking stocks that typically trade in tandem suddenly diverge due to short-term news or market inefficiency, pair trading seeks to exploit that mispricing rather than predicting overall market direction.
Core Principles Behind Pair Trading
The effectiveness of pair trading depends on several statistical and economic assumptions:
Correlation and Cointegration
While correlation measures how two assets move together, cointegration goes a step further by ensuring that their price relationship remains stable over time. Successful pair trading strategies rely more on cointegration than simple correlation.
Mean Reversion
Pair trading assumes that deviations from the historical price spread are temporary. The spread eventually reverts to its mean due to market forces, arbitrage, or fundamental alignment.
Simultaneous Long and Short Positions
By holding both long and short positions, the trader minimizes exposure to broader market movements, interest rate changes, or macroeconomic shocks.
What Is Statistical Arbitrage?
Statistical arbitrage is a broader, more sophisticated extension of pair trading. While pair trading usually focuses on two securities, statistical arbitrage may involve dozens, hundreds, or even thousands of instruments. It relies heavily on quantitative models, historical data analysis, and automated execution.
Statistical arbitrage strategies search for probabilistic mispricings rather than guaranteed arbitrage opportunities. These mispricings are identified using statistical techniques such as:
Regression analysis
Z-scores
Principal component analysis (PCA)
Machine learning models
Time-series forecasting
The objective is to exploit small pricing inefficiencies repeatedly, generating consistent returns over time.
How Statistical Arbitrage Works in Practice
A statistical arbitrage system typically follows a structured workflow:
Data Collection and Cleaning
Large volumes of historical price, volume, and sometimes fundamental data are gathered and standardized.
Model Construction
Quantitative models are developed to identify relationships, predict expected returns, and estimate deviations from equilibrium.
Signal Generation
Trading signals are generated when prices move beyond statistically significant thresholds, such as when a Z-score exceeds ±2.
Risk Management and Position Sizing
Positions are sized dynamically to maintain portfolio neutrality and control volatility.
Automated Execution
Because inefficiencies can be short-lived, trades are often executed algorithmically to minimize slippage and latency.
Key Differences Between Pair Trading and Statistical Arbitrage
While closely related, the two approaches differ in scope and complexity:
Pair Trading focuses on two assets and is easier to understand and implement.
Statistical Arbitrage operates at the portfolio level and may involve multiple asset classes.
Pair trading can be discretionary or semi-systematic, whereas statistical arbitrage is usually fully systematic and model-driven.
Statistical arbitrage often requires advanced computing power, robust backtesting, and continuous model refinement.
Despite these differences, both strategies share the same philosophical foundation: exploiting market inefficiencies through statistical evidence rather than speculation.
Advantages of Market-Neutral Strategies
Pair trading and statistical arbitrage offer several compelling advantages:
Reduced Market Risk
Since positions are hedged, overall market direction has limited impact on returns.
Consistency Across Market Cycles
These strategies can perform in volatile, range-bound, or trending markets.
Diversification Benefits
They complement traditional directional strategies and reduce portfolio volatility.
Objective Decision-Making
Trades are based on data and statistical thresholds, minimizing emotional bias.
Risks and Challenges
Despite their appeal, these strategies are not risk-free:
Model Risk: Historical relationships may break down due to structural changes, regulation, or company-specific events.
Execution Risk: Slippage, transaction costs, and liquidity constraints can erode profits.
Crowding Risk: Popular pairs and models may become overcrowded, reducing effectiveness.
Tail Risk: Extreme market events can cause correlations to collapse, leading to unexpected losses.
Successful practitioners continuously monitor performance and adapt models to evolving market conditions.
Risk Management in Pair Trading and Statistical Arbitrage
Effective risk management is critical. Common techniques include:
Stop-loss limits on spread deviations
Time-based exits if convergence fails
Diversification across multiple pairs or strategies
Dynamic rebalancing and volatility targeting
Position sizing based on statistical confidence rather than fixed capital allocation further enhances stability.
Role of Technology and Automation
Modern statistical arbitrage is inseparable from technology. High-quality data feeds, backtesting frameworks, and automated execution systems are essential. Machine learning and artificial intelligence are increasingly used to detect nonlinear relationships and adapt to changing market regimes.
However, complexity does not guarantee success. Simpler, well-tested models with disciplined execution often outperform overly complex systems.
Conclusion
Pair trading and statistical arbitrage represent a powerful class of quantitative, market-neutral strategies designed to profit from relative mispricing rather than market direction. Pair trading offers a focused, intuitive entry point, while statistical arbitrage scales the concept into a diversified, model-driven approach suitable for professional and institutional traders.
When supported by strong statistical validation, disciplined risk management, and continuous monitoring, these strategies can deliver consistent alpha across market cycles. In an increasingly efficient and competitive trading environment, pair trading and statistical arbitrage remain essential tools for traders seeking precision, objectivity, and long-term sustainability in the financial markets.

Understanding Market Phases to Anticipate the FutureOutlook Cycle Secrets
In the world of investing, trading, and economic decision-making, success is rarely driven by luck alone. It is shaped by the ability to understand where the economy and markets stand in a broader cycle and how that position influences future outcomes. The concept of the outlook cycle refers to the recurring phases through which economies, industries, and financial markets move over time. These cycles are not random; they are influenced by human behavior, policy decisions, capital flows, innovation, and external shocks. Unlocking the “secrets” of the outlook cycle allows investors, businesses, and policymakers to make informed, forward-looking decisions rather than reacting emotionally to headlines.
What Is an Outlook Cycle?
An outlook cycle represents the collective expectations about the future—growth, inflation, profits, employment, and stability—and how those expectations evolve over time. Markets are inherently forward-looking. Prices today often reflect what participants believe will happen six months, one year, or even several years ahead. As expectations rise or fall, they drive asset prices, capital allocation, and risk appetite.
Typically, outlook cycles align with broader economic cycles and can be divided into four main phases: recovery, expansion, slowdown, and contraction. Each phase carries distinct characteristics in terms of sentiment, liquidity, policy stance, and asset performance. Understanding these phases is the foundation of mastering outlook cycle dynamics.
Phase One: Recovery – The Birth of Optimism
The recovery phase begins after a downturn or crisis. Economic data is still weak, unemployment may be high, and corporate earnings are often depressed. However, the outlook starts to improve because the pace of deterioration slows. This is a crucial secret of the outlook cycle: markets often bottom out when conditions look the worst, not when they look good.
During recovery, central banks usually maintain accommodative policies such as low interest rates and liquidity support. Governments may introduce stimulus measures to revive growth. Investor sentiment remains cautious, but early movers begin positioning for future improvement. Historically, equities and risk assets perform strongly in this phase because valuations are low and expectations are modest.
The key insight here is that improving expectations matter more than absolute conditions. Those who wait for “clear confirmation” often miss the most powerful part of the cycle.
Phase Two: Expansion – Confidence Takes Control
Expansion is the most comfortable and visible phase of the outlook cycle. Economic growth becomes broad-based, corporate earnings rise, employment improves, and consumer confidence strengthens. Credit flows freely, business investment increases, and innovation accelerates.
Market sentiment during expansion is optimistic. Risk appetite is high, and capital rotates into equities, commodities, and growth-oriented sectors. Media narratives reinforce positive outlooks, often highlighting long-term growth stories and structural transformations.
However, one of the hidden secrets of the outlook cycle is that the seeds of future slowdown are often planted during expansion. Excessive leverage, asset bubbles, rising costs, and overconfidence can quietly build beneath the surface. While expansion can last for years, it is also the phase where discipline becomes most important.
Phase Three: Slowdown – The Turning Point
The slowdown phase is subtle and often misunderstood. Growth does not collapse immediately; instead, it decelerates. Inflationary pressures may rise, prompting central banks to tighten monetary policy. Interest rates increase, liquidity conditions tighten, and borrowing becomes more expensive.
Corporate margins may start to compress as costs rise faster than revenues. Leading indicators—such as purchasing manager indices, yield curves, and credit spreads—begin to signal stress even while headline economic data still looks healthy.
The critical secret in this phase is recognizing that markets respond to the rate of change, not the level. Even strong growth can lead to weak market performance if expectations peak and begin to decline. Defensive sectors, quality assets, and cash preservation strategies become increasingly important during this stage.
Phase Four: Contraction – Fear and Opportunity
Contraction is marked by falling economic output, declining profits, rising unemployment, and reduced consumer spending. Sentiment turns pessimistic, risk appetite collapses, and capital seeks safety. This phase often follows a policy mistake, financial imbalance, or external shock such as geopolitical conflict or a global crisis.
While contraction is emotionally difficult, it holds some of the most powerful opportunities for long-term investors. Valuations reset, inefficient businesses are cleared out, and new cycles begin to form. Policy responses—rate cuts, stimulus packages, and reforms—lay the groundwork for the next recovery.
The ultimate outlook cycle secret is this: every contraction contains the blueprint for the next expansion. Those who can detach emotionally and focus on long-term fundamentals are best positioned to benefit.
The Role of Psychology in Outlook Cycles
Human psychology plays a central role in shaping outlook cycles. Fear and greed amplify market movements, often pushing prices far beyond intrinsic value in both directions. During expansions, optimism can become complacency. During contractions, fear can turn into despair.
Understanding behavioral biases—such as herd mentality, confirmation bias, and loss aversion—helps decode why outlook cycles tend to overshoot. Markets do not simply reflect economic reality; they reflect collective belief systems about the future.
Using Outlook Cycles as a Strategic Tool
Mastering outlook cycle secrets is not about predicting exact tops or bottoms. It is about positioning intelligently across phases. Traders may focus on short-term momentum shifts, while long-term investors align portfolios with the dominant phase of the cycle.
Diversification, risk management, and flexibility are essential. As cycles evolve, so should strategies. Static thinking is one of the biggest enemies of success in cyclical markets.
Conclusion: Thinking Ahead of the Crowd
The outlook cycle is a powerful framework for understanding how economies and markets evolve over time. By focusing on expectations, sentiment, policy direction, and the rate of change rather than headlines alone, one can gain a meaningful edge.
The real secret lies in thinking independently and ahead of the crowd—buying when optimism is scarce, exercising caution when confidence is excessive, and always remembering that cycles are inevitable. Those who respect the rhythm of the outlook cycle are better equipped not only to protect capital but also to grow it consistently across changing market environments.

Two Powerful Approaches to Understanding Financial MarketsTechnical Analysis vs Fundamental Analysis
In the world of trading and investing, decision-making is driven by analysis. Among the many methods available, technical analysis and fundamental analysis stand out as the two most widely used and debated approaches. Both aim to identify profitable opportunities in financial markets, yet they differ significantly in philosophy, tools, time horizon, and interpretation of market behavior. Understanding the strengths, limitations, and appropriate use of each method is essential for traders and investors seeking consistency and clarity in their strategies.
Understanding Technical Analysis
Technical analysis is the study of price movements, volume, and market patterns to forecast future price behavior. It is based on the belief that all available information—economic, political, and psychological—is already reflected in the price. Therefore, instead of focusing on why a price moves, technical analysts focus on how it moves.
At its core, technical analysis relies on charts and indicators. Traders examine historical price data to identify trends, support and resistance levels, chart patterns, and momentum signals. Common tools include moving averages, Relative Strength Index (RSI), MACD, Bollinger Bands, Fibonacci retracements, and candlestick patterns.
One of the foundational principles of technical analysis is that price trends tend to repeat due to human psychology. Fear, greed, hope, and panic create recognizable patterns over time. For example, breakouts, pullbacks, and reversals often occur in similar ways across different markets and time frames.
Technical analysis is especially popular among short-term traders, such as intraday traders, scalpers, and swing traders. These participants need precise entry and exit points, which technical tools provide. Since technical analysis can be applied to any tradable instrument—stocks, forex, commodities, cryptocurrencies, or indices—it is highly versatile.
However, technical analysis has limitations. Indicators are often derived from past prices, which means they can lag in fast-moving markets. False breakouts and whipsaws can lead to losses if risk management is poor. Additionally, technical analysis does not directly account for major fundamental events such as earnings surprises, policy changes, or geopolitical shocks.
Understanding Fundamental Analysis
Fundamental analysis focuses on evaluating the intrinsic value of an asset by examining economic, financial, and qualitative factors. The goal is to determine whether an asset is undervalued, fairly valued, or overvalued compared to its current market price.
In stock markets, fundamental analysis involves studying a company’s financial statements, including revenue, profit, cash flow, debt, and margins. Key metrics such as earnings per share (EPS), price-to-earnings (P/E) ratio, return on equity (ROE), and growth rates play a crucial role. Beyond numbers, analysts also assess management quality, competitive advantage, industry position, and long-term business sustainability.
In other markets, such as forex or commodities, fundamental analysis revolves around macroeconomic indicators. Interest rates, inflation, GDP growth, trade balances, central bank policies, and global supply-demand dynamics are central to valuation.
Fundamental analysis is most commonly used by long-term investors and positional traders. These market participants believe that, over time, prices will converge toward intrinsic value. For example, an investor may buy shares of a fundamentally strong company during temporary market weakness and hold them for years.
The strength of fundamental analysis lies in its ability to identify long-term wealth creation opportunities. It helps investors stay aligned with economic reality and business performance rather than short-term market noise.
However, fundamental analysis also has drawbacks. Markets can remain irrational longer than expected, meaning undervalued assets may stay undervalued for extended periods. Fundamental data is often released quarterly or monthly, making it less useful for short-term timing. Additionally, interpreting fundamentals requires assumptions about future growth, which may not always materialize.
Key Differences Between Technical and Fundamental Analysis
The most important difference between the two approaches lies in their focus. Technical analysis focuses on price behavior and market action, while fundamental analysis focuses on underlying value and financial strength.
Another major distinction is time horizon. Technical analysis is generally used for short- to medium-term trades, whereas fundamental analysis is better suited for medium- to long-term investments.
The data used also differs. Technical analysts rely on charts, indicators, and price history, while fundamental analysts study financial statements, economic reports, and industry trends.
In terms of decision-making, technical analysis emphasizes timing—when to enter and exit—while fundamental analysis emphasizes selection—what to buy or sell.
Which Is Better: Technical or Fundamental Analysis?
The debate over which approach is superior has existed for decades, but the reality is that neither is universally better. Their effectiveness depends on the trader’s goals, personality, and market conditions.
Short-term traders often prefer technical analysis because price movements and momentum matter more than long-term value in the near term. Long-term investors tend to rely on fundamental analysis because business performance and economic growth drive returns over time.
Many successful market participants adopt a hybrid approach, combining both methods. For example, an investor may use fundamental analysis to identify strong companies and then apply technical analysis to time entries and exits. This combination helps align value with market timing, reducing risk and improving consistency.
Conclusion
Technical analysis and fundamental analysis represent two different lenses through which financial markets can be understood. Technical analysis interprets market behavior through price and patterns, making it ideal for timing and short-term strategies. Fundamental analysis evaluates intrinsic value and economic strength, making it essential for long-term investment decisions.
Rather than viewing them as opposing philosophies, traders and investors should see them as complementary tools. Mastering both provides a deeper, more balanced understanding of markets, enabling better decisions across different market phases. In a complex and ever-changing financial world, the ability to adapt and integrate multiple perspectives is often the true edge.

Leveraged and Margin Trading: Opportunities and RisksUnderstanding Margin Trading
Margin trading refers to the practice of borrowing funds from a broker to trade financial assets. The trader contributes a portion of the total trade value, known as the initial margin, while the broker finances the remaining amount. The borrowed funds are secured against the trader’s existing capital or securities, which act as collateral.
For example, if a broker requires a 20% margin, a trader can control a ₹10,00,000 position by investing only ₹2,00,000 of their own money. The remaining ₹8,00,000 is borrowed. This structure allows traders to increase market exposure without committing the full capital upfront.
However, margin trading comes with obligations. Brokers impose a maintenance margin, which is the minimum equity that must be maintained in the account. If losses reduce the account balance below this level, the broker issues a margin call, requiring the trader to add funds or close positions. Failure to do so may result in forced liquidation.
What Is Leverage?
Leverage is the ratio that defines how much exposure a trader gets relative to their invested capital. Common leverage ratios include 2:1, 5:1, 10:1, or even 100:1 in certain markets like forex or crypto. A 10:1 leverage means that for every ₹1 invested, the trader controls ₹10 worth of assets.
Leverage itself is not a separate instrument; it is a feature embedded within margin trading, futures, options, CFDs, and other derivatives. It acts as a multiplier—both for profits and losses. A 5% favorable move in a highly leveraged position can double capital, but a 5% adverse move can wipe it out entirely.
Applications Across Different Markets
Equity Markets
In stock markets, margin trading allows investors to buy shares by paying only a portion of their value. Regulators often cap leverage in equities to protect retail participants. In India, for example, margin requirements are strictly regulated by SEBI to control excessive speculation.
Derivatives (Futures and Options)
Futures contracts are inherently leveraged instruments. Traders pay a small margin to control a large notional value. Options trading also involves leverage, particularly for option buyers who pay a limited premium for potentially large gains.
Forex Markets
Forex trading is one of the most leveraged markets globally. Traders often use leverage ratios such as 50:1 or 100:1. While this enables participation with small capital, it also makes forex trading extremely risky without strict risk controls.
Cryptocurrency Markets
Crypto exchanges offer very high leverage, sometimes exceeding 100x. Due to extreme volatility, leveraged crypto trading can result in rapid liquidations, making it suitable only for experienced traders.
Advantages of Leveraged and Margin Trading
Capital Efficiency: Traders can deploy capital across multiple opportunities instead of locking it into a single trade.
Enhanced Returns: Even small price movements can generate significant profits when leverage is used correctly.
Short Selling: Margin accounts allow traders to sell assets they do not own, enabling profit from falling markets.
Hedging Opportunities: Leverage can be used to hedge portfolios efficiently with smaller capital outlay.
Risks and Challenges
Despite its advantages, leveraged trading carries substantial risks:
Magnified Losses: Losses increase at the same rate as gains. A small unfavorable move can cause large drawdowns.
Margin Calls and Forced Liquidation: Sudden market volatility can trigger margin calls, forcing traders to exit positions at unfavorable prices.
Emotional Pressure: Leverage intensifies psychological stress, often leading to impulsive decisions.
Interest and Fees: Borrowed funds incur interest costs, which can erode profits over time.
Risk Management in Leveraged Trading
Successful leveraged trading is not about maximizing leverage but managing it wisely. Professional traders follow strict risk management rules:
Position Sizing: Limiting the percentage of capital risked on each trade.
Stop-Loss Orders: Automatically exiting losing positions before losses escalate.
Moderate Leverage: Using lower leverage even when higher leverage is available.
Diversification: Avoiding concentration in a single asset or trade.
Understanding Volatility: Adjusting leverage according to market conditions.
Regulatory Perspective
Regulators worldwide closely monitor margin and leverage usage to maintain market stability. Restrictions on leverage, mandatory margin requirements, and risk disclosures are designed to protect retail traders from catastrophic losses. Traders must be aware of the rules governing their specific market and broker.
Who Should Use Leveraged and Margin Trading?
Leveraged trading is best suited for experienced traders who:
Have a deep understanding of market mechanics
Can manage risk objectively
Maintain emotional discipline
Use well-defined trading strategies
For beginners, leverage should be approached cautiously, starting with minimal exposure until sufficient experience is gained.
Conclusion
Leveraged and margin trading are double-edged swords in the financial markets. They offer the potential for amplified profits, efficient capital use, and advanced trading strategies, but they also expose traders to significant risks and rapid losses. The difference between success and failure lies not in the availability of leverage, but in how responsibly it is used.
A disciplined approach—combining market knowledge, prudent leverage, and strong risk management—can transform leveraged trading from a speculative gamble into a professional trading tool. Ultimately, leverage should serve the trader’s strategy, not control it.

Premium Chart Patterns Why Chart Patterns Work
Chart patterns work because they reflect real market behavior.
Key reasons:
✔ Human psychology repeats
People fear losses and chase gains. This creates repeatable price movements.
✔ Institutions accumulate or distribute slowly
Big players cannot buy or sell at once—they create patterns during accumulation/distribution.
✔ Liquidity zones
Patterns often form near liquidity pools where many stop-loss orders exist.
✔ Self-fulfilling nature
When many traders recognize the same pattern, they take similar trades, increasing accuracy.

TITAN 1 Month Time Frame Titan Company Ltd is trading near ₹3,636.50, approaching its 52-week high of ₹3,740.
📊 1-Month Technical Overview
Price Performance: The stock has seen a modest decline of approximately 0.20% over the past month.
Technical Indicators:
Relative Strength Index (RSI): The RSI is currently in the neutral zone, indicating balanced buying and selling pressures.
Moving Averages: The stock is trading above its short-term moving averages, suggesting a positive short-term trend.
Stochastic Oscillator: The stochastic indicator is in the bullish zone, indicating potential upward momentum.
Commodity Channel Index (CCI): The CCI is above zero, signaling a bullish trend.
Rate of Change (ROC): The ROC is positive, further confirming bullish momentum.
Money Flow Index (MFI): The MFI is above 50, indicating healthy buying activity.
Support and Resistance Levels:
Support: ₹3,189.25
Resistance: ₹3,559.25
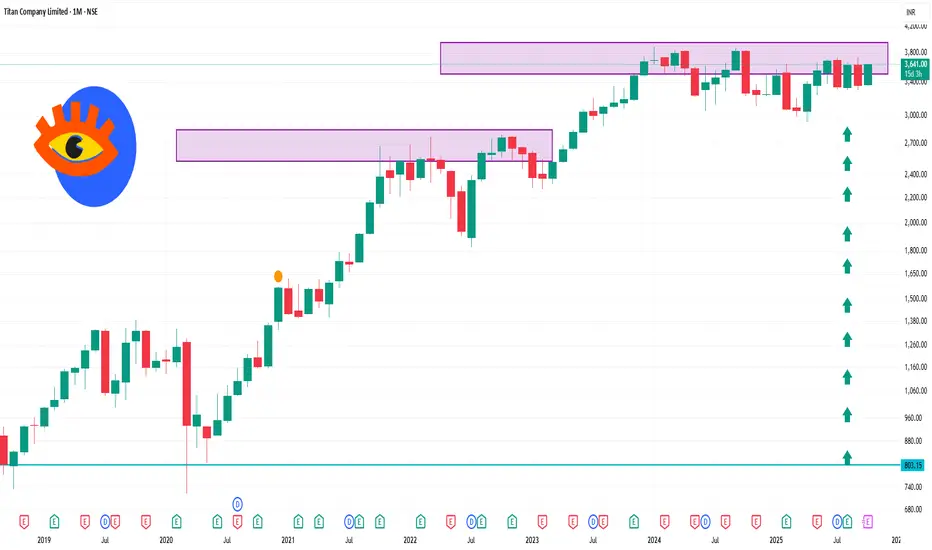
BREKOUT IN SIS📌SWING TRADE FOR NEXT WEEK🚀
Hello guys,
I am a swing trader by passion i only trade on swing stocks.
📌I post daily SWING CHARTS analysis on my trading view profile..
so let's start
📌TRADE ANALYSIS OF SIS :-
•Breakout of Parlell chanel pattern on WTF with strong candle
•Break counter trend line
•Volume increases last few weeks high
•Bullish trend/ make good structure also
•Made good price action
•Make higher highs/higher lows
📌 Add on your watchlist....
📌 If you have any questions about any stock you can DM me Or comment on post 📱
📌Disclaimer:-
This all chatrs analysis are only for educational purposes only
I do not provide any CALL or Tips
