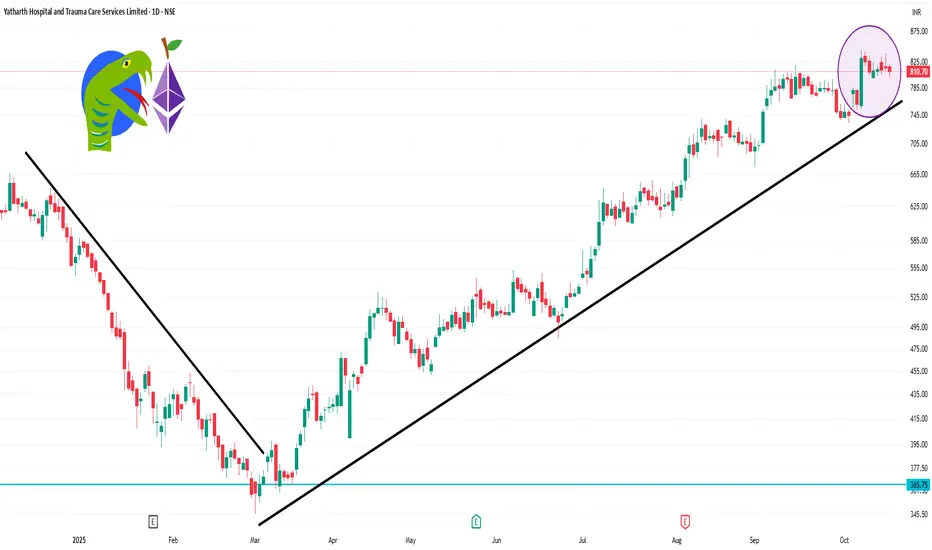
YATHARTH 1 Day Time Frame 📊 Intraday Performance (October 17, 2025)
Opening Price: ₹818.15
Day's Range: ₹802.05 – ₹821.70
Closing Price: ₹810.70
Volume: Approximately 3.32 lakh shares traded
VWAP (Volume-Weighted Average Price): ₹811.36
📈 Key Metrics
Market Capitalization: ₹7,811 crore
P/E Ratio (TTM): 54.93
EPS (TTM): ₹14.76
Book Value: ₹169.91
Dividend Yield: 0.00%
52-Week Range: ₹345.60 – ₹843.70
All-Time High: ₹839.00 (August 2025)
Tradingidea
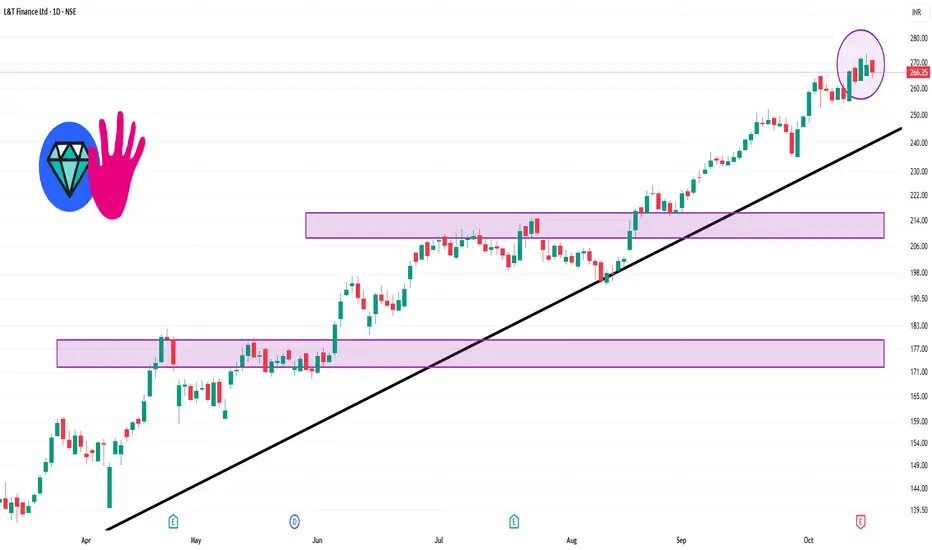
LTF 1 Day Time Frame 📊 Intraday Support and Resistance Levels
Immediate Support: ₹263.19
First Resistance: ₹270.14
Second Resistance: ₹274.02
Third Resistance: ₹277.09
These levels are derived from pivot point calculations and are commonly used by traders to identify potential entry and exit points.
📈 Technical Indicators
Relative Strength Index (RSI): 63.91, indicating that the stock is approaching overbought territory.
Money Flow Index (MFI): 78.20, suggesting strong buying interest.
MACD: The MACD line is at 9.28, with the signal line at 9.06, showing a bullish crossover.
Average True Range (ATR): ₹7.16, reflecting moderate volatility.
Average Directional Index (ADX): 38.39, indicating a strong trend.
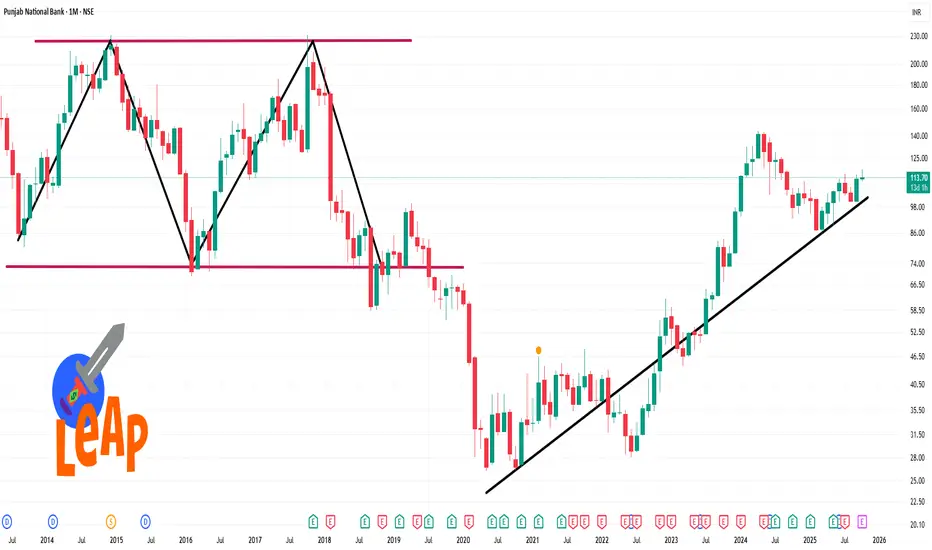
PNB 1 Month Time Frame Level 📊 Key Technical Indicators
Relative Strength Index (RSI): The 14-day RSI is approximately 59.6, suggesting the stock is neither overbought nor oversold, indicating a neutral stance.
Moving Averages:
20-day Simple Moving Average (SMA): 113.73 (bullish)
50-day SMA: 113.61 (bullish)
200-day SMA: 113.87 (bearish)
20-day Exponential Moving Average (EMA): 113.75 (bullish)
50-day EMA: 113.66 (bullish)
200-day EMA: 113.97 (bearish)
Moving Average Convergence Divergence (MACD): The MACD is positive, indicating bullish momentum.
Commodity Channel Index (CCI): The CCI is at 462.41, which is considered extremely overbought, suggesting potential for a pullback.
🔍 Support and Resistance Levels
Resistance: 117.24
Support: 111.4
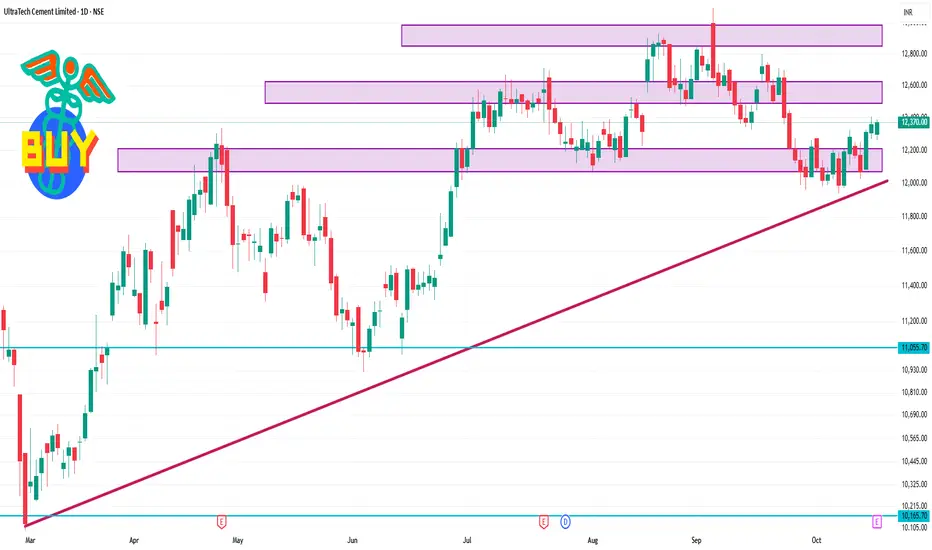
ULTRACEMCO 1 Day Time Frame 📊 Intraday Support & Resistance Levels
Level Type Price (₹)
Current Price 12,370.00
Immediate Support 12,268.00
Short-Term Support 12,140.60
Short-Term Resistance 12,289.70
Immediate Resistance 12,409.00
Upper Intraday Target 12,450.00
These levels are derived from recent technical analyses and intraday price movements.
📈 Technical Indicators
RSI (14): 52.90 – Indicates neutral momentum.
MACD: -42.61 – Suggests bearish momentum.
Stochastic Oscillator: 56.14 – Neutral, indicating no immediate overbought or oversold conditions.
Super Trend: 12,617.76 – Mildly bearish.
Parabolic SAR: 12,268.00 – Mildly bullish
🔍 Trade Strategy
Bullish Scenario: A breakout above ₹12,409 with strong volume could target ₹12,450.
Bearish Scenario: A drop below ₹12,268 may lead to a test of ₹12,140.
Which Trading Style You Should Choose in the Indian Trading MarkIntroduction
The Indian stock market has evolved into one of the most dynamic and liquid markets in the world, offering numerous opportunities for traders and investors. From the Bombay Stock Exchange (BSE) to the National Stock Exchange (NSE), millions of market participants engage daily in buying and selling securities. Yet, the choice of trading style determines whether one succeeds or fails in the market. Selecting the right trading style is not merely about making profits—it is about aligning your personality, capital, risk appetite, and time availability with a specific method of trading.
India’s market participants generally adopt one of several trading styles: intraday trading, swing trading, positional trading, scalping, or long-term investing. Each style has its unique approach, timeframe, and risk-reward ratio. This essay explores these styles in depth and helps you identify which one suits you best in the Indian trading environment.
1. Understanding Trading Styles
A trading style is a strategy that defines how long you hold a position, how you manage risk, and how actively you participate in the market. Broadly, trading styles range from short-term (intraday, scalping) to medium-term (swing, positional) to long-term (investing). The Indian market’s volatility, liquidity, and regulatory environment make all these styles viable under the right circumstances.
Let’s break down the major trading styles commonly used in India.
2. Intraday Trading
Definition
Intraday trading, or day trading, involves buying and selling stocks within the same trading day. The trader closes all positions before the market closes, avoiding overnight risk.
Characteristics
Timeframe: Minutes to hours
Goal: Capture small price movements within a day
Tools Used: Technical indicators like moving averages, RSI, MACD, and price action analysis
Common Stocks: Highly liquid shares like Reliance Industries, HDFC Bank, TCS, and Infosys
Advantages
Quick returns: Profits can be realized the same day.
No overnight risk: Avoids losses due to global or after-market events.
High liquidity: Frequent opportunities to trade due to India’s active market participants.
Disadvantages
High stress and screen time: Requires constant monitoring.
Leverage risk: Brokers offer intraday margins that can magnify losses.
Emotional discipline: Fear and greed can lead to impulsive decisions.
Who Should Choose Intraday Trading
If you are a full-time trader who can monitor the market actively from 9:15 AM to 3:30 PM, have strong technical knowledge, and can handle volatility, intraday trading may suit you. It’s ideal for individuals who thrive on quick decision-making and have high-risk tolerance.
3. Scalping
Definition
Scalping is an ultra-short-term trading style aimed at making multiple small profits throughout the day. Scalpers usually hold positions for seconds or minutes.
Characteristics
Timeframe: Seconds to a few minutes
Number of Trades: Dozens or even hundreds daily
Instruments Used: Liquid stocks, Nifty or Bank Nifty futures, and options
Advantages
Frequent opportunities: Small moves occur constantly in liquid stocks.
Low exposure risk: Positions are closed very quickly.
Disadvantages
Brokerage and transaction costs: High volume of trades increases costs.
Requires speed and precision: A few seconds delay can cause losses.
Mental exhaustion: Demands extreme focus and fast reflexes.
Who Should Choose Scalping
Scalping is best for experienced traders with access to advanced trading terminals, fast internet connections, and low-cost brokerage accounts. It suits those who can make lightning-fast decisions and have the discipline to exit trades quickly without hesitation.
4. Swing Trading
Definition
Swing trading involves holding positions for several days to weeks to profit from short- to medium-term market trends. It’s a popular style in India because it balances risk and time commitment.
Characteristics
Timeframe: 2 days to 3 weeks
Goal: Capture “swings” or trend movements in the market
Tools Used: Chart patterns, Fibonacci retracements, trendlines, and moving averages
Advantages
Less stressful than intraday: No need to monitor the screen all day.
Captures significant price moves: Larger potential profit per trade.
Ideal for working professionals: Can be managed part-time with end-of-day analysis.
Disadvantages
Overnight risk: Prices can gap up or down due to global cues.
Requires patience: You may need to hold trades longer than expected.
Who Should Choose Swing Trading
Swing trading is ideal for working professionals or students who cannot watch the market all day but can spend some time analyzing charts in the evening. If you prefer moderate risk and can stay patient for days or weeks, swing trading may be your best fit.
5. Positional Trading
Definition
Positional trading involves holding trades for weeks to months, focusing on broader trends rather than daily fluctuations. It’s a blend between swing trading and long-term investing.
Characteristics
Timeframe: Several weeks to a few months
Goal: Benefit from medium-term market trends
Tools Used: Fundamental analysis combined with technical trend identification
Advantages
Lower stress: Minimal screen time required.
Rides big market trends: Captures major directional moves.
Less brokerage cost: Fewer trades mean lower transaction fees.
Disadvantages
Capital lock-in: Funds remain tied for longer durations.
Higher overnight risk: Exposed to economic and policy changes.
Who Should Choose Positional Trading
If you are a part-time trader who believes in broader market cycles and wants to balance risk and reward, positional trading is suitable. It fits individuals with moderate risk tolerance who want consistent returns without daily stress.
6. Long-Term Investing
Definition
Long-term investing focuses on buying quality companies and holding them for years, benefiting from business growth and compounding. In India, this style is associated with value investors like Rakesh Jhunjhunwala and Radhakishan Damani.
Characteristics
Timeframe: Several years or even decades
Goal: Wealth creation through capital appreciation and dividends
Tools Used: Fundamental analysis, company financials, economic outlook
Advantages
Compounding effect: Wealth grows exponentially over time.
Lower risk: Less affected by short-term volatility.
Tax benefits: Long-term capital gains tax is lower than short-term.
Disadvantages
Patience required: Returns take time to materialize.
Market cycles: Long bear phases can test confidence.
Who Should Choose Long-Term Investing
Long-term investing suits professionals, business owners, and retirement planners who want to build wealth gradually without actively trading. It’s perfect for those with low-risk tolerance and a belief in India’s economic growth story.
7. Factors to Consider Before Choosing a Trading Style
1. Risk Appetite
If you can handle frequent losses and volatility, intraday or scalping might fit you. If you prefer stable returns, swing or positional trading is better.
2. Capital Availability
Some trading styles, especially intraday and positional trading, require sufficient capital to manage margin and risk effectively.
3. Time Commitment
If you can monitor markets throughout the day, intraday or scalping may suit you. Otherwise, swing or long-term investing is ideal.
4. Market Knowledge
Beginners should start with swing or positional trading to learn market behavior before moving to faster styles like scalping.
5. Personality Type
Are you patient or impulsive? Aggressive or analytical? Scalping needs quick reflexes, while investing needs calm patience.
8. The Indian Context: Market Volatility and Regulation
The Indian stock market is influenced by:
High retail participation (especially in NSE’s F&O segment)
Regulatory oversight by SEBI
Global factors like crude oil prices, U.S. interest rates, and geopolitical tensions
Volatility in Indian indices like Nifty50 and Bank Nifty creates ample opportunity for short-term traders. However, long-term investors benefit from India’s economic expansion, strong corporate earnings, and government reforms. Hence, your choice must align with both your goals and India’s market conditions.
9. Blended Approach: The Smart Trader’s Edge
Many successful Indian traders adopt a hybrid approach:
They keep long-term investments in fundamentally strong companies.
Simultaneously, they trade short-term trends for additional income.
For example, you may hold long-term positions in HDFC Bank or Infosys while taking short-term trades in Nifty futures. This diversification balances risk and reward efficiently.
10. Conclusion
Choosing the right trading style in the Indian market is about self-awareness as much as market knowledge. There is no “one-size-fits-all” approach — your trading style must reflect your financial goals, risk tolerance, time commitment, and emotional temperament.
If you are a risk-taker with full-time availability, intraday trading or scalping might be your arena. If you have a job or business and want to participate without daily stress, swing or positional trading offers balance. If your focus is wealth creation, long-term investing remains the timeless path.
The Indian market, with its vast opportunities and volatility, rewards discipline, patience, and strategy. The best trading style is not the one that makes money the fastest — it’s the one you can follow consistently without losing sleep or confidence. Master your chosen style, manage your risk, and the Indian market will open endless opportunities for financial growth.

Trading RegulationsEnsuring Fair, Transparent, and Secure Financial Markets.
Trading regulations are the rules and guidelines established by governmental and regulatory authorities to oversee financial markets and trading activities. They exist to maintain market integrity, protect investors, prevent fraud, and ensure the smooth functioning of financial markets. Without regulations, markets could become chaotic, leading to manipulation, insider trading, systemic risks, and loss of investor confidence. This essay explores the significance, types, global frameworks, and contemporary developments in trading regulations, with a focus on the Indian context.
1. Importance of Trading Regulations
Trading regulations serve multiple crucial purposes in financial markets:
Investor Protection: Regulations ensure that retail and institutional investors are safeguarded from fraudulent practices, misrepresentation, and unfair trading activities. This includes rules on disclosure of information, transparent pricing, and reporting requirements.
Market Integrity: They maintain trust in financial markets by ensuring that trading is fair, orderly, and transparent. This reduces market manipulation, insider trading, and excessive speculation that could distort prices.
Systemic Risk Mitigation: Regulations help prevent systemic failures by controlling leverage, setting capital adequacy requirements for financial institutions, and monitoring interconnected market risks.
Transparency and Disclosure: Regulatory frameworks mandate companies and traders to disclose essential information such as financial statements, trading positions, and ownership stakes. Transparency is key to informed investment decisions.
Efficient Price Discovery: By creating a level playing field and enforcing timely information sharing, regulations facilitate efficient price discovery, which reflects the true value of assets based on supply and demand.
Prevention of Fraud and Market Abuse: Regulations protect markets from fraudulent schemes, manipulative trading, and insider trading. They impose strict penalties and monitoring mechanisms to discourage unethical behavior.
2. Key Areas of Trading Regulations
Trading regulations cover several critical areas to ensure the smooth operation of financial markets:
2.1 Securities Trading Regulations
Securities trading includes the buying and selling of stocks, bonds, derivatives, and other financial instruments. Regulations in this area focus on:
Listing and Disclosure Requirements: Companies must meet stringent listing criteria on stock exchanges and disclose financial statements, corporate governance practices, and risk factors.
Insider Trading Laws: Trading based on non-public, material information is strictly prohibited. Authorities monitor suspicious trading patterns and prosecute offenders.
Market Manipulation Prevention: Regulatory bodies detect and prevent actions like price rigging, pump-and-dump schemes, and spoofing.
2.2 Derivatives and Futures Trading Regulations
Derivatives, including futures, options, and swaps, are highly leveraged instruments that can amplify gains and losses. Regulations ensure:
Risk Management Standards: Margin requirements, position limits, and daily mark-to-market settlements prevent excessive risk-taking.
Clearing and Settlement Rules: Centralized clearinghouses reduce counterparty risk and ensure trades are settled efficiently.
Disclosure and Reporting: Participants must report open positions and derivative exposures to regulatory authorities.
2.3 Foreign Exchange and Commodity Trading Regulations
Foreign exchange (Forex) and commodity markets involve global and domestic transactions that can affect national economies:
Forex Regulations: Central banks monitor currency trading to prevent excessive speculation, manage foreign reserves, and control capital flows.
Commodity Market Oversight: Regulatory authorities oversee trading in commodities like oil, metals, and agricultural products to prevent price manipulation and ensure transparency.
2.4 Algorithmic and High-Frequency Trading (HFT) Regulations
Modern trading technologies, including algorithmic and high-frequency trading, present unique challenges:
Algorithm Approval: Regulators require that trading algorithms be tested and approved to prevent market disruptions.
Risk Controls: Mechanisms like circuit breakers, kill switches, and real-time monitoring help manage risks posed by automated trading.
Latency and Fair Access Rules: Ensuring equitable access to trading platforms and market data is vital to prevent unfair advantages.
3. Global Frameworks and Regulatory Bodies
Financial markets operate on both national and international levels, and trading regulations often intersect globally. Key regulatory authorities include:
United States: The Securities and Exchange Commission (SEC) regulates securities trading, while the Commodity Futures Trading Commission (CFTC) oversees derivatives and futures markets. The Financial Industry Regulatory Authority (FINRA) monitors brokerage practices.
European Union: The European Securities and Markets Authority (ESMA) harmonizes rules across EU member states. Markets in Financial Instruments Directive (MiFID II) regulates securities trading and investor protection.
United Kingdom: The Financial Conduct Authority (FCA) ensures market integrity and consumer protection.
Asia-Pacific: Countries like Japan, China, and Singapore have their own authorities, including Japan’s Financial Services Agency (FSA) and the Monetary Authority of Singapore (MAS).
Global cooperation is critical to address cross-border trading issues, such as arbitrage, tax evasion, and offshore financial activity.
4. Indian Trading Regulations
India’s financial markets are regulated primarily by the Securities and Exchange Board of India (SEBI), the Reserve Bank of India (RBI), and other sector-specific authorities.
4.1 Securities and Exchange Board of India (SEBI)
SEBI, established in 1992, regulates stock exchanges, brokers, mutual funds, and listed companies. Key provisions include:
Insider Trading Prohibition: SEBI (Prohibition of Insider Trading) Regulations, 2015, prevent trading based on unpublished price-sensitive information.
Takeover Regulations: SEBI (Substantial Acquisition of Shares and Takeovers) Regulations, 2011, ensure transparency during corporate mergers and acquisitions.
Listing and Disclosure Obligations: Companies must disclose quarterly financial results, corporate governance compliance, and risk factors.
4.2 Reserve Bank of India (RBI)
RBI regulates Forex trading, capital flows, and derivatives in the Indian financial system. It ensures:
Capital Control Compliance: Limits on foreign currency trading by Indian residents and corporations.
Risk Monitoring: Oversight of banks’ exposure to derivatives and foreign exchange markets.
Systemic Stability: Measures to mitigate systemic risk in banking and financial institutions.
4.3 Commodity and Futures Trading Regulations
The Forward Markets Commission (FMC) merged with SEBI in 2015 to regulate commodity futures trading. SEBI now oversees:
Futures Contracts: Standardization, reporting, and settlement procedures.
Market Surveillance: Prevention of price manipulation and unfair trading practices.
4.4 Algorithmic Trading Regulations in India
SEBI has introduced guidelines for algorithmic trading and high-frequency trading to maintain market fairness:
Mandatory Registration: All algorithmic trading participants must register with SEBI.
Testing and Approval: Algorithms must undergo pre-trade risk checks and compliance testing.
Market Stability Mechanisms: Circuit breakers, order throttling, and position limits help prevent flash crashes.
5. Enforcement and Compliance Mechanisms
Trading regulations are only effective when backed by robust enforcement mechanisms. Regulatory authorities use multiple tools:
Monitoring and Surveillance: Real-time monitoring of trades, order books, and transactions helps detect suspicious activities.
Audits and Inspections: Regular inspections of brokers, trading platforms, and financial institutions ensure compliance.
Penalties and Legal Actions: Violators face fines, license suspension, imprisonment, or both.
Whistleblower Programs: Encouraging reporting of irregular activities strengthens enforcement.
6. Emerging Trends in Trading Regulations
The financial landscape is evolving rapidly, demanding updates to regulatory frameworks:
Cryptocurrency and Digital Assets: Global regulators are developing rules to govern trading in cryptocurrencies, stablecoins, and blockchain-based assets.
ESG (Environmental, Social, Governance) Reporting: Investors increasingly demand transparency on ESG factors, prompting regulatory oversight on disclosures.
AI and Machine Learning in Trading: Regulators are examining AI-driven trading strategies for ethical compliance, bias prevention, and market stability.
Global Coordination: Cross-border financial regulations, harmonized reporting, and anti-money laundering measures are becoming critical in a connected market.
7. Challenges in Trading Regulations
Despite stringent rules, trading regulations face several challenges:
Rapid Technological Change: Innovations in fintech, AI, and blockchain often outpace regulatory updates.
Globalization of Markets: Cross-border trading complicates enforcement, requiring international cooperation.
Complex Financial Instruments: Sophisticated derivatives and structured products are hard to monitor and regulate.
Balancing Innovation and Regulation: Over-regulation may stifle innovation, while under-regulation can lead to market abuse.
8. Conclusion
Trading regulations are the backbone of stable, transparent, and fair financial markets. They protect investors, maintain market integrity, and prevent systemic risks. Globally and in India, regulatory authorities like SEBI, RBI, SEC, and ESMA play critical roles in monitoring securities, derivatives, commodities, and algorithmic trading.
Modern challenges, including cryptocurrencies, AI-driven trading, and cross-border operations, highlight the need for dynamic and adaptive regulations. While enforcement mechanisms and compliance frameworks have strengthened market stability, regulators must continuously evolve rules to keep pace with technological advancements and globalization.
In essence, effective trading regulations balance innovation with risk mitigation, ensuring that financial markets remain a reliable engine for economic growth and wealth creation. Without such oversight, investor confidence would erode, markets would lose credibility, and the broader economy could face instability. Thus, trading regulations are not merely rules on paper—they are essential instruments that safeguard the very foundation of modern financial systems.

India’s Derivative Secrets: Unveiling the Dynamics of Derivative1. Introduction to Derivatives in India
A derivative is a financial instrument whose value is derived from an underlying asset, index, or rate. In India, derivatives are primarily traded on the National Stock Exchange (NSE) and Bombay Stock Exchange (BSE), with the NSE being the largest platform. The most common derivative instruments include:
Futures – Contracts to buy or sell an asset at a predetermined price on a future date.
Options – Contracts granting the right, but not the obligation, to buy or sell an asset at a specific price within a set time frame.
Currency Derivatives – Futures and options based on currency pairs like USD/INR.
Interest Rate Derivatives – Contracts based on interest rate movements, primarily used by institutional investors.
India’s derivatives market is not only a platform for speculation but also a sophisticated tool for hedging risk. The ability to lock in prices, hedge exposures, and leverage positions gives both institutional and retail investors a strategic advantage in volatile markets.
2. The Evolution of Derivatives in India
India’s derivatives market officially began in 2000, with the introduction of index futures on the NSE. Over the years, several key milestones shaped the market:
2001: Stock options were introduced, enhancing flexibility for traders.
2003: Introduction of single-stock futures, allowing hedging against individual stocks.
2008: Currency derivatives became accessible to retail investors, broadening participation.
2010 onwards: The market saw technological upgrades, automated trading systems, and higher liquidity, attracting foreign institutional investors.
This evolution has made India one of the largest derivatives markets in Asia by trading volume, second only to countries like Japan and China in certain segments.
3. Key Players in the Indian Derivatives Market
Understanding who participates in the market reveals some of its hidden dynamics:
Retail Investors – Individuals trading for speculation or hedging their portfolios. They often rely on technical analysis and market sentiment.
Institutional Traders – Banks, mutual funds, insurance companies, and hedge funds that engage in large-scale trading and hedging.
Foreign Institutional Investors (FIIs) – FIIs bring liquidity and often influence market trends through large transactions.
Market Makers – Entities that ensure liquidity by quoting buy and sell prices for derivatives.
The interaction among these participants creates opportunities for informed traders to capitalize on market inefficiencies, price misalignments, and short-term volatility.
4. Secrets Behind Successful Derivative Trading
While derivatives offer immense potential, success requires knowledge beyond basic concepts. Some hidden secrets include:
A. Leverage and Risk Management
Derivatives allow traders to control a large position with a relatively small capital outlay. However, leverage can be a double-edged sword. Indian regulators, like the Securities and Exchange Board of India (SEBI), have put safeguards in place, including margin requirements and position limits. Understanding how to balance leverage with risk is a fundamental secret of successful trading.
B. The Art of Hedging
Many retail traders view derivatives purely as speculative tools, but the real power lies in hedging. Hedging allows investors to protect against adverse movements in their underlying assets. For example:
A farmer can use commodity futures to lock in a selling price for crops.
An exporter can hedge currency risk using USD/INR futures.
Stock investors can buy put options to insure their portfolio during bearish markets.
The secret here is that derivative instruments, when used correctly, provide a risk-adjusted return advantage that simple stock trading cannot achieve.
C. Volatility Trading
India’s markets are inherently volatile due to domestic and global factors. Options trading in particular provides a way to profit from volatility without predicting the exact direction of the market. Traders use strategies like straddles, strangles, and iron condors to benefit from sudden price swings. Recognizing patterns in implied volatility versus historical volatility is a key insight many beginners overlook.
D. Time Decay Awareness
Options lose value as expiration approaches—a concept called theta decay. Seasoned traders exploit this by selling options in certain market conditions, capturing premium income while managing risk. Understanding the interplay of delta, gamma, theta, and vega can significantly improve trading performance.
E. Market Microstructure Secrets
Derivative prices are influenced not just by underlying assets but also by order flows, liquidity, and market sentiment. High-frequency traders, institutional desks, and market makers use sophisticated algorithms to anticipate price movements. Even retail traders can benefit by analyzing open interest patterns, volume spikes, and rollovers in futures contracts.
5. Regulatory Landscape
SEBI governs India’s derivatives market, ensuring transparency and protecting investors. Key regulations include:
Margin Requirements: Traders must maintain a margin to cover potential losses.
Position Limits: Restricts the maximum exposure a single trader can hold to avoid market manipulation.
Circuit Breakers: Automatic trading halts during extreme market movements.
Understanding these rules is crucial. For instance, failure to maintain margins can result in automatic liquidation, while exceeding position limits may attract penalties. Traders who study the regulatory nuances gain a competitive edge, often spotting opportunities where rules create predictable price movements.
6. Technological Edge
One of India’s derivative market secrets is the reliance on technology. From automated order routing to real-time risk monitoring, technology has transformed trading. Notable innovations include:
Algorithmic Trading (Algo-Trading): Uses pre-set rules to execute trades faster than humans.
Trading APIs and Platforms: Advanced retail traders now have access to real-time data, order book insights, and analytical tools.
Data Analytics: Big data and AI are increasingly used to predict market trends and volatility.
Retail traders who embrace technology can compete with institutional players on more equal footing than ever before.
7. Strategies Employed by Successful Traders
Several derivative trading strategies form the backbone of India’s market secrets:
A. Futures Hedging
A common practice among institutional traders is portfolio hedging using index futures. For example, if a mutual fund anticipates short-term market decline, it may short Nifty futures to offset losses.
B. Options Strategies
Advanced traders use options to construct bull spreads, bear spreads, butterflies, and condors. These strategies can limit risk while enhancing reward potential.
C. Pair Trading
Traders often engage in spread trading, taking opposite positions in correlated assets. This technique reduces market risk while exploiting relative price movements.
D. Arbitrage Opportunities
Derivative markets sometimes create mispricing between futures and underlying stocks. Traders exploit these arbitrage opportunities for low-risk profits. In India, cash-futures arbitrage is a popular strategy, where discrepancies between spot prices and futures prices are exploited.
8. Common Pitfalls and Myths
Despite the potential, many traders fall into common traps:
Over-leveraging: Taking excessive positions can wipe out capital in volatile markets.
Ignoring Market Sentiment: Technical and fundamental analysis must be combined with sentiment analysis.
Blindly Following Tips: Derivatives require personal strategy and risk management.
Neglecting Expiry Cycles: Options and futures have expiration dates that significantly impact pricing and liquidity.
Recognizing and avoiding these pitfalls separates successful traders from the rest.
9. The Role of Derivatives in the Indian Economy
Derivatives are not just for traders—they play a critical role in India’s broader economy:
Risk Management: Corporates hedge foreign exchange, interest rate, and commodity risks.
Liquidity Enhancement: Futures and options increase market liquidity, facilitating price discovery.
Foreign Investment Attraction: A sophisticated derivatives market encourages foreign participation.
Economic Stability: Hedging tools help mitigate extreme market volatility, indirectly supporting economic growth.
This makes derivatives a cornerstone of India’s financial ecosystem, often overlooked by casual investors.
10. Future Prospects and Opportunities
India’s derivatives market continues to evolve. Key trends include:
Commodity Derivatives Growth: Increasing interest in metals, energy, and agricultural products.
Index Options Expansion: More indices beyond Nifty and Bank Nifty are being introduced.
Retail Participation Rise: Greater financial literacy and technology adoption are expanding the retail base.
Integration with Global Markets: Cross-border derivatives trading and currency hedging will increase as India becomes a global financial hub.
The secret for future success is adaptability—traders who embrace innovation, data analytics, and regulatory foresight will dominate the landscape.
Conclusion
India’s derivatives market is a sophisticated arena where knowledge, strategy, and discipline converge. Its “secrets” lie not in shortcuts but in understanding leverage, risk management, hedging techniques, volatility strategies, and market microstructure. With proper education, analytical skills, and technological support, both retail and institutional traders can unlock immense potential.
Derivatives are more than speculative tools—they are instruments of financial empowerment, risk mitigation, and economic stability. The Indian market, with its unique regulatory framework, growing liquidity, and technological advancements, offers opportunities that are increasingly accessible to informed participants.
For anyone serious about trading or investment, unraveling India’s derivative secrets is not just a pathway to profit but also a window into the deeper mechanics of financial markets.

Unlock Trading Secrets1. Start with the right mindset
The single biggest secret is mindset. Markets are a probabilistic environment where losses are inevitable. Embrace uncertainty: every trade is a bet with an expected value (EV), not a promise. Detach ego from outcomes. Trade plans should guide actions, not emotions. Treat trading like a business: document processes, measure performance, and pay attention to costs (commissions, slippage, taxes).
2. Edge — your repeatable advantage
Edge is what separates gamblers from consistent traders. It could be a proprietary indicator, a superior way to read order flow, or simply disciplined risk management that lets you survive losing streaks. To build an edge:
Specialize. Pick one market (e.g., Nifty futures, EUR/USD, crude) and a timeframe. Mastering a smaller universe increases pattern recognition.
Quantify your hypothesis. Transform an idea into measurable rules. For example: “Buy when 20-day EMA crosses above 50-day EMA and RSI < 60.”
Backtest and forward-test. Check your rules across historical data and live paper trading to confirm they weren’t luck or overfitting.
3. Risk management is the backbone
Most traders who fail didn’t lose because their ideas were bad — they lost because one loss (or series of losses) wiped out gains. Core rules:
Risk per trade: Never risk more than a small percentage of capital on a single trade (commonly 0.5–2%).
Position sizing: Calculate size using stop-loss distance and acceptable risk amount. Position size = (Account Risk in ₹ or $) / (Stop distance × value per pip/point).
Diversify risks: Avoid putting all capital into correlated positions.
Use stop-losses: A logical stop is cheap insurance — accept small losses to avoid catastrophic ones.
4. Strategy types and when to use them
There’s no single winning strategy. Here are common families you can choose from and mix:
Trend following: Ride big moves using moving averages, breakouts, or momentum. Works best in trending markets and often needs larger stops and patience.
Mean reversion: Trade overreactions — fade extreme moves with tight stops and quick profit targets. Works in range-bound markets.
Breakout trading: Enter when price breaks a consolidation area. Can be explosive but prone to false breakouts.
Order-flow / tape-reading: Advanced; uses real-time market microstructure to detect large institutional flow.
Algorithmic/quantitative: Rules-based strategies executed automatically. Reduce emotional errors but require robust testing.
Select a style that matches your temperament: scalping for fast-paced focus, swing trading for part-time traders, trend-following for long-term discipline.
5. Technical and fundamental analysis — use both wisely
Technical analysis helps with entries and exits; fundamental analysis explains why trends exist. For many traders, a hybrid approach works best:
Technicals: Price action, support/resistance, volume, trend indicators, chart patterns.
Fundamentals: Earnings, macro data, central bank moves, inventory reports. Use fundamentals to bias direction for longer-horizon trades.
Don’t overcomplicate: prefer a few high-confidence tools over a dashboard of conflicting indicators.
6. Execution — rules for entry, management, and exit
A defined execution plan turns ideas into consistent actions.
Entry rules: Specify the setup, confirmation, and exact price for entry (market, limit, or stop).
Trade management: Decide pre-trade whether you’ll scale in/out, move stops to breakeven, or trail the stop. Avoid changing plans mid-trade because of emotions.
Exit rules: Define targets and stop levels. Some traders use risk:reward ratios (e.g., 1:2 or 1:3) while others use technical levels (support/resistance).
7. Psychology — master the inner game
Fear and greed are the twin devils. Common psychological traps:
Revenge trading: Trying to win back losses by increasing risk.
Averaging down: Increasing size into losing trades without reason.
Overconfidence after wins: Increasing risk after a streak.
Countermeasures: stick to a trading plan, enforce risk limits automatically, take regular breaks, and use objective measures (like a pre-trade checklist) to keep emotions out of the loop.
8. Backtesting and data hygiene
Ideas must survive rigorous testing:
Clean data: Use reliable historical data with dividends, splits, and corporate actions corrected.
Avoid look-ahead bias: Ensure your backtest only uses information that would have been available at the time.
Out-of-sample testing: Reserve a portion of data for validation to avoid overfitting.
Monte Carlo and stress tests: Estimate how strategies perform across different sequences of wins/losses.
9. Journaling and performance review
A trade journal is non-negotiable. Record: entry/exit, size, reason for trade, emotions, and lessons learned. Monthly and quarterly reviews should measure:
Win rate and average win/loss
Profit factor and expectancy
Drawdown frequency and depth
Which setups are most profitable
Use these metrics to prune poor setups, and double down on strengths.
10. Edge maintenance and adaptability
Markets evolve. A strategy that worked last year can fail today. Maintain edge by:
Continuous learning: Read market reports, research, and adapt to structural shifts (e.g., algo prevalence, regulation changes).
Parameter stability checks: Re-test strategy parameters periodically; if performance degrades, investigate why.
Scaling in and out: Increase capital allocation gradually as live performance proves itself.
11. Practical checklist before placing a trade
Always run through a checklist:
Does the trade fit my system? (Yes/No)
How much will I risk in ₹/$? Is it within limits?
Exact entry, stop, profit target set? (Record them)
Is market structure or news likely to invalidate the setup?
Am I emotionally clear to trade? (Not revenge-motivated)
If any answer is negative, skip the trade.
12. Avoid common myths and pitfalls
Myth: More indicators = better decisions. Reality: parsimony wins. Too many indicators create noise.
Myth: You must be right most of the time. Reality: success depends on average win size relative to losses.
Pitfall: Chasing high-leverage products without understanding margin calls and decay (time decay in options is a classic example).
13. Tools and tech that help
Start simple: a reliable broker, a fast internet connection, and one good charting platform. As you scale, consider:
Data subscriptions for depth and historical ticks
Backtesting platforms (Quant, Python libraries, or built-in platform tools)
Trade automation for precise execution and disciplined risk management
14. Continuous improvement — be patient and humble
Trading is a marathon. Expect ups and downs. The professionals who last are those who treat trading like a craft: measure everything, cut losing ideas ruthlessly, and preserve capital above all.
Final thought
There’s no magic formula, but there is a playbook. Combine a clear mindset, an objectively tested edge, strict risk management, and honest record-keeping — and you’ll be far ahead of most traders. Start small, learn fast, and let the market tell you which ideas are real. Good luck, and trade responsibly.

Cryptocurrency as a digital assetIntroduction
The rise of cryptocurrency has fundamentally transformed the financial and technological landscape. Cryptocurrency is a form of digital asset that relies on cryptography for security and operates independently of a central authority, such as a government or central bank. It represents a shift from traditional, physical forms of money to decentralized, blockchain-based systems. Digital assets like cryptocurrencies have become an integral part of global finance, investment strategies, and technological innovation, driving discussions about the future of money, digital ownership, and decentralized finance (DeFi).
Definition of Cryptocurrency
A cryptocurrency is a type of digital or virtual currency that uses cryptography for secure financial transactions. Unlike traditional currencies, cryptocurrencies are decentralized, meaning they are not issued or controlled by any single authority. They are typically built on a blockchain, which is a distributed ledger that records all transactions across a network of computers. The decentralized and encrypted nature of cryptocurrencies ensures transparency, security, and resistance to censorship or fraud.
Some of the key features of cryptocurrencies include:
Decentralization: No single entity controls the network.
Security: Transactions are secured by cryptographic algorithms.
Anonymity/Pseudonymity: Users can make transactions without revealing personal identities.
Digital Scarcity: Many cryptocurrencies, like Bitcoin, have a limited supply.
Cryptocurrency as a Digital Asset
A digital asset is any asset that exists in digital form and provides economic value. Cryptocurrencies fit into this definition because they are entirely digital, have intrinsic economic value, and can be used for investment, transactions, or as a medium of exchange. Digital assets are increasingly recognized alongside traditional assets like stocks, bonds, and commodities.
Cryptocurrencies are distinct from conventional digital representations of money (like online bank balances) because they:
Exist outside traditional financial institutions.
Can be transferred peer-to-peer without intermediaries.
Are programmatically scarce, meaning algorithms limit their supply (e.g., Bitcoin’s 21 million coin cap).
Can function as programmable money, enabling smart contracts and decentralized applications.
Historical Evolution of Cryptocurrency
The concept of digital currency existed for decades, but modern cryptocurrency began with Bitcoin, introduced in 2008 by an anonymous person or group under the pseudonym Satoshi Nakamoto. Bitcoin aimed to create a decentralized form of money immune to inflation and manipulation by governments.
Key milestones in cryptocurrency history include:
Bitcoin Launch (2009): Bitcoin’s open-source software allowed users to mine, transfer, and store digital currency without a central authority.
Altcoins Emergence (2011 onward): Other cryptocurrencies, called altcoins, were developed, including Litecoin, Ripple, and Ethereum.
Ethereum & Smart Contracts (2015): Ethereum introduced programmable blockchain functionality, enabling smart contracts and decentralized applications (dApps).
DeFi Revolution (2020 onward): Decentralized finance platforms began offering financial services like lending, borrowing, and trading without intermediaries.
Types of Cryptocurrencies
Cryptocurrencies can be broadly categorized based on their purpose and functionality:
Currency Coins:
Example: Bitcoin (BTC), Litecoin (LTC)
Primary function: Medium of exchange, store of value
Platform Coins:
Example: Ethereum (ETH), Solana (SOL)
Primary function: Power decentralized applications and smart contracts
Stablecoins:
Example: Tether (USDT), USD Coin (USDC)
Primary function: Pegged to fiat currencies for stability, reducing volatility
Privacy Coins:
Example: Monero (XMR), Zcash (ZEC)
Primary function: Ensure anonymity and untraceable transactions
Tokenized Assets:
Example: NFT tokens, utility tokens
Primary function: Represent ownership of digital or real-world assets
Blockchain Technology and Cryptocurrency
Blockchain is the backbone of cryptocurrencies. It is a distributed ledger system that stores transactions in blocks, which are linked together using cryptographic hashes. This architecture ensures security, immutability, and transparency.
Key components of blockchain include:
Nodes: Computers that maintain copies of the blockchain.
Consensus Mechanisms: Algorithms like Proof of Work (PoW) and Proof of Stake (PoS) validate transactions.
Smart Contracts: Self-executing contracts that run when certain conditions are met, enabling decentralized applications.
Blockchain technology not only underpins cryptocurrency but also enables other digital assets and innovations, including supply chain management, identity verification, and decentralized finance.
Cryptocurrency as an Investment Asset
Cryptocurrencies are increasingly treated as alternative investments. Investors buy cryptocurrencies to diversify portfolios, hedge against inflation, or capitalize on speculative gains.
Characteristics as an investment:
Volatility: Prices can fluctuate dramatically in short periods, offering opportunities for high returns but also high risks.
Liquidity: Major cryptocurrencies like Bitcoin and Ethereum are highly liquid, while smaller altcoins may be less tradable.
Accessibility: Anyone with an internet connection can participate in crypto markets.
Decentralization: Investment is not tied to traditional financial institutions, reducing exposure to systemic risk.
Institutional adoption has increased the legitimacy of cryptocurrencies, with companies and funds investing in digital assets, offering crypto ETFs, and integrating blockchain solutions.
Cryptocurrency in the Global Economy
Cryptocurrency is reshaping global finance by enabling:
Cross-border transactions: Transfers are faster and cheaper than traditional banking systems.
Financial inclusion: People in underbanked regions can access financial services using digital wallets.
Decentralized finance: Lending, borrowing, and trading can occur without intermediaries.
New economic models: Token economies incentivize network participation and innovation.
However, challenges remain, including regulatory uncertainty, market manipulation, and energy consumption concerns.
Risks and Challenges
While cryptocurrency offers tremendous potential, it also carries significant risks:
Regulatory Risk: Governments worldwide are still defining how to regulate digital assets. Sudden regulatory changes can impact prices.
Security Risk: Hacks and scams are prevalent, and losing private keys can result in permanent loss of funds.
Market Volatility: Prices are highly sensitive to speculation, news, and market sentiment.
Environmental Concerns: Proof of Work cryptocurrencies, like Bitcoin, consume substantial energy.
Legal and Tax Implications: Tax treatment varies across countries, complicating compliance.
Investors must weigh potential rewards against these risks before entering the market.
Future of Cryptocurrency as a Digital Asset
The future of cryptocurrencies looks promising but uncertain. Key trends shaping the next decade include:
Institutional Adoption: More financial institutions are offering crypto services and investment products.
Central Bank Digital Currencies (CBDCs): Governments may issue their own digital currencies, potentially coexisting with cryptocurrencies.
Technological Innovation: Layer 2 scaling solutions, interoperability protocols, and eco-friendly mining will enhance usability and sustainability.
Integration with Traditional Finance: Crypto may increasingly integrate with banks, payment processors, and stock markets.
Global Regulation: Regulatory clarity will help mainstream adoption while addressing risks like fraud and money laundering.
Cryptocurrencies could evolve from speculative assets to mainstream financial tools, reshaping money, payments, and investment landscapes.
Conclusion
Cryptocurrency represents a paradigm shift in finance, transforming how value is stored, transferred, and invested. As a digital asset, it combines the principles of cryptography, decentralization, and blockchain technology to create secure, transparent, and programmable financial instruments. While cryptocurrencies carry risks, they also offer unprecedented opportunities for global financial inclusion, innovation, and economic efficiency.
Their growing role in global finance, technological advancements, and increasing adoption by individuals, institutions, and governments suggest that digital assets like cryptocurrencies will continue to shape the economic and technological future. For investors, technologists, and policymakers, understanding cryptocurrency as a digital asset is essential to navigating the rapidly evolving financial landscape.
Plan Your Trades Wisely: The Importance of a Trading Plan1. Introduction
A trading plan is a blueprint that outlines your approach to the markets. It defines your objectives, risk tolerance, strategies, and evaluation methods. Without a clear plan, traders are prone to impulsive decisions, emotional reactions, and inconsistent results.
Key Reasons to Plan Trades:
Reduces Emotional Trading: Emotional reactions, such as fear and greed, often lead to premature exits or risky entries. A well-structured plan minimizes impulsive decisions.
Enhances Consistency: Trading is a game of probabilities. Consistency in approach allows you to capitalize on high-probability opportunities over time.
Risk Management: A plan defines how much capital you are willing to risk per trade, protecting your portfolio from significant losses.
Improved Decision-Making: When opportunities arise, a plan provides a framework for analysis and decision-making.
2. Components of a Wise Trading Plan
A comprehensive trading plan consists of several core components. Each component ensures that traders are prepared for various market scenarios.
2.1. Setting Goals and Objectives
Financial Goals: Determine realistic profit targets and timeframes. Avoid setting unattainable expectations.
Skill Development Goals: Define personal learning objectives, such as mastering a technical analysis method or understanding a new market segment.
2.2. Market Analysis Strategy
Fundamental Analysis: Evaluate economic indicators, company financials, and market news to understand intrinsic value.
Technical Analysis: Use charts, patterns, and indicators to identify trends, support/resistance levels, and potential trade setups.
Sentiment Analysis: Monitor market psychology and the collective behavior of participants to predict market reactions.
2.3. Trade Entry and Exit Rules
A critical aspect of a trading plan is defining when to enter and exit trades. Clear criteria prevent confusion during high-pressure situations.
Entry Criteria: Specify technical or fundamental conditions that must be met before entering a trade.
Exit Criteria: Include stop-loss levels, profit targets, or trailing stops to manage risk and lock in profits.
2.4. Risk Management
Position Sizing: Decide how much capital to allocate per trade, based on your risk tolerance.
Stop-Loss and Take-Profit: Establish levels to limit losses and secure gains.
Diversification: Avoid overconcentration in a single asset or sector to reduce portfolio risk.
2.5. Record-Keeping and Evaluation
Maintaining a trading journal is essential for long-term improvement. Record all trade details, including entry/exit points, reasoning, outcomes, and emotions during the trade. Regular evaluation helps identify patterns, strengths, and weaknesses.
3. Steps to Planning Trades Wisely
Step 1: Conduct Market Research
Before executing any trade, gather information about market conditions, trends, and volatility. This includes studying charts, reading news, and monitoring relevant data releases. Knowledge is power; informed traders are confident traders.
Step 2: Identify Trading Opportunities
Once the research is complete, filter potential trades based on your strategy. Focus on setups that meet all your criteria. Avoid chasing trades that don’t fit your plan, even if they appear lucrative.
Step 3: Define Trade Parameters
For every trade:
Determine entry and exit points.
Calculate position size based on risk tolerance.
Set stop-loss and take-profit orders.
Confirm that the risk/reward ratio is acceptable (generally a minimum of 1:2 is recommended).
Step 4: Monitor and Adjust
Markets are dynamic. Monitor your trades and be prepared to adjust if the market deviates significantly from expectations. However, avoid overreacting to minor fluctuations.
Step 5: Post-Trade Analysis
After closing a trade, review the results objectively. Analyze what worked, what didn’t, and what could be improved. This continuous learning process is crucial for long-term success.
4. Psychological Discipline in Trading
Even the best plans fail without proper psychological control. Emotional discipline is as important as technical knowledge. Common psychological pitfalls include:
Fear of Missing Out (FOMO): Chasing trades impulsively.
Overtrading: Engaging in too many trades without proper analysis.
Revenge Trading: Attempting to recover losses quickly, often leading to bigger losses.
Confirmation Bias: Only acknowledging information that supports pre-existing beliefs.
Traders must develop patience, emotional resilience, and adherence to their plan.
5. Tools to Enhance Trade Planning
Modern traders have access to advanced tools that can support their planning process:
Trading Platforms: Offer real-time charts, technical indicators, and alerts.
News Feeds and Economic Calendars: Help anticipate market-moving events.
Risk Management Software: Assists in position sizing, stop-loss calculation, and portfolio management.
Trading Journals: Digital or manual journals for detailed trade analysis.
6. Common Mistakes to Avoid
Even experienced traders can make errors. Avoid the following to ensure your trades are planned wisely:
Skipping Analysis: Never trade without proper research.
Ignoring Risk Management: Every trade carries risk; failing to control it can be catastrophic.
Overcomplicating Strategies: Simple, well-tested strategies often outperform overly complex systems.
Neglecting Emotional Control: Emotions can override logic, leading to impulsive decisions.
7. Continuous Improvement
The markets evolve, and so should your trading plan. Regularly review and update strategies, risk parameters, and goals. Learning from both successful and unsuccessful trades strengthens your approach and builds confidence.
Conclusion
“Plan your trades wisely” is more than advice—it is a philosophy for sustainable trading success. A carefully crafted plan addresses analysis, entry and exit rules, risk management, and psychological discipline. It transforms trading from a guessing game into a systematic approach driven by strategy and probability. Traders who commit to planning, self-evaluation, and continuous improvement are more likely to achieve consistent results, protect their capital, and navigate the complexities of financial markets with confidence.

Private vs Public Banks: Role in the Indian Trading Market1. Overview of Public and Private Banks in India
1.1 Public Sector Banks (PSBs)
Public sector banks are those where the majority ownership (more than 50%) lies with the Government of India. Examples include the State Bank of India (SBI), Punjab National Bank (PNB), Bank of Baroda, and Canara Bank. PSBs dominate the Indian banking sector in terms of branch network, assets under management (AUM), and reach, particularly in rural and semi-urban regions.
Key Characteristics of PSBs:
Government-owned with social and development mandates.
Conservative in risk-taking.
Large customer base across rural and urban India.
Often involved in policy-driven lending and financial inclusion schemes.
1.2 Private Sector Banks (PVBs)
Private banks, such as HDFC Bank, ICICI Bank, Axis Bank, and Kotak Mahindra Bank, are owned predominantly by private shareholders. These banks are known for customer-centric approaches, high efficiency, and greater use of technology. They have grown rapidly in the last two decades and now have significant influence in retail, corporate, and investment banking.
Key Characteristics of PVBs:
Privately owned with profit-driven motives.
Higher risk appetite and innovative products.
Focused on urban and semi-urban populations.
Advanced technological adoption and superior customer service.
2. Role in the Indian Trading Market
The Indian trading market comprises equities, commodities, derivatives, forex, and bond markets. Both private and public banks play distinct roles in facilitating trading activities, investment, and capital flow.
2.1 Providing Capital and Liquidity
PSBs: They are crucial in funding large-scale corporate and government projects, which indirectly impacts trading markets by providing liquidity and supporting corporate growth. PSBs often lend to companies whose stocks or bonds are actively traded in the market.
PVBs: These banks are more active in retail lending, margin finance, and funding startups or small-cap companies. By offering working capital, they help increase market participation and trading volumes.
2.2 Investment Banking and Market Operations
PSBs: Traditionally, PSBs have a limited role in high-risk investment banking activities. However, banks like SBI Capital Markets actively participate in primary market issuances (IPOs) and underwriting services, supporting capital formation.
PVBs: Private banks are more aggressive in equity and bond issuance, IPO management, advisory services, and mergers & acquisitions (M&A). They provide liquidity to the trading market and cater to institutional investors, contributing to market depth.
2.3 Facilitating Retail and Institutional Trading
Retail Market: Private banks lead in offering demat accounts, online trading platforms, and wealth management services, making trading accessible to individual investors. PSBs have been slower in digital adoption but still serve a large customer base with affordable services.
Institutional Market: PSBs dominate government securities (G-Secs) trading, large-scale corporate bonds, and interbank transactions, whereas PVBs are more flexible in providing structured products and derivatives to hedge risks in trading portfolios.
3. Technological Innovation and Trading Efficiency
3.1 Digital Platforms
PVBs: Banks like HDFC, ICICI, and Kotak Mahindra have pioneered digital banking solutions, including online trading, mobile apps, algorithmic trading support, and seamless payment gateways. These platforms enhance efficiency in stock, forex, and commodity markets.
PSBs: Although improving, public banks have traditionally lagged in adopting high-speed trading platforms. Their digital offerings are often centralized but less user-friendly for advanced traders.
3.2 Data Analytics and Market Insights
Private banks leverage big data analytics and AI-driven trading advisory, providing traders and investors with market insights, technical analysis, and risk management tools.
Public banks, while increasingly offering research services, focus mainly on policy-driven investment guidance and macroeconomic reports.
4. Risk Management and Market Stability
4.1 Risk Appetite
PSBs: Conservative lending and trading practices help maintain market stability, preventing excessive speculation. However, this may limit high-growth opportunities in trading markets.
PVBs: Their higher risk appetite fosters innovation and liquidity but may also contribute to volatility, especially in derivatives and structured products.
4.2 Crisis Management
PSBs: During market downturns, public banks play a stabilizing role by maintaining credit flow to companies and acting as government channels for economic stimulus.
PVBs: While they provide risk-mitigating tools like hedging products, their reliance on market-driven profits makes them vulnerable during severe market corrections.
5. Role in Government and Policy Initiatives
PSBs are instrumental in implementing government-backed schemes like MUDRA loans, priority sector lending (PSL), and disbursal of subsidies. These measures impact trading indirectly by enhancing disposable income and liquidity in the economy.
PVBs participate in policy initiatives selectively, often aligning with profit motives, such as facilitating corporate bond markets, IPO underwriting, and private wealth management.
6. Impact on Stock, Commodity, and Forex Markets
6.1 Equity Market
PSBs: Major institutional investors; provide long-term funding and participate in strategic equity investments. Their trading volume may be lower but stable.
PVBs: Retail-oriented and innovative products enhance equity market participation. They facilitate derivatives trading, margin financing, and high-frequency trading for active investors.
6.2 Commodity Market
PSBs: Serve as financing partners for commodity producers and importers, ensuring supply chain liquidity.
PVBs: Offer customized hedging solutions and online platforms for commodity trading, attracting active market participants.
6.3 Forex Market
PSBs: Dominant in external commercial borrowing (ECB), trade finance, and remittance services, crucial for forex stability.
PVBs: Provide competitive forex services, real-time trading, and risk management tools for businesses and individual traders.
7. Comparative Analysis: Public vs Private Banks
Aspect Public Sector Banks Private Sector Banks
Ownership Government Private
Risk Appetite Conservative Higher
Market Reach Nationwide, including rural Urban & semi-urban focused
Technology Adoption Moderate High
Retail Trading Support Limited digital services Advanced platforms & apps
Institutional Role Government & corporate Corporate & investment banking
Market Stability Stabilizing Liquidity enhancer, can be volatile
Financial Inclusion High Moderate
Trading Products Traditional bonds, G-Secs Derivatives, structured products, margin trading
8. Challenges and Opportunities
8.1 Challenges
PSBs: Legacy systems, NPA (Non-Performing Asset) issues, slower technological adoption, and bureaucratic decision-making hinder active participation in fast-paced trading markets.
PVBs: Exposure to market volatility, regulatory pressures, and high competition requires constant innovation to remain relevant in trading markets.
8.2 Opportunities
PSBs: Digital transformation, strategic partnerships with fintechs, and expanding advisory services can boost their trading market role.
PVBs: Expanding into rural markets, leveraging AI-driven trading analytics, and tapping government-backed schemes offer growth potential.
9. Conclusion
The roles of public and private banks in the Indian trading market are complementary rather than competitive. Public banks provide stability, government-backed funding, and long-term institutional support, making them pillars of the financial ecosystem. Private banks, in contrast, drive innovation, liquidity, and retail participation through advanced technology, flexible financial products, and customer-centric services.
Together, both sectors enhance market efficiency, capital formation, risk management, and investor confidence, ensuring the Indian trading market remains vibrant and robust. The future of India’s trading ecosystem will increasingly depend on how both public and private banks leverage technology, collaborate with fintechs, and balance risk with sustainable growth.

Part 2 Master Class of Intraday TradingCall and Put Options Explained
A Call Option gives the buyer the right to purchase an asset at a specific price (strike price) before or on the expiry date. Investors buy calls when they expect the asset’s price to rise. Conversely, a Put Option gives the buyer the right to sell the asset at the strike price, used when expecting a price fall. Sellers of options (writers) have obligations—call writers must sell, and put writers must buy if exercised. The interplay between call and put options allows for complex strategies, such as spreads and straddles. Understanding how both function is vital for predicting market direction and building profitable positions.

Part 1 Master Class of Intraday Trading Understanding the Concept of Options
Option trading involves financial contracts that give buyers the right, but not the obligation, to buy or sell an underlying asset—like a stock, index, or commodity—at a predetermined price within a specific period. The two main types are Call Options (buy rights) and Put Options (sell rights). Unlike owning shares directly, options let traders speculate on price movements with limited capital. The right to buy or sell comes at a cost known as the premium. Options are widely used for hedging, speculation, and income generation. Their value is influenced by factors such as volatility, time decay, and market sentiment. Understanding these dynamics helps traders manage risk and seize market opportunities efficiently.

Divergence Secrets Leverage and Risk Management
Options offer leverage, meaning traders control large positions with relatively small investments. A small premium can yield significant gains if the market moves favorably. However, leverage also magnifies losses if predictions fail. Effective risk management—using stop-losses, diversification, and position sizing—is crucial. Many traders use options not just for profit but for hedging—protecting portfolios from adverse movements. Balancing leverage with caution separates professional option traders from speculative risk-takers in the volatile derivatives market.

Part 6 Institutional TradingStrike Price and Expiry Date
Every option contract has a strike price and an expiry date—two critical elements defining its value. The strike price determines the level at which the asset can be bought (for calls) or sold (for puts). The expiry date indicates when the contract becomes void. Options lose value as they near expiry—a process called time decay. Traders must balance risk and timing; shorter expirations offer quick profits but higher risk, while longer expirations provide stability at higher cost. Correct strike and expiry selection define successful strategies.

Part 4 Institutional Trading Option Premiums and Pricing
The premium is the price paid to purchase an option. It depends on factors like the asset’s price, volatility, time to expiration, and strike price. Higher volatility or longer duration increases the premium because of greater potential movement. The premium consists of intrinsic value (real profit potential) and time value (expectation of future movement). Sellers receive this premium as income, while buyers pay it as the cost of opportunity. Understanding premium components helps traders evaluate whether an option is over- or underpriced before entering trades.

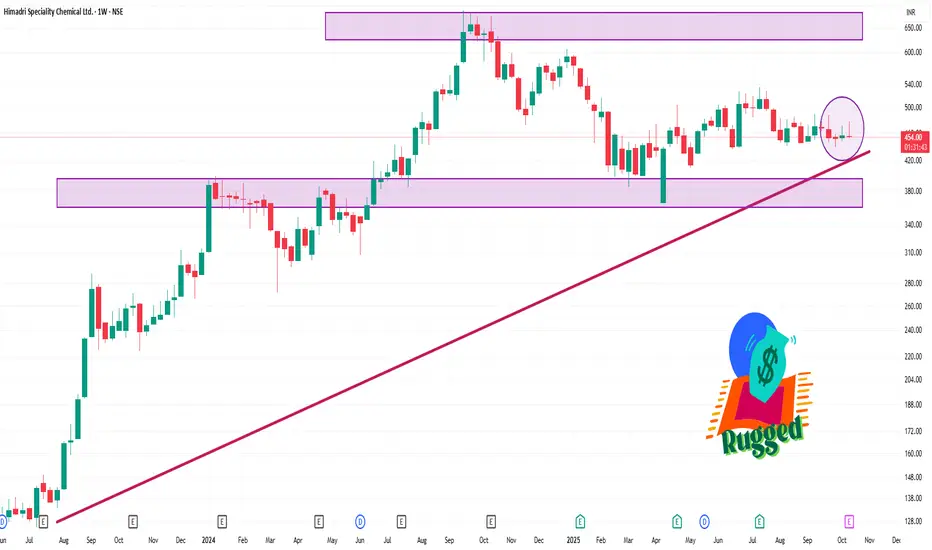
HSCL 1 Week Time Frame 📊 1-Week Technical Overview
Price Change: HSCL has gained approximately 3.35% over the past week.
Day Range: ₹458.60 – ₹469.55
52-Week Range: ₹365.35 – ₹676.20
Volume: 535,912 shares traded
📈 Technical Indicators
Relative Strength Index (RSI): 36.75, suggesting a neutral to slightly oversold condition.
Moving Averages: Short-term (5-day) and medium-term (50-day) moving averages indicate a neutral to slightly bearish outlook.
MACD: The Moving Average Convergence Divergence indicator is negative, reinforcing a bearish sentiment.
ANGELONE 1 Day Time Frame 📊 Key Intraday Levels (1-Day Time Frame)
Current Price: ₹2,540.20
Day’s Range: ₹2,460.70 – ₹2,559.00
Immediate Support: ₹2,351.68
Immediate Resistance: ₹2,492.80
Pivot Point: ₹2,265.13
📈 Trend Outlook
The stock is exhibiting a neutral to bullish trend on the daily chart, with momentum indicators supporting upward movement. However, the stochastic RSI suggests the stock is approaching overbought conditions, warranting caution for short-term traders.
✅ Summary
Short-Term Strategy: Monitor for potential pullbacks near support levels around ₹2,351.68 to ₹2,460.70 for buying opportunities.
Resistance Watch: Key resistance at ₹2,492.80; a breakout above this level could signal further upside.
Caution: Overbought indicators suggest the need for caution in short-term trades.

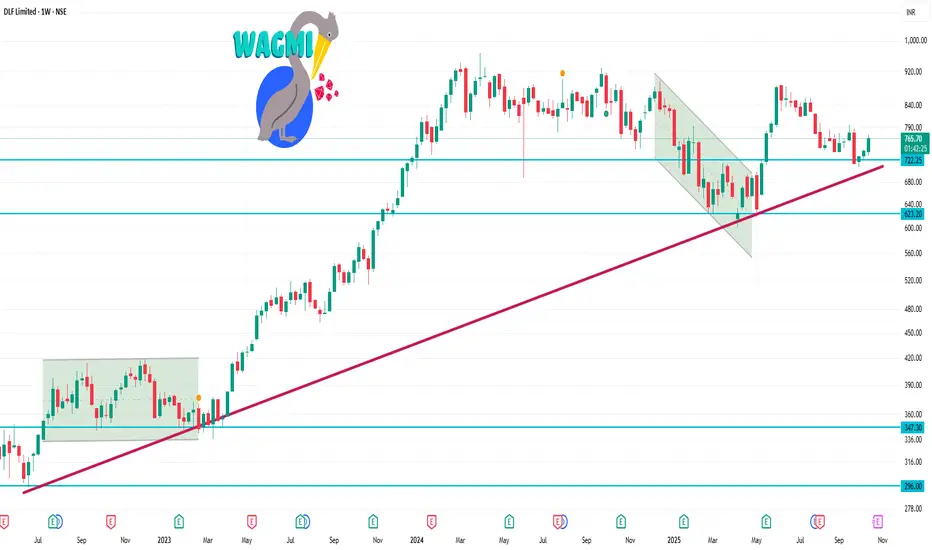
DLF 1 Week time Frame 📈 Technical Indicators (1-Week Outlook)
Relative Strength Index (RSI): Currently at 66.74, indicating bullish momentum but approaching overbought territory.
Moving Averages:
5-Day EMA: ₹741.61 (Buy)
10-Day EMA: ₹735.62 (Buy)
50-Day SMA: ₹754.14 (Buy)
100-Day SMA: ₹789.39 (Sell)
200-Day SMA: ₹745.29 (Buy)
MACD (12,26): 7.21, suggesting a bullish trend.
Stochastic RSI: 79.63, nearing overbought levels.
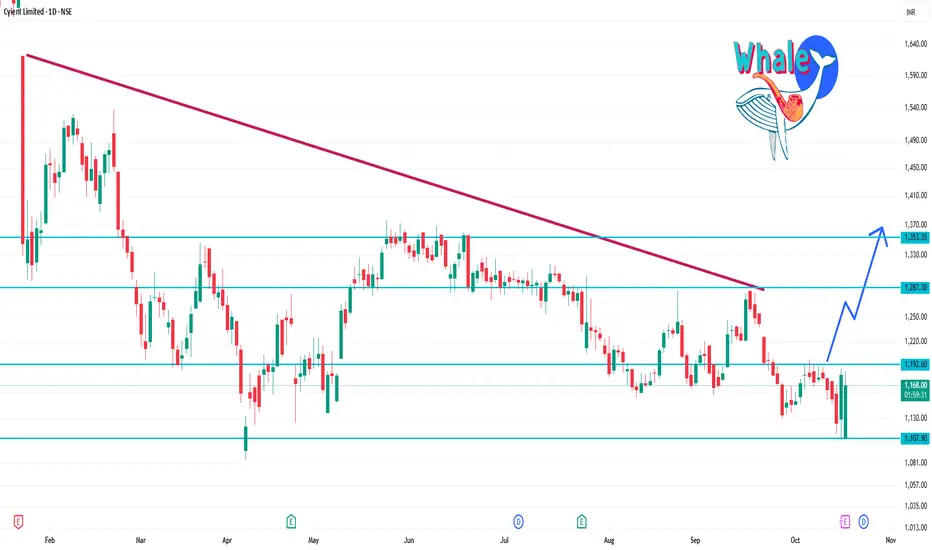
CYIENT 1 Day Time Frame 📈 Key Levels for the 1-Day Time Frame
🔹 Support Levels
Standard Pivot Point (S1): ₹1,158.30
Camarilla S1: ₹1,173.13
Demark Support: ₹1,143.50
🔹 Resistance Levels
Standard Pivot Point (R1): ₹1,210.20
Camarilla R1: ₹1,188.07
Demark Resistance: ₹1,225.00
🔍 Technical Analysis Summary
The stock is trading below its pivot points, with support levels at ₹1,158.30 and resistance at ₹1,210.20. The RSI suggests a bearish trend, and the increased trading volume indicates heightened market activity. Traders should monitor these levels closely for potential breakout or breakdown scenarios.
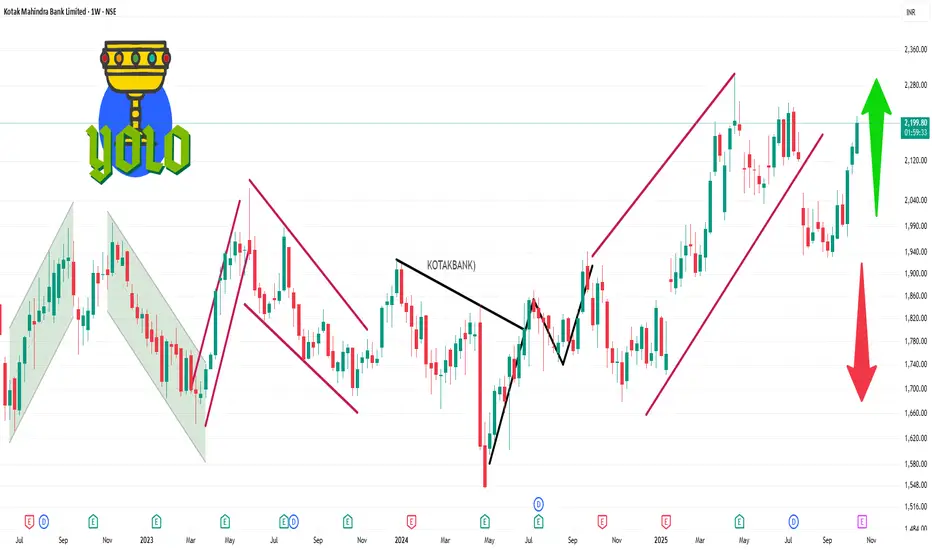
KOTAKBANK 1 Week Time Frame 📊 Weekly Support and Resistance Levels
Immediate Support Levels: ₹2,109.47, ₹2,068.83, ₹2,044.67
Immediate Resistance Levels: ₹2,174.27, ₹2,198.43, ₹2,239.07
A decisive move above ₹2,174.27 could signal a bullish breakout, while a drop below ₹2,109.47 may indicate a bearish trend.
📈 Technical Indicators Summary
RSI (14): 73.44 — Indicates potential overbought conditions.
MACD: 46.92 — Suggests bullish momentum.
ADX (14): 32.50 — Reflects a strong trend.
EMA (5): ₹2,176.59 — Indicates short-term bullishness.
EMA (50): ₹2,067.60 — Supports medium-term bullish outlook.
EMA (200): ₹2,057.89 — Confirms long-term bullish trend.
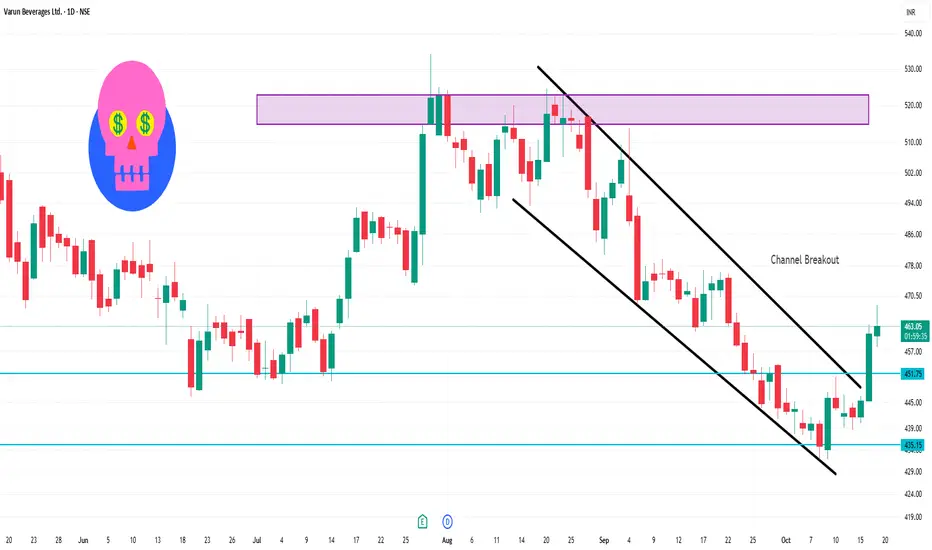
VBL 1 Day Time Frame 📊 Intraday Support & Resistance Levels
Support Levels:
Standard Pivot: ₹468.05
Camarilla Support: ₹459.64
Fibonacci Support: ₹456.70
Resistance Levels:
Standard Pivot: ₹474.80
Camarilla Resistance: ₹462.96
Fibonacci Resistance: ₹474.80
These levels are derived from various pivot point methods, including Standard, Camarilla, and Fibonacci, and are commonly used by traders to identify potential support and resistance zones during intraday trading.
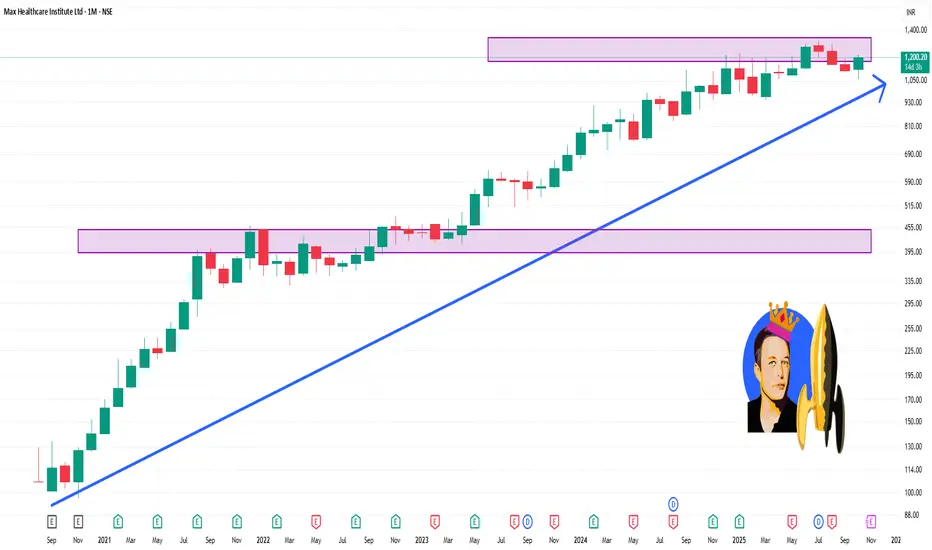
MAXHEALTH 1 Month Time Frame 📈 1-Month Stock Performance
Current Price (as of Oct 17, 2025): ₹1,202.20
1-Month Return: Approximately +1.43% to +4.65%, depending on the data source.
52-Week Range: ₹888.90 – ₹1,314.30.
📊 Price Movement Highlights
Highest Price in the Last Month: ₹1,212.40
Lowest Price in the Last Month: ₹1,060.00
Average Price: ₹1,144.73
📉 Recent Trends
Recent Decline: The stock experienced a dip of about 3.95% on October 3, 2025, reaching ₹1,060.00.
Recent Recovery: On October 6, 2025, the stock rebounded with a 6.59% increase, closing at ₹1,139.70.