Part 2 Support and ResistanceMoneyness of Options
Options are classified based on their relationship with the underlying price:
In-the-Money (ITM)
Call: Spot > Strike
Put: Spot < Strike
At-the-Money (ATM)
Spot ≈ Strike
Out-of-the-Money (OTM)
Call: Spot < Strike
Put: Spot > Strike
Moneyness affects premium value, probability of profit, and risk.
Tradingkitchen

Market Reform FalloutUnderstanding the Aftershocks of Structural Change
Market reforms are often introduced with ambitious goals: boosting efficiency, improving transparency, attracting investment, and accelerating long-term economic growth. Governments, regulators, and international institutions promote reforms as necessary corrections to outdated systems. However, while reforms may promise long-term gains, they almost always generate short-term disruptions, unintended consequences, and social tensions. These consequences—known as market reform fallout—shape economic outcomes far more than policy announcements alone.
Market reform fallout refers to the economic, financial, social, and political aftershocks that emerge when structural changes alter how markets function. These aftershocks can be temporary or persistent, localized or systemic, depending on the scale, speed, and design of reforms.
Why Market Reforms Are Necessary—but Risky
Markets naturally evolve, but institutional rigidities often prevent them from adapting efficiently. Reforms are typically introduced to address:
Inefficiencies and monopolistic practices
Fiscal imbalances and rising public debt
Capital misallocation
Weak financial systems
Low productivity and competitiveness
However, markets are complex adaptive systems. Changing one rule often triggers reactions across employment, capital flows, consumption, and investor sentiment. The gap between policy intent and market reality is where fallout begins.
Short-Term Economic Disruptions
One of the most visible forms of market reform fallout is short-term economic instability.
1. Volatility in Financial Markets
Reforms related to taxation, subsidies, labor laws, or financial regulation can immediately affect earnings expectations. Equity markets often react with sharp volatility as investors reassess risk and profitability. Bond yields may spike if reforms raise inflation or fiscal uncertainty.
Currency markets are particularly sensitive. Capital account liberalization or interest rate reforms can trigger sudden inflows or outflows, leading to exchange rate instability.
2. Slower Growth During Transition
Structural reforms frequently slow economic activity in the short run. Removing subsidies raises input costs, tightening credit reduces liquidity, and deregulation disrupts established supply chains. Businesses often delay investment until policy clarity emerges, creating a temporary growth vacuum.
Employment and Labor Market Fallout
Labor markets are among the most affected areas during reforms.
Job Losses in Legacy Sectors
When governments liberalize industries or privatize public enterprises, inefficient firms often downsize or shut down. While reforms aim to reallocate labor toward productive sectors, the transition is rarely smooth. Workers in traditional industries face job losses before new opportunities emerge.
Informalization Risks
In developing economies, rigid labor reforms can unintentionally expand informal employment. Firms may avoid compliance costs by hiring contract or off-book workers, weakening job security and social protection.
Skill Mismatch
Reforms often favor capital-intensive or technology-driven sectors. Workers without relevant skills struggle to transition, widening inequality and fueling social resistance to reform agendas.
Social and Political Backlash
Economic fallout often spills into the social and political domain.
Rising Inequality
Market reforms may disproportionately benefit capital owners, skilled labor, and urban populations in the early stages. Rural communities, small businesses, and low-income households often bear higher costs through inflation, reduced subsidies, or job losses.
This perception—whether accurate or not—creates political resistance and erodes trust in institutions.
Public Protests and Policy Reversals
History shows that poorly communicated or rapidly implemented reforms can trigger widespread protests. Fuel price reforms, pension restructuring, and agricultural market liberalization are frequent flashpoints.
Political backlash may force governments to dilute or reverse reforms, reducing credibility and increasing policy uncertainty—often worsening the original problem.
Sector-Specific Fallout
Financial Sector Reforms
Banking and capital market reforms strengthen systems in the long run but can initially expose hidden weaknesses. Stricter norms often reveal non-performing assets, leading to credit contraction and reduced lending to businesses.
Agricultural Market Reforms
Reforms aimed at improving price discovery and market access may hurt small farmers if institutional support systems are weak. Without adequate storage, logistics, and bargaining power, farmers may face price volatility rather than stability.
Energy and Commodity Reforms
Removing price controls and subsidies improves fiscal discipline but raises costs for households and industries. Inflationary pressure often follows, forcing central banks to tighten policy—creating a feedback loop of slower growth.
Impact on Investment and Capital Flows
Reforms strongly influence domestic and foreign investment behavior.
Initial Capital Flight
Uncertainty around new rules, taxation, or regulatory enforcement can trigger short-term capital flight. Investors prefer clarity over optimism, and reform phases often involve ambiguity.
Long-Term Capital Attraction
If reforms succeed, they improve transparency, contract enforcement, and market depth. Over time, this attracts patient capital, foreign direct investment, and institutional participation. The challenge lies in surviving the transition phase.
The Role of Timing and Sequencing
One of the biggest determinants of reform fallout is sequencing.
Rapid reforms without institutional readiness amplify shocks
Gradual reforms reduce volatility but risk losing momentum
Poor coordination between fiscal, monetary, and structural policies magnifies instability
Countries that align reforms with business cycles and provide buffers—such as targeted welfare support or credit guarantees—experience milder fallout.
Lessons from Global Experience
Market reform fallout teaches several recurring lessons:
Communication matters as much as policy
Markets and citizens react less to reforms themselves and more to uncertainty around them.
Safety nets are non-negotiable
Without social protection, even economically sound reforms face rejection.
Institutions must evolve alongside markets
Courts, regulators, and enforcement mechanisms must adapt to new rules.
Reforms are political as well as economic
Ignoring distributional impacts leads to instability and reversals.
Conclusion: Fallout Is Not Failure
Market reform fallout is not a sign that reforms are flawed; it is evidence that markets are deeply interconnected with society. Structural change inevitably produces winners and losers, short-term pain and long-term gain. The true measure of reform success lies not in avoiding fallout—but in managing it intelligently.
Well-designed reforms anticipate disruption, protect vulnerable groups, maintain policy credibility, and allow markets time to adjust. When governments acknowledge fallout as part of the reform process rather than denying it, they increase the probability that reforms deliver sustainable growth, resilience, and inclusive prosperity.
In the end, market reforms reshape not just economies—but expectations, behavior, and trust. How leaders navigate the fallout determines whether reform becomes a foundation for progress or a trigger for prolonged instability.

GDP Surge or Stall: What’s Next for the Economy?1. What We Mean by “GDP Surge” and “Stall”
Gross Domestic Product (GDP) measures the total value of goods and services produced in an economy.
A GDP surge means faster‐than‐expected growth — stronger jobs, higher spending, business investment, and rising incomes.
A GDP stall means growth slows or stagnates — often due to weak demand, poor investment, rising costs, or external shocks.
Whether an economy surges or stalls depends on multiple factors — consumer confidence, corporate investment, government policy, global trade, inflation, and unexpected events like wars, pandemics, or climate disasters.
2. Recent Evidence: Where Growth Is Happening
• United States
The U.S. economy has shown unexpected resilience:
Recent data indicates consumer spending remains strong, supporting GDP growth even as inflation cools.
Analysts now forecast U.S. economic growth to outperform earlier expectations in 2026, helped by tax cuts and fading tariff impacts.
However, questions remain over how long this momentum can last, especially if fiscal and monetary support fades or trade tensions rise.
• Eurozone
Europe, despite expectations of stagnation, has consistently expanded:
The Eurozone posted unexpected GDP growth, outperforming forecasts and showing notable resilience across Germany, Spain, and France.
Still, growth is moderate overall, and with inflation near target levels, the region’s outlook remains balanced rather than exuberant.
• India
In the global context, India stands out:
Latest surveys show India’s economy is one of the fastest-growing major economies, with projections near 7%+ growth rates — far above most advanced economies.
That combination of strong domestic demand, investment expansion, moderated inflation, and sectoral resilience explains recent GDP benefits and helps offset slower global growth elsewhere.
3. Why the Economy Surges — and What Fuels It
a. Consumer and Business Spending
High consumer demand — when people keep buying — directly pushes GDP higher as retailers, services, and manufacturers see stronger sales.
Likewise, higher business investment in technology, capital equipment, and infrastructure supports growth by boosting productivity and future output.
b. Policy Support
Monetary easing (lower interest rates) and fiscal stimulus (government spending, tax cuts) have helped sustain growth in key economies by encouraging borrowing and investment.
c. Technological Change and Productivity
Advances in automation, artificial intelligence, and digital platforms can increase productivity — making labor and capital more efficient and pushing GDP upward.
4. Why Growth Sometimes Stalls
a. High Interest Rates and Tight Credit
When central banks raise interest rates to control inflation, borrowing costs rise. Businesses invest less, consumers pull back on big purchases, and growth slows.
Global projections suggest that high rates are contributing to slower demand in many economies, even where inflation is easing.
b. Trade Tensions and Protectionism
Trade disruptions — such as tariffs and barriers — make cross-border commerce more expensive and complicated. That weakens export demand and investment plans in both advanced and emerging markets.
c. Sluggish Investment
Investment remains subdued in many places, partly because of uncertainty about future demand, geopolitical risks, and weaker global trade growth.
d. Structural Challenges
Some economies face long-term drags from aging populations, weak labor force growth, or low productivity, making sustained rapid expansion difficult.
5. Global Outlook: Resilience but Slower Overall Growth
Broad based global forecasts suggest that while the world economy is avoiding a deep recession and maintaining growth, the pace is subdued relative to past decades:
• OECD Projections:
The global economy is expected to grow at a moderate pace (around 3.3% in 2025-26), with slowing activity in some major regions while others like emerging markets outperform.
• United Nations Report:
UN economists see continued sub-3% global growth in 2026 — still positive but below historical highs and with underlying vulnerabilities.
• Divergent Regional Growth:
China’s growth is slowing relative to past decades, Europe remains moderate, and the U.S. is stronger but still cooling relative to post-pandemic surges. Developing economies also face challenges even as they grow faster than advanced ones.
Overall, growth is likely to remain positive, but slower than writing it off as a “boom era” scenario.
6. Risks That Could Stall Growth
Even with resilient headline figures, several risks could flip a surge into stagnation or contraction:
• Escalating Trade Frictions
New tariffs or retaliatory measures could slow global commerce, reduce export demand, and further dampen investment.
• Debt and Financial Stress
High public and private debt raises the risk of financial stress, especially if borrowing costs stay elevated.
• Climate and Extreme Events
Recent warnings stress that many economic models underestimate severe climate risks — such as storms, droughts, and supply disruptions — which can cause sharp economic losses.
• Policy Missteps
Tight monetary policy that overshoots, or fiscal tightening that reduces demand too quickly, can push economies toward stagnation.
7. Policy Paths Forward: Surge vs Stall
The future trajectory depends largely on policy choices governments and central banks make:
• Keeping Inflation in Check Without Killing Growth
Central banks face a balancing act:
Ease too soon → inflation could reignite.
Hold too long → GDP growth slows.
Careful calibration of interest rates and inflation expectations remains essential.
• Fostering Investment and Innovation
Policies that incentivize private investment, support R&D, and modernize infrastructure can help sustain growth momentum, especially in manufacturing and services.
• Trade Cooperation and Stability
Reducing trade frictions, reinforcing predictable rules, and maintaining open markets can boost global growth prospects by encouraging cross-border commerce.
• Climate Resilience and Sustainable Growth
Investing in climate adaptation and green technologies reduces risks from extreme weather and supports new economic sectors.
8. Likely Scenarios: What Comes Next
Moderate Growth Continues
In this base case, global growth stays positive but moderate (~2.5–3.5%), inflation gradually eases, and labor markets remain stable. Growth varies across regions — strong in emerging Asia, moderate in North America, slower in Europe.
Growth Surprise (Upside)
If trade barriers come down, investment picks up, and technological productivity accelerates faster than expected, economies could surge moderately above forecasts without overheating.
Stall or Soft Landing
If monetary tightening is prolonged, trade tensions escalate, or major external shocks occur (e.g., energy crisis or financial stress), growth could slow markedly, approaching stagnation without a deep recession.
9. Individual Nations and Growth Stories
While global averages matter, individual countries tell unique stories:
India is projecting robust growth near or above 7%, driven by strong consumption, investment, and reform momentum.
Eurozone continues modest growth with resilience in domestic demand, despite global headwinds.
United States shows upside momentum but remains sensitive to policy changes and global conditions.
10. Final Takeaway
In short:
✅ GDP Surge is possible in certain economies buoyed by consumer demand, productivity gains, and smart policies.
✅ GDP Stall remains a real risk globally due to high interest rates, trade tensions, weak investment, and external shocks.
📌 The next few years won’t be a simple boom or bust — more likely, we’ll see sub-3% global growth, with pockets of strength and weakness depending on policy and structural forces.

Part 5 Advance Trading Strategies How Institutions Manipulate Premiums
Push underlying price to premium-rich zones.
IV crush after event.
Quick whipsaws to trigger SL of retailers.
Short covering traps.
Events Affecting Options
Budget announcements.
RBI MPC.
Fed decisions.
US inflation & jobs data.
Elections.
Geopolitical events.
IPO listing days.

VTL 1 Day View 📍 Latest Price Context (Daily Close)
Approx. share price: ~₹432 – ₹433 on NSE (close of last session).
Today’s range (recent session): High ~₹468, Low ~₹407.45.
52-week range: Low ~₹361.10, High ~₹539.90.
📊 Key Daily Levels (1-Day Time Frame)
🔑 Pivot & Intraday Levels
(Based on pivot point calculations for the daily session)
Central Pivot (Daily): ~₹412.33 – baseline pivot for directional bias.
📈 Resistance Levels
R1 ~₹418 – ₹423 – first near-term resistance zone.
R2 ~₹423 – ₹429 – next resistance above pivot.
R3 ~₹429 – ₹446 (or higher intraday) – notable upper resistance zone if price strengthens.
👉 Bullish scenario: Daily close above ~₹429-₹435 could trigger further upside momentum toward higher resistance zones (based on recent highs).
📉 Support Levels
S1 ~₹407 – ₹410 – short-term support near today’s low zone.
S2 ~₹401 – ₹405 – secondary support if price declines below S1.
S3 ~₹396 – ₹399 – deeper support on a pullback.
👉 Bearish scenario: A daily close below ~₹401-₹396 may open further decline toward lower support clusters.
📌 Simple Interpretation (Daily TF)
📍 Above Pivot (~₹412): Slightly bullish / range control.
📍 Holding Support (~₹407 – ₹401): Helps limit downside.
📍 Break above ~₹429: Potential for continuation to next resistance area.
📍 Break below ~₹396: Bearish momentum intensifies.
⚠️ Notes
Levels are based on standard pivot and support/resistance derivations — actual intraday price action may vary with market volatility.
For live charts and real-time plotting, it’s best to check TradingView, your broker’s charting tool, or other live market platforms.

STAR 1 Day View 📌 Live Price Snapshot
• Current price: ~₹877.00 on NSE (Last traded)
• Today’s range: ₹791 – ₹908.40
• 52-Week range: ₹513.05 – ₹1,025.00
📊 Daily Pivot & Key Levels (1-Day Timeframe)
These are approximate pivot, support and resistance levels based on the most recent pivot analysis published today:
📍 Pivot Point
Central Pivot: ~ ₹850.8
🛑 Resistance Levels
R1: ~ ₹868.1
R2: ~ ₹891.0
R3: ~ ₹908.3
(These are short-term upside barriers where price may slow/reverse)
🟩 Support Levels
S1: ~ ₹827.9
S2: ~ ₹810.6
S3: ~ ₹787.7
(These are immediate downside zones where price could find buying interest)
📌 How to Use These Levels Today
✔ Bullish view:
• Above Pivot ₹850.8 → watch for closing above R1 (~₹868) to strengthen upside bias.
• Breaking and holding above R2 (~₹891) could extend toward R3 (~₹908).
✔ Bearish/Range view:
• Failure below Pivot ₹850.8 or S1 (~₹827.9) increases odds of deeper correction toward S2/S3.
• Intraday rejections at R1/R2 can signal short-term sellers.

Part 3 Institutional VS. TechnicalHow Option Premium Works
The premium is the price of the option. It has two parts:
1. Intrinsic Value
The real value if exercised today.
For calls:
Intrinsic = Spot Price – Strike Price
For puts:
Intrinsic = Strike Price – Spot Price
2. Time Value
Extra value due to remaining time before expiration.
Options with more time left are more expensive because:
There’s more chance the trade will go in your favor.
Volatility increases the uncertainty (and potential profit).

Part 4 Technical Analysis Vs Institution Option TradingA. When to Buy Options
Breakout from consolidation
High volume at breakout
Trend confirmed
IV low → premiums cheap
Clear direction available
B. When to Sell Options
Range-bound market
No trending structure
IV high → premiums expensive
Event after event → IV crash expected

Part 1 Technical Analysis Vs Institution Option Trading What Are Options?
Options are contracts, not shares.
They give you a right (not an obligation) to buy or sell an underlying asset—usually a stock or index—at a predetermined price.
You do not own the stock, you only trade the contract.
Options derive their value from something else → an index (Nifty, Bank Nifty), stock (Reliance, TCS), or commodities (gold).
Therefore, they are called “derivatives.”
Two basic types:
Call Option (CE) → Right to buy
Put Option (PE) → Right to sell
You can either Buy or Sell (Write) both types.
Option trading allows profits in up, down, and sideways markets.

Part 3 Institutional vs. TechnicalOption Trading StrategiesHere are some popular option trading strategies:
1. Long Call/Put- Long Call: Buy call option to bet on price increase.
- Long Put: Buy put option to bet on price decrease.
2. Covered Call- Sell call option on stock you own to generate income.
3. Protective Put- Buy put option on stock you own to hedge against losses.
4. Straddle- Buy call and put options at same strike price and expiry to profit from volatility.
5. Spread Strategies- Bull Call Spread: Buy call at lower strike, sell call at higher strike.
- Bear Put Spread: Buy put at higher strike, sell put at lower strike.

Gold & Silver as Safe-Haven and Hedge AssetsWhat Is a Safe-Haven Asset?
A safe-haven asset is one that tends to retain or increase its value during times of market stress. When equities fall sharply, currencies weaken, or financial systems face instability, capital often flows into assets perceived as stable and trustworthy. Gold and silver are classic examples because they are:
Tangible and finite resources
Independent of any single government or central bank
Globally accepted stores of value
Unlike fiat currencies, which can be printed in unlimited quantities, precious metals have natural supply constraints. This scarcity underpins their long-term value and makes them reliable during crises.
Gold: The Ultimate Safe-Haven Asset
Gold is widely considered the purest safe-haven asset in global markets.
1. Store of Value Across Centuries
Gold has preserved purchasing power over extremely long periods. While paper currencies have repeatedly collapsed due to hyperinflation, political upheaval, or excessive debt, gold has consistently retained value. This historical trust makes it a natural refuge when confidence in financial systems erodes.
2. Hedge Against Inflation
Inflation reduces the real value of money. When prices rise and purchasing power falls, gold often performs well. This is because gold prices tend to adjust upward as investors seek protection from currency debasement. During periods of high inflation or negative real interest rates, gold becomes particularly attractive.
3. Protection Against Currency Devaluation
Gold is priced globally in US dollars, but its value transcends any single currency. When a domestic currency weakens—due to fiscal deficits, monetary easing, or balance-of-payments stress—gold often rises in local currency terms. For emerging markets, including India, gold has historically acted as a shield against rupee depreciation.
4. Crisis and Geopolitical Hedge
Wars, financial crises, pandemics, and banking failures often trigger a “flight to safety.” In such moments, gold demand surges from investors, central banks, and institutions. Central banks themselves hold gold as part of foreign exchange reserves, reinforcing its role as a monetary anchor.
5. Portfolio Diversification
Gold typically has a low or negative correlation with equities and bonds during stress periods. This makes it an effective diversification tool. Even a modest allocation to gold can reduce overall portfolio volatility and drawdowns during market crashes.
Silver: The Hybrid Safe-Haven Asset
Silver shares many characteristics with gold but has a dual identity—part monetary metal, part industrial commodity.
1. Monetary and Investment Demand
Like gold, silver has been used as money throughout history. It attracts investment demand during inflationary periods and financial uncertainty, especially from retail investors due to its lower price per unit compared to gold.
2. Industrial Utility
Unlike gold, a large portion of silver demand comes from industrial applications—electronics, solar panels, medical devices, batteries, and electric vehicles. This gives silver an additional growth driver tied to economic expansion and technological progress.
3. Inflation Hedge with Higher Volatility
Silver can act as an inflation hedge, but its price tends to be more volatile than gold. During strong economic recoveries or reflationary phases, silver often outperforms gold, while during sharp crises gold usually remains more stable.
4. Leverage to Gold
Historically, silver tends to amplify gold’s moves. When gold enters a strong bull market, silver often rises faster in percentage terms. This makes silver attractive to investors seeking higher upside, albeit with greater risk.
Gold vs Silver as Hedges
While both metals act as hedges, they serve slightly different roles:
Gold: Best for capital preservation, crisis protection, and stability
Silver: Better for growth-linked hedging and higher return potential
Gold is favored by central banks and conservative investors, while silver appeals more to tactical and cyclical investors.
Role During Economic Cycles
Recession or Crisis
Gold usually performs strongly
Silver may lag initially due to weaker industrial demand
High Inflation / Stagflation
Both gold and silver tend to rise
Silver can outperform if inflation coincides with supply constraints
Economic Recovery / Growth Boom
Gold may consolidate
Silver often benefits from rising industrial demand
Rising Interest Rates
Short-term pressure on both metals
Long-term performance depends on real interest rates (rates minus inflation)
Ways to Invest in Gold and Silver
Investors can gain exposure through multiple avenues:
Physical metals (coins, bars, jewelry)
ETFs and mutual funds backed by bullion
Sovereign gold bonds (especially relevant in India)
Futures and options for active traders
Mining stocks for leveraged exposure
Each method has different risk, liquidity, and cost considerations.
Limitations and Risks
Despite their strengths, gold and silver are not perfect hedges:
They do not generate income like dividends or interest
Prices can remain flat for long periods
Short-term volatility, especially in silver, can be high
Performance depends heavily on macro factors such as real interest rates and dollar strength
Therefore, they are best used as portfolio stabilizers, not return-maximizing assets.
Conclusion
Gold and silver remain indispensable components of a well-balanced investment strategy. Gold stands as the ultimate safe-haven—offering protection against inflation, currency erosion, systemic risk, and geopolitical uncertainty. Silver complements gold with its dual role as a monetary metal and industrial commodity, providing both defensive qualities and growth potential.

AXISBANK 1 Week Time Frame 📈 Current Price Context
Axis Bank is trading around ₹1,300–₹1,305 range recently.
🔑 1‑Week Pivot & Key Levels
These levels are commonly used by traders to identify likely reversal zones or breakouts for the week ahead:
🔥 Weekly Resistance (Upside Targets)
1. R1: ~₹1,317–₹1,320 – First resistance zone this week.
2. R2: ~₹1,341–₹1,342 – Next resistance zone if bullish momentum continues.
3. R3: ~₹1,370+ (approx) – Major higher resistance for breakout scenario.
👉 Bullish condition: Week closes above ₹1,317–₹1,320 with volume → look for extended upside moves toward ₹1,340+.
🛡️ Weekly Support (Downside Floors)
1. S1: ~₹1,262–₹1,265 – Near‑term support for the week.
2. S2: ~₹1,230 – Mid‑range support if breakdown below first support happens.
3. S3: ~₹1,206 – Broader downside support level.
👉 Bearish condition: Cleared break below ₹1,262–₹1,265 may accelerate downside toward ₹1,230 → ₹1,206.
📊 Support/Resistance (Pivot‑Based Technical)
From short‑term pivot derivations (daily/weekly calculations):
Resistance
R1: ~₹1,306–₹1,307
R2: ~₹1,319–₹1,320
R3: ~₹1,329–₹1,330
Support
S1: ~₹1,284–₹1,285
S2: ~₹1,274–₹1,275
S3: ~₹1,261–₹1,262
These extra pivot levels (especially R1/R2/S1/S2) help fine‑tune next day or mid‑week entries.
📌 How to Use This Weekly Level View
📈 Bullish Scenario
Hold above ₹1,317–₹1,320 zone
Short‑term resistance becomes support on breakout
Targets → ₹1,340 → ₹1,373+
📉 Bearish Scenario
Close below ₹1,262–₹1,265
Potential decline toward ₹1,230 → ₹1,206 zones
📊 Consolidation Range
If price stays between ₹1,262–₹1,320 → expect range‑bound trading for the week.

The Resurgence of India’s Public Sector Banking PowerHistorical Challenges Faced by PSU Banks
For a long time, PSU banks struggled under the weight of stressed assets, particularly after the corporate lending boom of the mid-2000s. Aggressive lending to infrastructure, power, steel, and telecom sectors, combined with economic slowdowns and policy bottlenecks, led to a sharp rise in NPAs. Weak credit appraisal systems, governance challenges, and limited autonomy further constrained performance. As a result, profitability declined, capital adequacy weakened, and market valuations remained subdued compared to private sector banks.
Government-Led Reforms and Recapitalization
A major catalyst behind the rise of PSU banks has been decisive government intervention. Large-scale recapitalization programs injected much-needed capital into banks, strengthening their balance sheets and enabling them to meet regulatory requirements. The government also initiated governance reforms, including improved board oversight, professional management practices, and performance-linked accountability. These steps restored stability and provided PSU banks with the confidence to resume lending activity.
Resolution of NPAs and Improved Asset Quality
One of the most significant contributors to the revival of PSU banks is the sharp improvement in asset quality. The introduction of the Insolvency and Bankruptcy Code (IBC) created a structured mechanism for resolving stressed assets. Through recoveries, write-offs, and better provisioning practices, gross and net NPAs declined substantially across major PSU banks. Improved asset quality reduced credit costs, directly boosting profitability and strengthening investor sentiment.
Robust Credit Growth and Economic Recovery
India’s economic recovery and sustained growth momentum have provided a favorable backdrop for PSU banks. Rising demand for credit from infrastructure, manufacturing, MSMEs, agriculture, and retail segments has supported healthy loan growth. Government-led capital expenditure on roads, railways, defense, and renewable energy has especially benefited PSU banks, given their strong presence in project financing and public sector lending. This renewed credit cycle has translated into higher interest income and better utilization of capital.
Digital Transformation and Operational Efficiency
PSU banks have made significant strides in digital transformation, narrowing the gap with private sector peers. Investments in core banking systems, digital payment platforms, mobile banking apps, and fintech partnerships have improved customer experience and operational efficiency. Automation and data analytics have enhanced risk management and credit monitoring, reducing the likelihood of future asset quality stress. These technological upgrades have helped PSU banks remain competitive in an increasingly digital financial ecosystem.
Improved Profitability and Financial Metrics
As asset quality improved and credit growth picked up, PSU banks began reporting strong financial results. Many leading PSU banks have posted record profits, supported by lower provisioning requirements, stable net interest margins, and improved cost management. Capital adequacy ratios have strengthened, return on assets has improved, and balance sheets appear more resilient. This financial turnaround has been a key driver behind the rising stock market performance of PSU bank shares.
Investor Confidence and Market Re-Rating
The improved fundamentals of PSU banks have not gone unnoticed by investors. After years of underperformance, PSU bank stocks have seen significant re-rating in the equity markets. Domestic institutional investors and retail participants have shown renewed interest, attracted by improving earnings visibility, reasonable valuations, and strong dividend potential. The rising performance of PSU banks has also contributed positively to broader banking and financial sector indices.
Strategic Role in Financial Inclusion and Social Objectives
Beyond profitability, PSU banks continue to play a vital role in financial inclusion and social development. They are instrumental in implementing government schemes such as Jan Dhan Yojana, Direct Benefit Transfers (DBT), Mudra loans, and agricultural credit programs. Their extensive branch network in rural and semi-urban areas enables them to support inclusive growth while simultaneously expanding their customer base. This dual role of commercial performance and social responsibility strengthens their long-term relevance.
Challenges That Remain
Despite the impressive rise, PSU banks still face challenges. Competition from agile private banks and fintechs remains intense. Maintaining asset quality during rapid credit expansion requires disciplined risk management. Governance reforms must be sustained to ensure autonomy, transparency, and accountability. Additionally, global economic uncertainties, interest rate volatility, and sector-specific stress could test the resilience of PSU banks in the future.
Outlook: A Sustainable Revival
The rise of PSU banks marks a structural shift rather than a short-term recovery. With cleaner balance sheets, stronger capital positions, improved governance, and supportive macroeconomic conditions, PSU banks are well-positioned to sustain growth. Their role in financing India’s infrastructure push, supporting MSMEs, and expanding financial inclusion will remain crucial in the coming years. If reforms continue and risk management remains prudent, PSU banks are likely to emerge as stable, profitable, and trusted institutions in India’s financial landscape.
Conclusion
The resurgence of PSU banks represents one of the most significant success stories in India’s financial sector in recent times. From grappling with severe stress to delivering strong financial performance, PSU banks have demonstrated resilience and adaptability. Their rising trajectory reflects the combined impact of policy reforms, economic recovery, and internal transformation. As they continue to evolve, PSU banks are set to play a central role in shaping India’s growth story, reinforcing confidence in the public sector banking system, and contributing to long-term economic stability.

Candle Patterns How Candle Patterns Work with Market Structure
Candles do not work well in isolation. Their true power emerges when aligned with:
Support/Resistance Levels
Trend Direction
Breakouts and Pullbacks
Volume Profile Zones (HVN, LVN)
For example:
A Hammer at support = reliable reversal.
A Doji at resistance = caution for buyers.
Engulfing pattern after liquidity sweep = strong reversal.
Market structure helps validate candlestick signals and improve accuracy.

Sub-Brokers in the Indian Stock MarketRole, Structure, Opportunities, and Challenges
The Indian stock market is one of the fastest-growing financial markets in the world, supported by a wide network of intermediaries who connect investors with stock exchanges. Among these intermediaries, sub-brokers play a crucial role. They act as an important bridge between registered stockbrokers and retail investors, especially in semi-urban and rural regions of India. Understanding sub-brokers is essential for anyone looking to participate in the Indian securities market, either as an investor or as a market intermediary.
Meaning of Sub-Brokers in India
A sub-broker is an individual or entity that acts on behalf of a registered stockbroker to assist investors in trading securities. Sub-brokers do not have direct membership with stock exchanges such as NSE (National Stock Exchange) or BSE (Bombay Stock Exchange). Instead, they operate under a main broker (also called a trading member) and help clients open trading and demat accounts, place trades, and understand market products.
Sub-brokers are registered with SEBI (Securities and Exchange Board of India) and must comply with its regulations. Their primary role is client acquisition and servicing, while the execution of trades and clearing is handled by the main broker.
Regulatory Framework and Registration
SEBI governs the functioning of sub-brokers in India to ensure transparency, investor protection, and ethical conduct. To become a sub-broker, an individual or firm must:
Register with SEBI through a registered stockbroker
Fulfill eligibility criteria such as educational qualifications and certification (e.g., NISM certification)
Pay the prescribed registration fees
Comply with SEBI’s code of conduct
Sub-brokers must also adhere to KYC (Know Your Customer) norms, anti-money laundering guidelines, and regular compliance reporting. In recent years, SEBI has streamlined and modernized regulations, encouraging digital onboarding and higher accountability.
Role and Functions of Sub-Brokers
Sub-brokers perform multiple functions in the Indian market ecosystem:
Client Acquisition
One of the most important roles of a sub-broker is to bring new investors into the stock market. They leverage personal relationships, local presence, and trust to onboard clients who may not be comfortable dealing directly with large brokerage firms.
Investor Education and Guidance
Sub-brokers educate clients about equity, derivatives, mutual funds, commodities, and other financial instruments. They help investors understand market risks, trading strategies, and regulatory requirements.
Account Opening and Documentation
They assist clients in opening trading and demat accounts, completing KYC formalities, and linking bank accounts.
Order Placement and Trade Support
Sub-brokers help clients place buy and sell orders through the broker’s trading platform and provide support during market hours.
Relationship Management
Personalized service is a key strength of sub-brokers. They maintain long-term relationships with clients, offering customized solutions and timely support.
Types of Sub-Brokers in India
Sub-brokers in India can be broadly classified into different categories:
Individual Sub-Brokers: Independent professionals operating in a specific locality
Franchise Sub-Brokers: Operating under a brokerage brand with office infrastructure
Remisiers: Focus mainly on client referrals and earn commission without handling operations
Digital Partners: Sub-brokers associated with online or discount brokers, focusing on digital client acquisition
Each type differs in terms of responsibilities, revenue sharing, and operational involvement.
Revenue Model and Earnings
Sub-brokers earn income through commission sharing with the main broker. The revenue depends on:
Trading volume generated by clients
Brokerage structure (percentage-based or flat fee)
Number of active clients
Product mix (equity, derivatives, commodities, mutual funds)
Typically, sub-brokers receive 40% to 70% of the brokerage generated by their clients. Those with a strong client base and high trading volumes can earn substantial and recurring income. However, earnings are not fixed and depend heavily on market activity.
Importance of Sub-Brokers in the Indian Market
Sub-brokers have been instrumental in expanding the reach of the Indian stock market. Their importance includes:
Financial Inclusion: Bringing first-time investors into the market
Regional Penetration: Serving small towns and rural areas
Trust-Based Relationships: Offering comfort to investors unfamiliar with online trading
Market Awareness: Promoting financial literacy and investment culture
Even with the rise of discount brokers and online platforms, sub-brokers remain relevant due to their personalized approach.
Impact of Technology and Changing Market Structure
Technology has significantly transformed the role of sub-brokers. Online trading platforms, mobile apps, and digital KYC have reduced manual processes. Modern sub-brokers now focus more on advisory, education, and relationship management rather than just order placement.
At the same time, the growth of discount brokers has increased competition, putting pressure on traditional commission-based models. Sub-brokers who adapt by offering value-added services such as portfolio guidance, research insights, and financial planning are better positioned for long-term success.
Challenges Faced by Sub-Brokers
Despite their importance, sub-brokers face several challenges:
Regulatory Compliance: Increasing compliance requirements demand time and resources
Margin Pressure: Lower brokerage rates reduce earnings
Technological Adaptation: Need to stay updated with digital platforms
Market Volatility: Income fluctuates with market conditions
Client Expectations: Investors expect faster service and expert-level guidance
To survive and grow, sub-brokers must continuously upgrade skills and services.
Future of Sub-Brokers in India
The future of sub-brokers in India is evolving rather than disappearing. While pure execution-based roles may decline, advisory-driven and relationship-focused sub-brokers will remain in demand. SEBI’s emphasis on investor protection and transparency will further professionalize the sub-broker ecosystem.
Sub-brokers who embrace technology, diversify product offerings, and focus on long-term client value will continue to play a significant role in India’s capital markets.
Conclusion
Sub-brokers are a vital part of the Indian stock market structure. They act as trusted intermediaries, educators, and facilitators for millions of investors. Despite facing regulatory and competitive challenges, sub-brokers continue to contribute to market growth and financial inclusion. As the Indian market matures, the role of sub-brokers will shift from simple intermediaries to comprehensive financial partners, ensuring their relevance in the years to come.

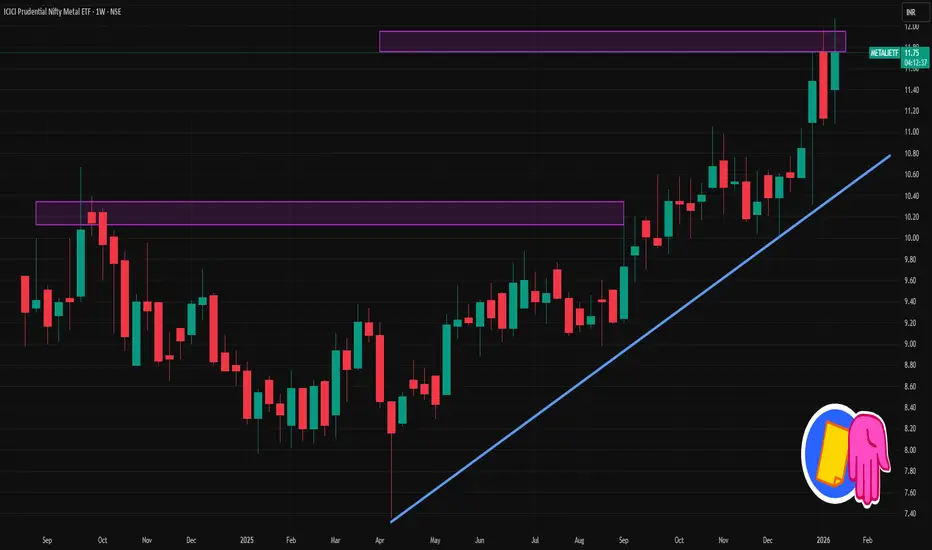
METALIETF 1 Week Time Frame 📊 Current Context (Latest Price)
• The ETF is trading around ₹11.6–₹11.8 (mid‑Jan 2026 data).
📈 Weekly Technical Levels (Pivot‑Based Support / Resistance)
From the weekly pivot point analysis:
Weekly Pivot Point (Center): ~ ₹11.38
This is a key level — above it suggests bullish bias on weekly charts.
Weekly Resistance Levels:
R1: ~ ₹11.71 — first upside target/resistance
R2: ~ ₹12.28 — secondary resistance zone
R3: ~ ₹12.61 — further supply zone if momentum continues
Weekly Support Levels:
S1: ~ ₹11.05 — initial support on pullbacks
S2: ~ ₹10.81 — next support below
S3: ~ ₹10.48 — deeper weekly support
Central Pivot Range (CPR):
Top CPR ~ 11.51
Bottom CPR ~ 11.26
This band often acts as a weekly equilibrium zone — trading above it keeps bulls in control.
📌 Summary – Weekly Key Levels
Level Type Price (₹)
Weekly Resistance 3 (R3) ~11.52
Weekly Resistance 2 (R2) ~11.28
Weekly Resistance 1 (R1) ~11.06
Weekly Pivot ~10.82
Weekly Support 1 (S1) ~10.60
Weekly Support 2 (S2) ~10.36
Weekly Support 3 (S3) ~10.14
HINDZINC 1 Week Time Frame 📌 Current Context (mid‑Jan 2026)
• The stock is trading around ~₹640‑₹654 on NSE.
📊 1‑Week Key Levels (Support & Resistance)
🔄 Weekly Pivot (Standard)
Pivot (weekly baseline): ~₹615‑₹642 (varies slightly by method)
📈 Resistance Levels
R1: ~₹642‑₹677 (immediate weekly resistance)
R2: ~₹677‑₹688 (secondary supply zone)
R3: ~₹704‑₹706+ (higher hurdle)
📉 Support Levels
S1: ~₹579‑₹614 (first weekly support band)
S2: ~₹552‑₹580 (next downside cushion)
S3: ~₹516‑₹553 (deeper support zone)
📉 Weekly Swing Range (Indicative)
Likely weekly range for HINDZINC over next 4–5 sessions:
➡️ Upside: ~₹675‑₹705+ (on strong bullish momentum)
➡️ Downside: ~₹550‑₹580 (if markets soften)
This range assumes standard weekly pivot behavior and typical momentum — actual moves may vary with broader market catalysts like metals index moves or commodity price shifts.

Best Sectors for Dip BuyingTurning Market Corrections into Long-Term Opportunities
Dip buying is a popular investment strategy where investors purchase fundamentally strong assets during temporary market declines. Instead of fearing corrections, experienced investors view dips as opportunities to enter quality sectors at attractive valuations. However, successful dip buying is not about buying everything that falls; it is about identifying the right sectors—those with strong long-term growth potential, resilient demand, and solid fundamentals—that are likely to recover and outperform over time.
Below is an in-depth explanation of the best sectors for dip buying, why they work well during corrections, and how investors can approach them strategically.
1. Information Technology (IT & Digital Services)
The technology sector remains one of the most attractive for dip buying because of its structural growth. Temporary sell-offs often occur due to global recession fears, interest rate hikes, or short-term earnings pressure, but the long-term demand for digital solutions remains intact.
Cloud computing, artificial intelligence, cybersecurity, data analytics, and automation are now essential for businesses worldwide. Even when companies reduce discretionary spending, they continue to invest in technology to improve efficiency and reduce costs. Large, well-established IT companies usually have strong balance sheets, recurring revenue models, and global clients, which makes them resilient.
Why dip buying works here:
Long-term secular growth
High margins and scalable business models
Strong cash flows in large-cap tech
2. Banking and Financial Services
Financial stocks often correct sharply during economic slowdowns, interest rate uncertainty, or liquidity concerns. These corrections can create excellent dip-buying opportunities, especially in well-capitalized banks and financial institutions.
As economies stabilize, credit growth resumes, non-performing assets decline, and profitability improves. In countries like India, long-term drivers such as financial inclusion, digital banking, credit penetration, and rising incomes support sustained growth in the financial sector.
Why dip buying works here:
Core sector linked to economic growth
Valuations become attractive during stress
Strong recovery cycles after downturns
3. Pharmaceuticals and Healthcare
Healthcare is a defensive sector, making it ideal for dip buying during volatile markets. Demand for medicines, diagnostics, hospitals, and healthcare services remains stable regardless of economic conditions.
Pharmaceutical stocks may correct due to regulatory issues, pricing pressure, or temporary margin contraction. However, companies with strong product pipelines, global presence, and research capabilities tend to recover well. Aging populations, rising healthcare awareness, and increased insurance coverage provide long-term growth visibility.
Why dip buying works here:
Non-cyclical demand
Stable cash flows
Strong export and global exposure
4. Fast-Moving Consumer Goods (FMCG / Consumer Staples)
FMCG companies sell everyday essentials such as food, beverages, personal care, and household products. These businesses are highly resilient because consumers continue to buy essentials even during economic slowdowns.
Market corrections often lead to valuation compression in FMCG stocks, especially when input costs rise or demand growth slows temporarily. For long-term investors, these dips offer an opportunity to buy quality brands with strong distribution networks and pricing power.
Why dip buying works here:
Stable earnings and dividends
Strong brand loyalty
Low business risk over the long term
5. Infrastructure and Capital Goods
Infrastructure and capital goods stocks are highly cyclical and tend to correct sharply during periods of uncertainty. However, this volatility makes them attractive for dip buying when supported by strong policy and investment cycles.
Government spending on roads, railways, power, defense, and urban infrastructure acts as a major growth driver. When order inflows are strong and balance sheets improve, these companies can deliver significant returns during recovery phases.
Why dip buying works here:
High operating leverage during upcycles
Strong order books post-correction
Beneficiaries of government-led growth
6. Energy and Power
Energy stocks, including oil & gas, power generation, and renewable energy, often experience volatility due to fluctuations in commodity prices, geopolitical events, and regulatory changes. These corrections can provide attractive entry points.
Traditional energy companies benefit from steady demand, while renewable energy players gain from the global transition toward clean energy. Long-term energy consumption continues to rise, especially in emerging markets.
Why dip buying works here:
Essential sector for economic activity
Strong cash generation in large players
Long-term transition opportunities in renewables
7. Automobiles and Auto Ancillaries
The auto sector is cyclical and sensitive to interest rates, fuel prices, and consumer sentiment. As a result, it frequently undergoes corrections. However, long-term demand drivers such as urbanization, rising incomes, and mobility needs remain strong.
Additionally, electric vehicles (EVs), hybrid technology, and advanced auto components are creating new growth avenues. Strong companies with efficient cost structures and innovation capabilities tend to bounce back sharply after downturns.
Why dip buying works here:
Cyclical recoveries offer strong upside
Structural shift toward EVs and technology
Export opportunities in auto components
8. Metals and Commodities
Metal and commodity stocks are highly volatile, reacting quickly to global growth expectations, currency movements, and supply-demand dynamics. Sharp corrections are common, but they also present opportunities for disciplined investors.
When global demand recovers or supply constraints emerge, commodity prices can rise rapidly, leading to strong profit growth for producers. Focus should be on low-cost producers with strong balance sheets.
Why dip buying works here:
Strong mean reversion cycles
High profits during commodity upswings
Global demand-driven recovery potential
9. Telecom and Digital Infrastructure
Telecom companies provide essential connectivity services, making them relatively defensive. Heavy investments and regulatory challenges can lead to temporary stock corrections, but long-term data consumption continues to grow exponentially.
With the rise of 5G, digital payments, OTT platforms, and internet penetration, telecom and digital infrastructure companies are well-positioned for sustained growth.
Why dip buying works here:
Recurring revenue models
Essential service status
Long-term digital consumption growth
10. Consumption and Retail (Discretionary)
Consumer discretionary stocks, such as retail, travel, entertainment, and lifestyle brands, are hit hardest during economic slowdowns. This makes them risky but highly rewarding for dip buying when the cycle turns.
As confidence improves and spending rebounds, these stocks often deliver sharp recoveries. Selecting companies with strong brands, efficient operations, and online presence is crucial.
Why dip buying works here:
High rebound potential post-recovery
Rising middle-class consumption
Strong earnings growth in expansions
Conclusion: Strategy Matters More Than Timing
Dip buying works best when combined with sector selection, patience, and risk management. The goal is not to catch the exact bottom but to accumulate quality sectors during periods of pessimism. Focus on industries with strong long-term fundamentals, capable management, and sustainable demand.
Diversifying across multiple strong sectors, investing in phases, and aligning investments with long-term goals can turn market corrections into wealth-building opportunities. In the long run, disciplined dip buying in the right sectors can significantly enhance portfolio returns while reducing emotional decision-making.

The Framework That Protects Markets and InvestorsTrading Regulations:
Trading regulations form the backbone of modern financial markets. They define how markets operate, who can participate, what instruments can be traded, and how risks are managed. Without regulation, markets would be vulnerable to manipulation, fraud, excessive speculation, and systemic crises. Over time, governments and regulatory bodies across the world have developed comprehensive trading regulations to ensure transparency, fairness, stability, and investor protection. Understanding trading regulations is essential for traders, investors, brokers, and institutions because compliance is not optional—it is fundamental to sustainable participation in financial markets.
Meaning and Purpose of Trading Regulations
Trading regulations are a set of rules, laws, and guidelines established by regulatory authorities to govern the buying and selling of financial instruments such as stocks, bonds, derivatives, commodities, and currencies. The primary purpose of these regulations is to maintain orderly markets, protect investors from unfair practices, reduce systemic risk, and promote confidence in the financial system.
Markets thrive on trust. When participants believe that prices are fair, information is transparent, and misconduct is punished, they are more willing to invest capital. Trading regulations aim to create this trust by enforcing disclosure standards, monitoring trading activity, and penalizing illegal behavior like insider trading or market manipulation.
Key Regulatory Authorities Across the World
Every country has one or more regulatory bodies responsible for overseeing financial markets. In India, the Securities and Exchange Board of India (SEBI) regulates equity, derivatives, and mutual fund markets, while the Reserve Bank of India (RBI) oversees currency markets and banking-related trading. In the United States, agencies like the Securities and Exchange Commission (SEC) and the Commodity Futures Trading Commission (CFTC) regulate securities and derivatives markets. Globally, organizations such as the Financial Stability Board (FSB) and the International Organization of Securities Commissions (IOSCO) help coordinate regulatory standards.
Although the structure differs across countries, the objectives of these regulators are broadly similar: investor protection, market integrity, and financial stability.
Core Principles of Trading Regulation
Most trading regulations are built on a few fundamental principles. Transparency is one of the most important. Companies must disclose accurate financial information, material events, and risks so that investors can make informed decisions. Fairness ensures that no participant has an unfair advantage due to access to non-public information or manipulative practices. Accountability holds intermediaries such as brokers, exchanges, and clearing corporations responsible for their actions. Finally, risk control mechanisms aim to prevent excessive leverage, speculative bubbles, and cascading failures.
These principles are reflected in rules related to disclosures, reporting requirements, position limits, margin norms, and surveillance systems.
Regulation of Market Participants
Trading regulations define who can participate in the markets and under what conditions. Retail investors, institutional investors, foreign investors, brokers, dealers, and market makers all fall under specific regulatory frameworks. Brokers and intermediaries must obtain licenses, meet capital adequacy norms, follow client protection rules, and adhere to strict compliance standards.
Know Your Customer (KYC) and Anti-Money Laundering (AML) regulations are critical components. They require intermediaries to verify the identity of clients and monitor transactions to prevent illegal activities such as money laundering or terrorist financing. These rules not only protect the financial system but also enhance global cooperation among regulators.
Regulation of Trading Instruments
Different financial instruments are regulated differently based on their risk profile and complexity. Equity trading focuses heavily on disclosure, corporate governance, and insider trading prevention. Derivatives trading, such as futures and options, involves additional rules on margin requirements, position limits, and settlement mechanisms due to higher leverage and risk.
Commodity markets are regulated to prevent hoarding, price manipulation, and excessive speculation that could distort real-world supply and demand. Currency and forex trading is often more tightly controlled, especially in emerging economies, to protect macroeconomic stability and manage capital flows.
Market Surveillance and Enforcement
An essential part of trading regulation is continuous market surveillance. Exchanges and regulators use advanced technology to monitor trading patterns, detect unusual price movements, and identify suspicious activities. Algorithms flag potential cases of insider trading, front-running, spoofing, and circular trading.
When violations occur, regulators have the power to investigate, impose penalties, suspend trading accounts, cancel licenses, and even initiate criminal proceedings. Strong enforcement acts as a deterrent and reinforces market discipline.
Investor Protection Measures
Investor protection is at the heart of trading regulation. Regulations mandate segregation of client funds, ensuring that brokers do not misuse investor money. Compensation funds and investor protection funds are established to safeguard investors in case of broker default.
Risk disclosure documents, suitability requirements, and product labeling are also important tools. They ensure that investors understand the risks involved before trading complex products such as derivatives or leveraged instruments. In many jurisdictions, regulators actively promote financial literacy to help investors make informed decisions.
Risk Management and Systemic Stability
Trading regulations play a vital role in controlling systemic risk—the risk that failure in one part of the financial system could trigger widespread instability. Margin requirements, daily mark-to-market settlements, circuit breakers, and position limits are designed to contain losses and prevent panic.
Circuit breakers, for example, temporarily halt trading during extreme market volatility, allowing participants time to absorb information and prevent irrational selling or buying. Clearing corporations and central counterparties reduce counterparty risk by guaranteeing settlements.
Challenges in Modern Trading Regulation
With the rise of algorithmic trading, high-frequency trading, cryptocurrencies, and global interconnected markets, regulators face new challenges. Technology has increased market speed and complexity, making surveillance more difficult. Cross-border trading requires cooperation among regulators with different legal systems and priorities.
Balancing innovation with regulation is another challenge. Over-regulation can stifle market growth and innovation, while under-regulation can lead to instability and crises. Regulators continuously adapt rules to address emerging risks without harming market efficiency.
Conclusion
Trading regulations are essential for the healthy functioning of financial markets. They provide a structured environment where participants can trade with confidence, knowing that rules are in place to ensure fairness, transparency, and stability. While regulations may sometimes seem restrictive, they ultimately serve a protective purpose—safeguarding investors, maintaining market integrity, and preventing systemic crises.
For traders and investors, understanding trading regulations is not just about compliance; it is about making smarter, safer, and more sustainable decisions. As markets evolve, trading regulations will continue to adapt, shaping the future of global finance and ensuring that growth is built on trust and discipline rather than speculation and chaos.

Part 8 Trading Master Class With Experts Risk Management in Option Trading
This is the most important part.
1. Never Trade Without a Stop Loss
Options move fast; losses can pile up quickly.
2. Avoid Trading Against Trend
Follow the direction of:
Market structure
Volume profile
Institutional activity
3. Understand Position Sizing
Never risk more than 1–2% of capital.
4. Manage Emotions
Options are volatile; emotional decisions lead to losses.
5. Avoid Blindly Selling Naked Options
Naked selling = unlimited risk.

Part 8 Trading Master Class With Experts How Options Work
The mechanics of options trading can be simplified using the relationship between the buyer and the seller (writer):
Option Buyer: Pays a premium for the right to buy (call) or sell (put) the underlying. The buyer’s risk is limited to the premium paid.
Option Seller/Writer: Receives the premium but takes on the obligation to sell (call) or buy (put) if the buyer exercises the option. The seller’s risk can be unlimited (especially for naked calls).
Example:
You buy a call option with a premium of ₹50 on a stock trading at ₹1,000 with a strike price of ₹1,050. If the stock rises to ₹1,100, your profit = ₹1,100 − ₹1,050 − ₹50 = ₹0. If the stock falls below ₹1,050, your loss = ₹50 (the premium).

Smart Choice of Mutual Funds – Build Wealth with Confidence 1. Understanding the Power of Mutual Funds
Mutual funds pool money from multiple investors to invest in diversified assets such as equities, debt, or hybrid instruments.
They offer professional fund management, making them ideal for both beginners and experienced investors.
A smart choice of mutual funds helps reduce risk while aiming for consistent long-term returns.
Investors can start with small amounts through SIPs (Systematic Investment Plans), making wealth creation accessible to everyone.
2. Why Smart Selection Matters
Not all mutual funds perform the same across market cycles.
Choosing the right fund aligns your investments with financial goals, time horizon, and risk appetite.
A smart selection avoids impulsive decisions driven by market noise or short-term performance.
Proper fund selection enhances compounding benefits over the long run.
3. Define Your Financial Goals Clearly
Identify whether your goal is wealth creation, retirement planning, child education, or short-term liquidity.
Match goals with suitable fund categories such as equity for long-term growth or debt funds for stability.
Goal-based investing brings discipline and clarity to your investment journey.
Clear goals help measure performance meaningfully, not emotionally.
4. Assess Your Risk Appetite
Risk appetite varies from conservative to aggressive investors.
Equity funds suit high-risk, long-term investors, while debt funds suit low-risk investors.
Hybrid funds balance risk and return for moderate investors.
A smart mutual fund choice respects your comfort with volatility.
5. Choose the Right Mutual Fund Category
Equity Funds: Ideal for long-term wealth creation and inflation beating returns.
Debt Funds: Suitable for capital preservation and stable income.
Hybrid Funds: Combine equity and debt for balanced growth.
Index Funds: Low-cost funds tracking market indices for passive investors.
Selecting the right category is the foundation of smart investing.
6. Analyze Fund Performance Across Market Cycles
Look beyond short-term returns; evaluate 3-year, 5-year, and 10-year performance.
Consistency matters more than one-time high returns.
Compare fund performance with benchmarks and peer funds.
Smart investors focus on risk-adjusted returns rather than absolute numbers.
7. Understand the Fund Manager’s Expertise
Fund managers play a crucial role in investment decisions.
Experience, investment philosophy, and track record matter.
A stable fund management team ensures continuity in strategy.
Smart investors trust funds with proven leadership and disciplined processes.
8. Evaluate Expense Ratio and Costs
Expense ratio directly impacts net returns over time.
Lower costs lead to higher compounding benefits in the long run.
Index funds and direct plans usually have lower expense ratios.
Smart choices balance cost efficiency with quality fund management.
9. Importance of Asset Allocation
Asset allocation spreads investments across equity, debt, and other assets.
It reduces overall portfolio risk during market volatility.
Rebalancing ensures alignment with changing market conditions and goals.
Smart mutual fund investors follow asset allocation, not market emotions.
10. SIP – The Smart Way to Invest
SIPs encourage disciplined and regular investing.
They average out market volatility through rupee cost averaging.
SIPs remove the stress of timing the market.
Smart investors use SIPs to build wealth steadily over time.
11. Tax Efficiency of Mutual Funds
Equity mutual funds enjoy favorable long-term capital gains taxation.
ELSS funds offer tax benefits under Section 80C.
Debt funds provide indexation benefits for long-term investors.
Smart fund selection also considers post-tax returns, not just gross returns.
12. Avoid Common Investor Mistakes
Chasing past performance without understanding risks.
Frequent switching of funds due to market fluctuations.
Over-diversification leading to diluted returns.
Smart investors stay patient, informed, and disciplined.
13. Review and Monitor Regularly
Periodic review ensures funds are aligned with goals.
Monitor performance, but avoid overreacting to short-term volatility.
Replace underperforming funds only with valid reasons.
Smart investing is proactive, not reactive.
14. Role of Professional Guidance
Financial advisors help match funds with personal goals.
They provide unbiased advice during volatile market phases.
Professional guidance prevents emotional investment decisions.
Smart investors value expert insights for long-term success.
15. Long-Term Vision is the Key
Mutual funds reward patience and consistency.
Compounding works best when investments are left untouched for longer periods.
Market ups and downs are temporary; discipline is permanent.
A smart choice of mutual funds transforms small savings into significant wealth.
16. Conclusion – Invest Smart, Grow Strong
Smart mutual fund investing is about clarity, discipline, and informed decisions.
The right fund, aligned with goals and risk profile, ensures financial confidence.
With proper planning, mutual funds become powerful wealth-building tools.
Make a smart choice today and secure a financially stronger tomorrow.
Smart Choice of Mutual Funds – Because Intelligent Investing Builds Lasting Wealth.

Part 1 Ride The Big Moves A. ITM (In the Money)
Call: Market price > Strike price
Put: Market price < Strike price
ITM options have intrinsic value.
B. ATM (At the Money)
Strike price ≈ Market price
These options have the highest liquidity and highest time value.
C. OTM (Out of the Money)
Call: Market price < Strike price
Put: Market price > Strike price
OTM options have no intrinsic value, only time value.
OTM options are cheaper but riskier.
