One Mobikwik Systems (W): MASSIVE REVERSAL & BREAKOUTTimeframe: Weekly | Chart Scale: Logarithmic
Explosive +25.10% weekly surge backed by a huge 181.86M volume spike! 🔥
Technical Highlights:
✅ Reversal: Formed a bullish Morning Star pattern at support!
✅ Breakout: Cleared & closed above long-term angular resistance (active since Mar '25).
✅ Volume: Surging volume confirms heavy buyer accumulation.
✅ Momentum: Daily EMA positive crossover . MACD & RSI rising. 🚀
Key Levels to Watch:
🎯 Target: 292
🛡️ Support / Pullback: 223
Tradingphsy
Before the Move-EP 06, NIFTY is Setting Up for Bullish ReversalBEFORE THE MOVE ⚡ | EP 06
Today’s analysis is an important one.
I’ve covered NIFTY, Paytm, RVNL & PB Fintech and the setups I’m watching for the next move.
NIFTY is showing a potential Morning Star formation on the daily chart, which could become important depending on how the next session develops.
But there’s more to the setup, watch the full video to understand the levels, structure and confirmation I’m looking for.
Want to learn a specific trading or technical analysis topic?
SUDEEPPHARM Bullish Engulfing with Expansion from Consolidation🔥 Sudeep Pharma: Bullish Expansion from Consolidation Zone
📊 MARKET STRUCTURE SNAPSHOT | NSE: SUDEEPPHRM | DAILY
Closing Price: 1,197.10
Core Trend: Uptrend
Market State: Bullish Structure / Consolidation Phase
Chart Pattern: No confirmed chart pattern
Candlestick Pattern: Bullish Engulfing
Price Structure: Price has maintained a strong upward structure after the earlier expansion and is currently consolidating near the 1,150–1,200 region. The latest session has pushed price back towards the up
AUROPHARMA Ascending Triangle Breakout📊 Aurobindo Pharma Ltd.: Daily Technical Snapshot – Ascending Triangle Breakout
📊 STWP Technical Analysis
________________________________________
MARKET STRUCTURE SNAPSHOT | NSE: AUROPHARMA | DAILY
Closing Price: 1,658.00 (+69.10 | +4.35%)
Core Trend: Uptrend
Market State: Ascending Triangle Breakout
Price Structure: Price has broken above the horizontal resistance zone of an Ascending Triangle, supported by a rising trendline, strong bullish candle and above-average volume. The breakout indica
BEML | Bullish Engulfing Near SupportBEML
A Bullish Engulfing Pattern has formed near a key support zone, indicating that buyers are stepping in after recent weakness.
Trade Setup
🟢 CMP: ₹1,781
🛑 Stop Loss: ₹1,747
🎯 Expected Target: ₹1,900
The setup offers a favourable Risk-to-Reward ratio, provided the stock sustains above the Bullish Engulfing candle.
Trade Plan
✅ Consider fresh long positions around the current levels.
🛡️ Strict Stop Loss at ₹1,747.
📈 As the trade progresses, Trailing Stop Loss (TSL) is recommended to p
CARTRADE | Bearish Engulfing at Resistance CARTRADE | Bearish Engulfing at Resistance | Breakdown Below ₹2,800 Could Trigger Further Weakness
A Bearish Engulfing Pattern has emerged after a strong uptrend, indicating signs of exhaustion near resistance.
Trade Setup
📉 Bias: Bearish (Below Breakdown Level)
CMP: ₹2,855
Breakdown Level: ₹2,800
Stop Loss: ₹2,913
Expected Target: ₹2,650
The ₹2,650 zone is expected to act as a strong Demand Zone, where buying interest may re-emerge.
🛡️ Trailing Stop Loss (TSL) is Mandatory to protect prof
HAL Symmetrical Triangle Breakout Watch_______________________________________
📊 Hindustan Aeronautics Ltd. (HAL): Daily Technical Snapshot – Symmetrical Triangle Breakout Watch
📊 STWP Technical Analysis
________________________________________
MARKET STRUCTURE SNAPSHOT | NSE: HAL | DAILY
Closing Price: ₹4,581.70 (+₹90.70 | +2.02%)
Core Trend: Strong Uptrend
Market State: Consolidation Within Uptrend
Price Structure: Price is consolidating inside a Symmetrical Triangle, following a strong prior advance. The recent Bullish Engulfing c
TVSMOTOR Rising Wedge Recovery Strong Q1 FY27 Earnings📊 TVS Motor Company: Daily Technical Snapshot – Rising Wedge Recovery & Strong Q1 FY27 Earnings
📊 STWP Technical Analysis
________________________________________
MARKET STRUCTURE SNAPSHOT | NSE: TVSMOTOR | DAILY
Closing Price: 3,792.00 (+201.80 | +5.62%)
Core Trend: Strong Uptrend
Market State: Recovery Within Uptrend
Price Structure: Price has rebounded strongly after forming a Bullish Engulfing near the rising support trendline and is now attempting to break above the descending resistance of
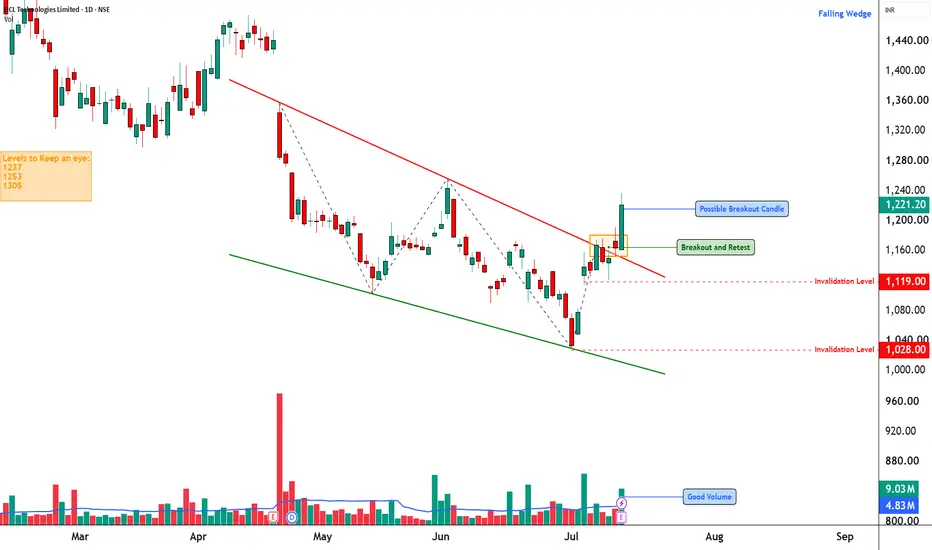
HCLTECH Falling Wedge Breakout After Strong Q1 FY27 Results📊 HCL Technologies: Daily Technical Snapshot – Falling Wedge Breakout After Strong Q1 FY27 Results
📊 STWP Technical Analysis
________________________________________
MARKET STRUCTURE SNAPSHOT | NSE: HCLTECH | DAILY
Closing Price: 1,221.20 (+57.10 | +4.91%)
Core Trend: Recovery within Long-Term Uptrend
Market State: Confirmed Falling Wedge Breakout
Price Structure: Price has broken above a multi-month Falling Wedge, supported by a strong bullish breakout candle and significantly higher trading vo
Trading Road Mapoptions trading and institutional trading are important parts of modern financial markets. Options trading offers flexibility and opportunities for profit, while institutional trading provides liquidity and stability to the market. However, beginners should learn market concepts carefully before entering options trading because losses can occur quickly without proper knowledge and risk management. Education, practice, and disciplined investing are essential for long-term success in trading.
Advanced Intraday TradingOptions Trading is a type of financial trading where investors buy or sell contracts that give them the right, but not the obligation, to purchase or sell an asset at a fixed price before a specific date. Traders use options to earn profits, hedge risks, or speculate on market movements. Common strategies include call options, put options, straddles, and spreads. Options trading can provide high returns, but it also carries significant risk because prices can change rapidly due to market volatil
Doji Formation (Indecision Candles) is the New TrendFor the past four weeks (3rd week of June to 2nd week of July), Nifty 50 NSE:NIFTY has shown extreme range-bound volatility. The volatility imprinted each week has built a culture of forming "Doji (s)" or indecision candles. In one instance, there is also evidence of a green spinning top. Even the green spinning top is considered an indecision candle. Thus, for the past four weeks, traders have been through a roller-coaster ride.
The article aims to understand the present culture of how th
Option AnalysisOptions Data
PCR at 0.90, slightly bearish reading
Max call pain sitting near 55,000, acting as a ceiling
What to Do
Short traders hold with stop-loss above 54,609 on daily close
Long trades only if index closes above 54,609
Avoid aggressive buying unless 56,400 is reclaimed with a proper closing
Key Risk
Crude oil above 100 dollars is a pressure point for India
Any global news on geopolitics can cause sudden sharp moves either way
Dell**DELL Technologies — Technical View: Bearish Bias Building**
It appears to be transitioning from a strong impulsive uptrend into a distribution phase following its recent all-time high.
*CMP: $434.97*
Dell registered an all-time high of $469.47 on 1st June, followed by a **bearish tweezer top** formation on 2nd June, with the second candle closing at $469.19 — a classic reversal signal at elevated levels. Since this formation, the stock has struggled to sustain those highs, reinforcing the c
MCX Falling Wedge Recovery Setup📊 MCX: Daily Technical Snapshot – Falling Wedge Recovery Setup
📊 STWP Technical Analysis
________________________________________
MARKET STRUCTURE SNAPSHOT | NSE: MCX | DAILY
Closing Price: 2,742.00 (+98.80 | +3.74%)
Core Trend: Downtrend (Swing Structure)
Market State: Recovery Attempt Within Falling Wedge
Price Structure: Price is trading inside a Falling Wedge, a bullish reversal pattern, after forming a Bullish Engulfing near the lower boundary. Buyers have defended support, and the stock is
Road Mapoptions trading and institutional trading are important parts of modern financial markets. Options trading offers flexibility and opportunities for profit, while institutional trading provides liquidity and stability to the market. However, beginners should learn market concepts carefully before entering options trading because losses can occur quickly without proper knowledge and risk management. Education, practice, and disciplined investing are essential for long-term success in trading.
Institution Option Trading Part-3PCR means Put-Call Ratio
It compares how many Put options are traded versus Call options.
Simple formula: Put Volume ÷ Call Volume.
This helps understand market mood.
Institutions use options heavily
Big players like banks, hedge funds, mutual funds often use options for hedging and positioning.
So PCR can give clues about what smart money may be doing.
Shows fear vs confidence
High PCR = More puts than calls = Fear, protection, bearish mood.
Low PCR = More calls than puts = Confidence, bullish
Advanced Options TradingIn options trading, institutional traders usually have advantages over retail traders because they have access to better technology, market data, and experienced analysts. Institutions often use options to hedge portfolios, manage market exposure, and improve investment returns. For example, a fund manager may buy put options to protect investments during uncertain market conditions. Their trading strategies are usually more disciplined and data-driven compared to individual investors.
Option TradingNIFTY 50 Option Trading
Why Traders Prefer NIFTY Options
High liquidity
Tight bid-ask spread
Smooth price movement
Suitable for scalping and intraday trading
Best Strategy for NIFTY
Trend Following Strategy
Buy CE when:
Price above VWAP
Put writing increases
Resistance breakout confirmed
Trading Masterclass #1Institutional trading means trading like hedge funds, banks, prop firms, and professional desks. They do not trade based on emotions, random tips, or gambling. They use systems, probabilities, risk control, position sizing, discipline, and psychology.
Retail traders often lose because they focus only on “entry.” Institutions focus on:
Risk Management
Capital Protection
Position Sizing
Probability
Psychology
Consistency
Repeatable Edge
Institution Option TradingPCR means Put Call Ratio
It tells us how many Put options and Call options people are buying or trading.
Why it matters for institution trading
Big players mostly use options. So PCR helps us understand what big money may be thinking.
If PCR is high
More puts than calls.
Means traders are scared or taking protection.
Sometimes big players expect weakness.
If PCR is low
More calls than puts.
Means confidence in upside.
Sometimes market is bullish.
Why learn this
Price only shows movement.
PCR sho