Psychology, Why 90% of Traders Fail (And How to Be the 10%)⚡ The ugly truth: Most traders don’t fail because of strategy. They fail because of *themselves* . It’s NOT bad strategies, it’s bad psychology.
📉 Here’s the real story 👇:
We know about stop-losses.
We know about risk-to-reward.
We know patience matters.
Imagine this: You’ve planned your trade. Price goes against you. Suddenly, your brain whispers:
👉 “Just hold a little longer.”
👉 “Double your position, you’ll recover.”
👉 “Skip the stop-loss this time, it’ll bounce back, praying it turns back.”
NSE:COFORGE
Sound familiar?
That inner voice has blown more accounts than any chart pattern ever did.
🧠 “It’s not because their strategies don’t work—it’s because *they don’t work on themselves*.
✅ The 10% who wins don’t have superhuman IQs . They *train their minds* the way athletes train their bodies.
Here’s how you can upgrade yourself today :
1️⃣ **Detach From Money** → Don’t measure success by today’s P&L.
Measure it by *following your plan*. Consistency is the real wealth.
2️⃣ **Write Your Rulebook 📘** → Define your entries, exits, and risk rules. Print it. Stick it near your screen.
No match = no trade. (Yes, it’s boring. That’s why it works.)
3️⃣ **Journal Your Trades** → Every. Single. Trade. Wins and losses. How did you feel?
Why do you enter?
after doing this, you’ll start to * see your patterns * —and they’ll expose your weaknesses too..
🎯 Success in trading isn’t about predicting/beating the market. It’s about controlling *yourself*, beating your own impulses.
💬 Question for you: Which habit is killing your trades?
NSE:MARUTI
If you could fix just ONE habit right now:— what would it be?
Which one would change your results the most?
1️⃣ Overtrading 🔂
2️⃣ Revenge Trading ⚔
3️⃣ Ignoring Risk ⚠
4️⃣ chasing losses 🏃➡️
5️⃣ No 📘rulebook/📰Journal
💬 Comment below ⬇️
I'll post my new content accordingly.
Happy Trading and Investing!
Regards:
@TradeWithKeshhav
Tradingplans
Psychology, Why 90% of Traders Fail (And How to Be the 10%)⚡ The ugly truth: Most traders don’t fail because of strategy. They fail because of *themselves* . It’s NOT bad strategies, it’s bad psychology.
📉 Here’s the real story 👇:
We know about stop-losses.
We know about risk-to-reward.
We know patience matters.
Imagine this: You’ve planned your trade. Price goes against you. Suddenly, your brain whispers:
👉 “Just hold a little longer.”
👉 “Double your position, you’ll recover.”
👉 “Skip the stop-loss this time, it’ll bounce back, praying it turns back.”
NASDAQ:GOOGL
Sound familiar?
That inner voice has blown more accounts than any chart pattern ever did.
🧠 “It’s not because their strategies don’t work—it’s because *they don’t work on themselves*.
✅ The 10% who wins don’t have superhuman IQs . They *train their minds* the way athletes train their bodies.
Here’s how you can upgrade yourself today :
1️⃣ **Detach From Money** → Don’t measure success by today’s P&L.
Measure it by *following your plan*. Consistency is the real wealth.
2️⃣ **Write Your Rulebook 📘** → Define your entries, exits, and risk rules. Print it. Stick it near your screen.
No match = no trade. (Yes, it’s boring. That’s why it works.)
3️⃣ **Journal Your Trades** → Every. Single. Trade. Wins and losses. How did you feel?
Why do you enter?
after doing this, you’ll start to * see your patterns * —and they’ll expose your weaknesses too..
🎯 Success in trading isn’t about predicting/beating the market. It’s about controlling *yourself*, beating your own impulses.
💬 Question for you: Which habit is killing your trades?
NASDAQ:MSFT
If you could fix just ONE habit right now:— what would it be?
Which one would change your results the most?
1️⃣ Overtrading 🔂
2️⃣ Revenge Trading ⚔
3️⃣ Ignoring Risk ⚠
4️⃣ chasing losses 🏃➡️
5️⃣ No 📘rulebook/📰Journal
💬 Comment below ⬇️
I'll post my new content accordingly.
Happy Trading and Investing!
Regards:
@TradeWithKeshhav
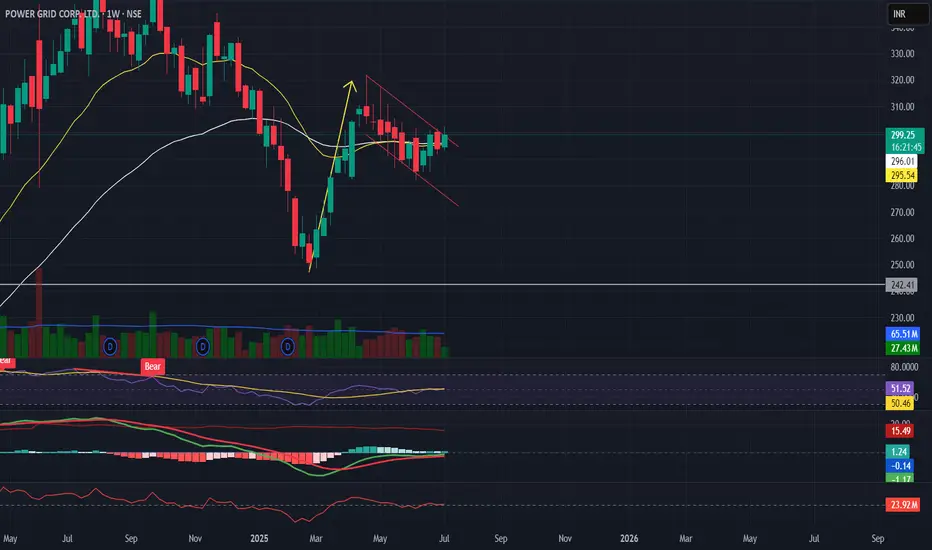
Power Grid Flag Pattern Breakout SetupPower Grid – Breakout Plan
Watching for a clean move above ₹300 level.
Hourly chart shows Cup & Handle formation, while Daily/Weekly has Flag pattern attempting breakout.
✅ Breakout level: ₹300 (confirmation close needed)
✅ Stop-loss: ₹290–294 (below support / ATR-based)
✅ Target 1: ₹328 (Fibonacci 0.618 – Golden Ratio)
✅ Target 2: ₹375 (Measured Move)
Indicators:
EMAs rising on hourly, steady on daily.
RSI strong but nearing overbought on lower timeframe.
MACD positive momentum.
Watching volume for confirmation.
Macro Drivers:
Government infra spending.
Cooling inflation.
Rising electricity demand in India.
✅ Plan: Wait for confirmed breakout with volume. Strict risk management with pre-defined stop.
ACC trading strategyBuying opportunity above 1936 (close and confirmed)
Targets 2068 and 2185
Rising RSI is supporting the bullish trend.
Buying logic: Breakout of recent high as a reversal signal of trend change.
Invalidation: Price not closing above the buying line with good volume or rejecting the buying level and closing below recent high, confirming rangebound movement.

CANFINHOME - Higher Highs & Higher LowsCANFINHOME is making HH-HL formation.
Now giving breakout of resistance, moving above 20ema, RSI is also looking strong.
There is probability of an upside move, looks good above 759.
✅ If you like my analysis, please follow me as a token of appreciation :)
in.tradingview.com/u/SatpalS/
📌 For learning and educational purposes only, not a recommendation. Please consult your financial advisor before investing.

Bitcoin Price Analysis 21-22 June 2025COINBASE:BTCUSD is in downtrend.
STRATEGY:
1. If the price breaks above the upper level, consider a long position. This is supported by the higher lows formation in a smaller timeframe, suggesting a continuation of the upward trend.
2. Bearish Scenario: If the price breaks below the lower level, consider a short position, targeting potential stop-loss orders or liquidity pools created during the higher lows formation.
AREA TO AVOID
Area between the upper and lower levels due to price consolidation.

Prestige Estate: Trading strategy For both buy/sell:
Buying strategy on breakout of the resistance trendline:
Target is T1 and T2, i.e., 1900 and 2075, respectively.
On rejection of this trendline, prices will fall to 1561.50 and 1442 as T1 and T2 as part of a selling strategy.

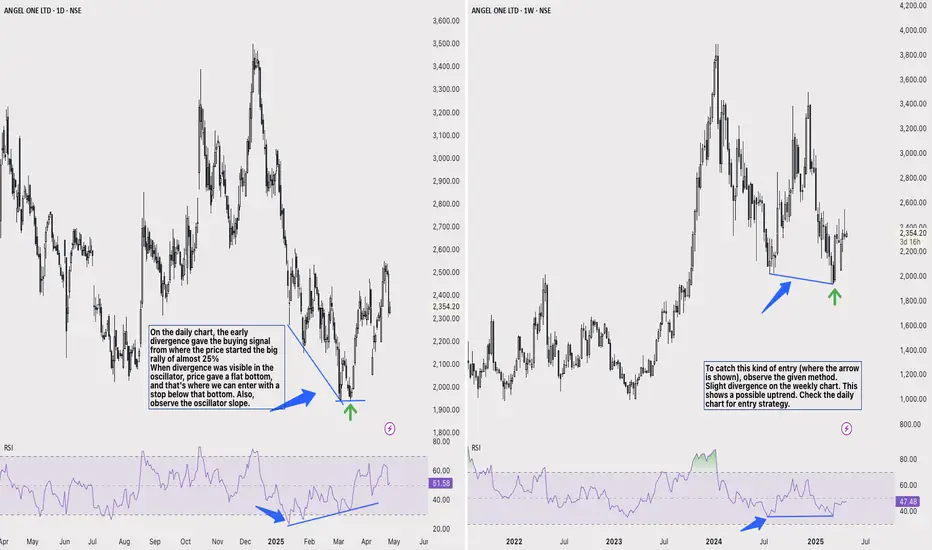
Analysis to catch a divergence rallyObserve the given method to catch this kind of entry (where the arrow is shown).
Slight divergence on the weekly chart. This shows a possible uptrend. Check the daily chart for entry strategy.
On the daily chart, the early divergence gave the buying signal from where the price started the big rally of almost 25%
When divergence was visible in the oscillator, price gave a flat bottom, and that's where we can enter with a stop below that bottom. Also, observe the oscillator slope,it is making higher high and price making lower low and before the rally it gave flat price action.
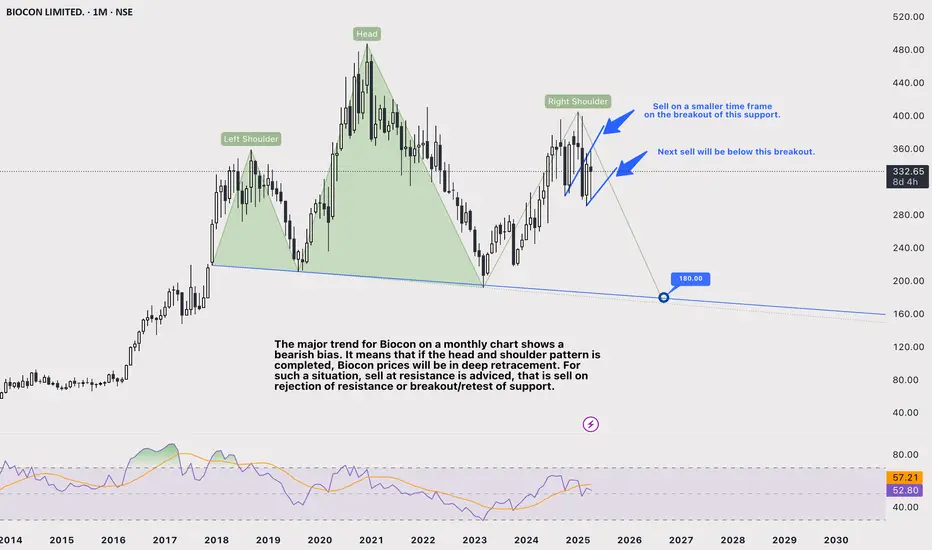
Biocon monthly analysis: Bearish on breakoutThe major trend for Biocon on a monthly chart shows a bearish bias. It means that if the head and shoulder pattern is completed, Biocon prices will be in deep retracement. For such a situation, sell at resistance is advised, that is, sell on rejection of resistance or breakout/retest of support.
Step down on lower time-frame for immediate trendline supports for entry strategies.
GOLD HOLDS ABOVE $3,000 – BIG MOVE AHEAD?📌 Market Overview
Gold remains stable above the $3,000 mark as traders await the March 19 FOMC meeting. The Federal Reserve is expected to keep interest rates unchanged, but speculation about a rate cut in June 2025 continues. Amid global economic uncertainty, gold maintains its position as a safe-haven asset, benefiting from a low-interest-rate environment.
🔹 Key Fundamental Factors
1️⃣ Fed’s Economic Projections
The upcoming forecasts will provide insights into how policymakers assess Trump’s fiscal policies.
A dovish Fed stance could push gold to new highs.
2️⃣ Safe-Haven Demand for Gold
Low interest rates increase gold’s attractiveness as a non-yielding asset.
Geopolitical tensions continue to support gold’s long-term bullish outlook.
3️⃣ Interest Rate & Inflation Impact
Traders anticipate a rate cut by June, fueling gold’s rally.
However, if inflation remains strong, the Fed may delay cuts, causing short-term pullbacks in gold.
📊 Technical Analysis – Key Levels to Watch
🔺 Resistance (Upside Targets)
$3,034 - $3,050: If gold holds above $3,000, a test of this zone is likely.
Breakout Alert: A move past $3,050 could trigger stronger bullish momentum.
🔻 Support (Pullback Zones)
$3,000: A critical psychological level.
$2,985 - $2,975: A potential dip zone where buyers might step in.
$2,945 - $2,950: Strong long-term support—breaking below could indicate a shift in trend.
🎯 Trading Plan
🟢 BUY ZONE: 2986 - 2984
📍 SL: 2980
🎯 TP: 2990 - 2994 - 3000 - 3005 - 3010
🔴 SELL ZONE: 3033 - 3035
📍 SL: 3039
🎯 TP: 3028 - 3024 - 3020 - 3015 - 3010
⚠ Market Caution!
Gold is consolidating above $3,000, but volatility is expected ahead of the Fed meeting.
Watch for potential breakouts or pullbacks—stick to risk management strategies!
📢 Will gold maintain momentum above $3,000, or is a correction coming? Share your thoughts below! 🚀🔥

GOLD HITS NEW ATH – IS $3,000 JUST THE BEGINNING?📌 Market Overview
Gold has soared to a new all-time high (ATH) following the latest inflation reports (CPI & PPI), confirming the market’s strong bullish sentiment. As expected, weak US economic data caused DXY to plunge to its lowest levels, further fueling gold’s upward momentum. Everything is aligning in favor of gold’s rally – up, up, up! 🚀
👉 Why is gold skyrocketing?
Investors are rushing to buy gold at record-high prices due to economic and political instability.
Former President Donald Trump’s policies are shaking market confidence, making gold the go-to safe-haven asset.
Until USD shows signs of a strong recovery, gold will remain the priority investment.
📊 Will Gold Break Beyond $3,000?
🔹 Short-term bullish outlook:
Asian & European sessions are expected to favor buying, as investors continue to pile into gold.
In the US session, profit-taking may trigger sharp pullbacks, especially as early buyers cash out at higher levels.
Being a Friday, the market could see large liquidations and volatility spikes.
📉 Key Technical Levels to Watch
🔺 Major Resistance: $3,000 - $3,019 - $3,039 - $3,052
🔻 Major Support: $2,978 - $2,967 - $2,942 - $2,918
🎯 Trading Plan for Today
🔴 SELL ZONE: $3,039 - $3,041
📍 SL: $3,045
🎯 TP: $3,035 - $3,030 - $3,025 - $3,020 - $3,015 - $3,010 - ???
🟢 BUY SCALP: $2,968 - $2,966
📍 SL: $2,962
🎯 TP: $2,972 - $2,976 - $2,980 - $2,985 - $2,990 - $3,000
🟢 BUY ZONE: $2,948 - $2,946
📍 SL: $2,942
🎯 TP: $2,952 - $2,956 - $2,960 - $2,965 - $2,970 - $2,980 - $3,000 - ???
⚡️ Final Thoughts – Caution Ahead!
📌 Despite the strong uptrend, today is Friday, and profit-taking could trigger sudden drops.
📌 Stick to TP/SL strategies to protect capital and avoid getting caught in sharp pullbacks.
📌 Watch for potential liquidations in the US session – big moves are possible!
💬 Do you think gold will push beyond $3,000, or are we in for a sharp correction? Drop your thoughts below! 🚀🔥

XAU#15:Gold Price Hits Record High–How to Profit From This Trend💎 💎 💎 So gold has hit 2900 and beyond. Prices continue to rise. Let's plan the next trade OANDA:XAUUSD : 💎 💎 💎
1️⃣ **Fundamental analysis:**
——————————————————————————————————————————
⚫US President Donald Trump's new tariff plan has raised concerns about a trade war, causing investors to flock to safe-haven assets. Gold prices rose to a record $2,900/ounce, while silver prices also surpassed $32/ounce.
⚫Trump announced a 25% tariff on imported steel and aluminum, and announced reciprocal tariffs on all countries.
⚫This has increased trade tensions and pushed gold prices higher. Analysts say gold still has room to rise amid economic uncertainty and Trump's unpredictable trade policies.
⚫Global gold demand, especially from China, has also supported gold prices. China increased its gold reserves for the third consecutive month and allowed insurance companies to invest in gold, which could free up billions of dollars in funds.
⚫ However, a sharp rise in FOREXCOM:XAUUSD prices could make it more expensive for investors
⚫While gold is a safe haven, high interest rates could reduce its appeal. The Federal Reserve remains cautious on monetary policy due to high inflation and the uncertain impact of Trump's tax policies on the economy.
2️⃣ **Technical analysis:**
🔹 **D Frame**: Yesterday closed with a large candle. This appeared at the historical peak, so it is easy to understand why today's opening session we witnessed such strong fluctuations in gold
🔹 **H4 Frame**: The price structure has not changed. The uptrend is still continuing. Although the price is considered too high, the price line still reflects the absolute dominance of the bulls
🔹 **H1 Frame**: The price line has reached the top of the expanded price channel and has reacted. There is a high possibility that there will be a correction to a lower price zone
3️⃣ **Trading plan:**
⛔ The conflict in basic information data over the weekend is clearly reflected in the price line. At the moment, we should wait for price reactions at important support areas to establish positions.
✅ Looking at the price line, the old peak area has been rejected and there is a high possibility that we will have a slight correction to gain momentum to move to a higher price zone. The end of the W candle shows that the uptrend of Gold has not shown any signs of ending. Prioritize trading in line with the main trend.
💪🚀 **Wishing you successful trading!**

BTC#2 : Summary of things to watch out for in the current uptren🔥 The previous plan helped you make a profit. Leave a comment and share the joy. 🔥
Today I will continue to bring everyone a perspective on BTC and the next trading plan.
1️⃣ **Fundamental analysis:**
📊 🔴US CPI rose slightly more than expected in December as energy costs rose, suggesting inflation is still rising
▫️ In addition, a recovery in Bitcoin was supported by the release of December PPI on Tuesday, which showed weaker-than-expected inflation data.
2️⃣ **Technical analysis:**
🔹 **D Frame**: Yesterday's candle close shows strong market confidence in BTC rising. However, the price has reacted when touching the trendline. This is the area we need to pay attention to
🔹 **H4 frame**: The bearish price structure was broken when the price crossed 968xx and went straight to the trendline, which caused the bullish momentum to slow down somewhat. It is likely that we will need a slight correction to gain momentum to break the resistance area above
🔹 **H1 frame**: Looking at the price structure, you can see more clearly. The bullish wave has not shown any signs of ending, but the important resistance area requires us to be more patient if we want to find profits.
3️⃣ **Trading plan:**
✅ If you want to have a BUY position at the moment, my advice is that we can patiently wait for the price to test the support area of 958xx as I marked on the chart. Don't be hasty, when the R:R ratio of the important resistance area is always low. The bullish price structure also needs confirmation by a higher bottom than the previous bottom. FOMO at this time is not a wise choice
⛔ The resistance zone will always make you want to stop the ship. However, wait for the bearish price structure in the small time frame M5. M15 to make sure your judgment is correct. If you have a good position, you should not expect high profits when the bearish price structure is temporarily broken, closing part of the profit when the price touches support and leaving SL positive will be a wise choice.
💪 **Wish you successful trading!** 🚀

SP500#1: HOW DOES NONFARM AFFECT SP500?🔎 1/ Fundamental Analysis
🟥 Political tensions:
• The US increases pressure on Russia through energy sanctions. This could lead to trade retaliation, negatively affecting the economy.
🟥 Interest rate policy:
• Interest rates are likely to remain unchanged until June, limiting the amount of money injected into the market – causing concern.
🟥 CPI data next week:
• Inflation is the biggest determinant of interest rate policy. Forecasts show that inflation is likely to increase again, continuing to put pressure on the market.
💡 Basic conclusion:
The market faces a less optimistic sentiment due to increasing economic and political risks.
📊 2/ Technical Analysis
🔵 W (Weekly) Frame:
• This week closed with a long-tailed, long-bodied candle – a strong bearish sign.
🔵 D (Daily) Frame:
• The bearish structure was confirmed after Friday's trading session.
🔵 H1 (Hourly) Frame:
• The bearish price structure is clear: consecutive lower highs, the support trendline is broken.
💡 Summary:
All three timeframes are supporting the downtrend.
📈 3/ Trading Plan
🟢 Correction strategy:
• Support zone: 5676~5750.
👉 Wait for price reaction at this zone to find an opportunity to enter the order.
⚠️ Note: The weekly candle closes badly, profit expectations should not be too high. Do not rush to catch the bottom!
🔴 Trade in the direction of the trend:
Resistance zone: 5890~5915.
👉 Plan: Wait for the price to react at the resistance zone to enter a sell order in the direction of the trend.
🎯 Profit target: 5680 - strong support zone.
❓ Which side are you on - BULL or BEAR?
💬 Leave a comment to discuss and exchange!

GOLD STORY #1: XAUUSD SIDEWAY – SHOULD I BUY OR SELL NOW?🔎 1/ Fundamental Analysis
🔴 Global economy and market sentiment:
• Non-farm payrolls (NFP) data: Positive results, showing that the US economy is growing steadily.
• Inflation – the deciding factor: The Fed is still waiting for CPI data next week, which will be the most important factor for interest rate policy.
• Uncertainty from Russia-US tensions: Trade and political sanctions continue to increase, creating greater risks for the global market.
💡 Summary:
Although the USD received support signals from NFP, gold prices still maintained their upward momentum due to risk-off sentiment.
📊 2/ Technical Analysis
🔵 W (Weekly) Frame:
• After 5 weeks of sideways, gold price bounced back strongly, continuing the main trend.
• The weekly candle closed with a strong body, showing that the bulls are in control.
🔵 D (Daily) Frame:
• The key level 2600 has been broken, but the resistance zone 2725~2750 has not given a positive signal.
• The price touches the resistance but continuously creates higher lows – the market is still leaning towards the bulls.
🔵 H1 Frame:
• The uptrend is clear, but the price is near the resistance zone.
• The Risk-Reward (R:R) ratio is no longer attractive to trade in the uptrend.
📈 3/ Trading Plan
🟢 BUY – Follow the trend:
• If you have a buy order at a low price, congratulations! 🎉
👉 You can:
• Hold the order: If you expect the price to continue to break the resistance.
• Close a part: When the price touches the resistance zone of 2725~2750 to preserve profits.
• Note: If you do not have a position, you should not FOMO into this price zone because the R:R ratio is no longer ideal.
🔴 SELL – Counter-trend:
• Although the uptrend does not support selling, you can consider:
• Wait for the price reaction at the resistance zone of 2725~2750. OANDA:XAUUSD
• Expected profit should be low because this is a counter-trend trade.
🐂 Which side are you on – BULL or BEAR? 🐻
💬 Leave a comment and discuss with the community! OANDA:XAUUSD

Option and Database trading To study an option chain, focus on the current market price, displayed in the centre. Analyse the built-up data to understand market direction based on recent changes in open interest and price. ITM call options are typically highlighted in yellow, making it easier to distinguish them from other options.
The put-call ratio measures trading volume using put options versus call options. Instead of the absolute value of the put-call ratio, the changes in its value indicate a change in overall market sentiment.

Neat & Clean Rectangle Pattern Breakout seen in Top Cement StockHello Everyone, i hope you all will be doing good in your life and your trading as well. Today i have brought another stock which has given Near and Clean Rectangle pattern breakout. Stock name is UltraTech Cement and it is engaged in the manufacturing and sale of Cement and Cement related product primarily across globe.
Okay guy's let's learn something very important about this pattern:
Q:- What is Rectangle Pattern and How to Use Rectangle Chart Patterns to Trade Breakouts?
Rahul:-
A rectangle is a chart pattern formed when the price is bounded by parallel support and resistance levels.
A rectangle exhibits a period of consolidation or indecision between buyers and sellers as they take turns throwing punches but neither has dominated.
The price will “test” the support and resistance levels several times before eventually breaking out.
From there, the price could trend in the direction of the breakout, whether it is to the upside or downside.
we can clearly see Above in Ultratech chart that the pair was bounded by two key price levels which are parallel to one another.
So, Traders, i hope you Guy's have learned today how to Trade Rectangle Pattern, but Mates We just have to wait until one of these levels breaks and go along for the ride!
Remember , when you spot a rectangle: THINK OUTSIDE THE BOX! That's it.
Market Leadership
The company is the 3rd largest cement company in the world, excluding China. It is also the largest cement manufacturer in India with a 22% share of the grey cement capacity.
Let's discuss some fundamentals
- D/E is 0.17
- Interest Coverage ratio 10.73 is higher than last year's Interest Coverage Ratio 10.01
- D/E 0.17 has reduced as compared to last year's D/E 0.18
- ROCE is 15.42%
- ROCE 15.42% has increased as compared to last year's ROCE 13.2%
- ROE is 12.25%
- ROE 15.42% has increased as compared to last year's ROE 13.2%
- ROCE 15.42% is higher than 5 years ROCE average 14.02%
- Operating Profit Margin (EBITDA Margin) is 18.29%
- Operating Profit Margin (EBITDA Margin) 18.29% has improved as compared to last year's OPM 16.79%
- NPM is 9.88%
- Net Profit Margin (PAT Margin) 9.88% has improved as compared to last year's NPM 8.01%
- Company has a negative Cash Conversion Days of -188.47
- Annual Sales has grown by 12.13%
- Annual Profit has grown over by 38.33%
- 3 Years Sales CAGR is 18.67%
- Retail/Public have reduced their stakes by 0.32% in the latest quarter (14.4% to 14.08%)
- Promoters + FIIs + DIIs hold 92.01% in the company
Disclaimer:- Please always do your own analysis or consult with your financial advisor before taking any kind of trades.
Dear traders, If you like my work then do not forget to hit like and follow me, and guy's let me know what do you think about this idea in comment box, i would be love to reply all of you guy's.

2 Good swing trading ideas for 26 July marketsI make educational content videos for swing / positional trading

2 Amazing Swing trading ideas for 11 June I daily make educational content videos for swing / positional trading

31 May 2024 - BankNifty stance is neutral, slightly bullish toneBankNifty was unable to break the 48947 resistance today, except for the 10.18 candle, rest 5 candles touched the 48947 resistance level. In 3 instances we went above, but could not sustain. If any of the candles closed above this level, I would have changed the stance to bullish. As of now maintaining the neutral stance with a slightly bullish tone.
All eyes are on the election exit polls today and then the actual results on June 4th. Banks and financial sectors will be the first to react to any news, rumors, or press releases. Unlike other developed markets, finances are the most important sector in our listed space.
Copy pasting my expectations for markets next week, post election results
1. 400+ seats - up 5%+
2. 270 to 399 seats - down 5 to 10%
3. less than 270 seats - down 25%

UPL BuyingAfter completion of ABCD, harmonic pattern.
Buying strategy will be on breakout and retest of the entry price mentioned in the chart. (562.50)

breakout trading !In technical analysis, a breakout refers to a substantial price movement of a financial instrument, such as a stock or commodity, surpassing a specific level of support or resistance. This occurrence is of paramount importance, as it frequently signifies the initiation of a new trend, offering traders and investors valuable insights for informed decision-making.
Outlined below are key aspects related to breakouts in technical analysis:
Definition: A breakout occurs when the price of an asset surpasses a well-defined level of support or resistance. The breakout can manifest as either an upward movement (bullish breakout) or a downward movement (bearish breakout).
Significance: Breakouts carry significance as they indicate a shift in market sentiment, suggesting that the prevailing trend may be weakening or reversing, potentially giving rise to a new trend.
Types of Breakouts:
Bullish Breakout: This occurs when the price surpasses a resistance level, signaling potential upward momentum.
Bearish Breakout: In contrast, a bearish breakout happens when the price drops below a support level, indicating potential downward momentum.
Volume Confirmation: Successful breakouts are often accompanied by an uptick in trading volume, serving as confirmation of the robustness of the new trend. Volume analysis is instrumental in validating the legitimacy of the breakout.
False Breakouts: It is important to note that not all breakouts lead to sustained trends. False breakouts can occur, wherein the price briefly breaches a support or resistance level but subsequently reverses. Traders commonly employ additional technical indicators or await confirmation before acting on a breakout.
Measuring Target: Traders frequently use the height of the pattern preceding the breakout, such as a triangle or rectangle, to estimate the potential price target. This aids in setting profit targets.
Common Chart Patterns Leading to Breakouts:
Triangles: Symmetrical, ascending, or descending triangles often precede breakouts.
Head and Shoulders: Both inverse and regular head and shoulders patterns can signal potential breakouts.
Rectangles and Flags: Consolidation patterns like rectangles and flags can lead to breakouts.
Role of Trendlines: Trendlines are commonly employed to identify potential breakout points. The intersection of a trendline with a support or resistance level is deemed a critical zone for a potential breakout.
Risk Management: Traders typically incorporate risk management strategies, such as setting stop-loss orders, to safeguard against false breakouts or adverse market movements.
In summary, breakouts in technical analysis are pivotal events offering valuable information to traders and investors about potential shifts in market trends. Effective breakout trading strategies involve confirmation, volume analysis, and meticulous consideration of various chart patterns.

LICI- All time high breakoutInsurance sector in action with leading company giving all time high breakout. LIC of India is giving all time high breakout on daily chart. The volume in last 1-2 months are quite high and stock has till now given a returns of almost 30% in year 2023. This seems just the beginning of rally in this stock.
The next possible levels on the chart is 1083 according to Fibonacci.
Disclaimer: The stock shared is only for educational purpose and does not include any buy or sell recommendations.
