Expiry Day Trading - Most tempting day to trade or gamble...Expiry day has its own characteristics. It gives so many emotions in the mind. Hope is the main emotion when traders think about it. If I can predict the movement right, I can make more than my month's salary on an expiry day of trading is the average/ordinary or even sharp-minded trader will think.
The market is neutral. It gives opportunities for both option buyers and sellers. Some expiries are for option buyers, some for option sellers. Some days will be trending, some will be bidirectional.
Understanding the type of market you are dealing on an expiry day can give you a trading edge.
Today's market gave zig zag movement. In this type of market, profit booking at the right time is important.
Dreams about making a big profit can give you hope and greed, but booking profit once you have a decent amount in a trade can save your capital.
Dreams or capital protection? Which can help you in the long run? A question only you can answer as a trader.
Trading Psychology

How Liquidity Zones in Forex Mirror in Bitcoin Markets?Hello Traders!
If you’ve studied liquidity concepts in Forex trading , you might’ve noticed how similar they behave in the crypto market , especially in Bitcoin.
Both markets are driven by liquidity and order flow, not random price movements.
Let’s understand how these two worlds mirror each other and how you can use that knowledge to trade smarter.
1. What Are Liquidity Zones?
Liquidity zones are price areas where a large number of orders are placed, stop losses, buy/sell limits, or pending entries.
Institutions and big players target these zones to execute their large positions with minimal slippage.
That’s why price often “hunts” highs or lows before the real move starts.
2. Liquidity Behavior in Forex
In pairs like EUR/USD or GBP/USD, liquidity often builds near session highs and lows.
Smart money pushes price to these zones to trigger retail stops and grab liquidity.
Once liquidity is collected, the market usually reverses in the opposite direction.
3. The Same Psychology in Bitcoin
Bitcoin may not be a currency pair, but it runs on the same emotional patterns, fear, greed, and impatience.
Liquidity clusters near obvious highs/lows, round numbers (like $60,000 or $50,000), and breakout points.
Big players hunt these zones in the same way as in Forex, because crypto markets are even more sentiment-driven.
4. How to Identify These Zones on BTC Charts
Mark previous day’s highs and lows, these are classic liquidity targets.
Check where price made impulsive moves in the past; those areas often have resting orders.
Look for quick “fakeouts” beyond these levels followed by strong rejection, a sign liquidity was grabbed.
5. How to Trade the Mirroring Pattern
Wait for liquidity grab candles (spikes above/below key levels).
Enter on confirmation of reversal (engulfing or pin bar).
Place stops beyond the liquidity wick and target the next range midpoint.
Rahul’s Tip:
Whether it’s Forex or Bitcoin, the chart structure changes, but human behavior doesn’t .
If you understand how liquidity works in one market, you can easily read the traps in another.
Conclusion:
Liquidity is the universal language of smart money.
The same tricks used in Forex, fakeouts, stop hunts, and reversals, repeat daily in Bitcoin charts.
Once you learn to spot them, you’ll see that both markets are mirrors of each other in how they trap and move traders.
If this post helped you see the connection between Forex and Bitcoin, like it, drop your view in comments, and follow for more deep market insights!
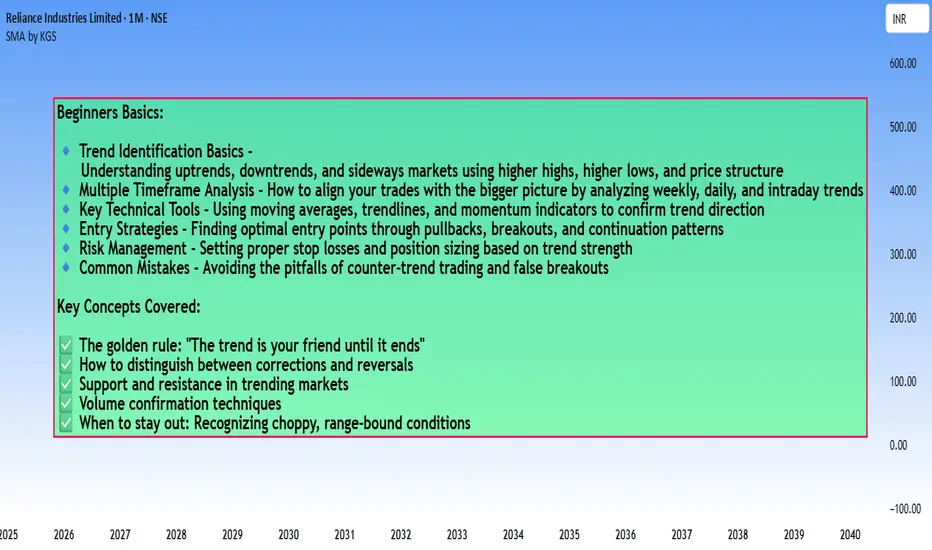
How to trade in the Right Trend - Beginners guide
How to Identify a Trend in a Chart?
Here's a practical breakdown of trend identification methods:
1. Price Structure Method (Most Fundamental)
Uptrend:
- Series of Higher Highs (HH) and Higher Lows (HL)
- Each peak is higher than the previous peak
- Each trough is higher than the previous trough
Downtrend:
- Series of Lower Highs (LH) and Lower Lows (LL)
- Each peak is lower than the previous peak
- Each trough is lower than the previous trough
Sideways/Range:
- Price oscillates between horizontal support and resistance
- No clear higher highs/lows or lower highs/lows
2. Moving Averages
Simple Rules:
- Price consistently above MA = Uptrend
- Price consistently below MA = Downtrend
- Price crossing back and forth = No clear trend
Popular MAs:
- 20 EMA (short-term)
- 50 SMA (medium-term)
- 200 SMA (long-term)
Golden Cross/Death Cross:
- 50 MA crosses above 200 MA = Bullish trend signal
- 50 MA crosses below 200 MA = Bearish trend signal
3. Trendline Method
Drawing Trendlines:
- Uptrend: Connect at least 2 higher lows with a straight line
- Downtrend: Connect at least 2 lower highs with a straight line
- The more touches, the stronger the trendline
- Price respecting the trendline confirms trend strength
4. Multi-Timeframe Analysis
The Complete Picture:
- Weekly chart: Overall market direction
- Daily chart: Intermediate trend
- 4H/1H chart: Entry timing
Rule: Always trade in the direction of the higher timeframe trend
#5. Indicators for Confirmation
ADX (Average Directional Index):
- Above 25 = Strong trend
- Below 20 = Weak/no trend
- Doesn't show direction, only strength
MACD:
- Histogram above zero = Uptrend
- Histogram below zero = Downtrend
- Crossovers signal potential trend changes
RSI:
- Consistently above 50 = Uptrend
- Consistently below 50 = Downtrend
6. Volume Confirmation
Healthy Trends Show:
- Rising volume on moves in trend direction
- Declining volume on corrections/pullbacks
- Volume spikes at breakout points
Quick Checklist for Trend Identification:
✅ Strong Uptrend:
- Higher highs and higher lows
- Price above rising moving averages
- Valid upward trendline intact
- ADX above 25
- Increasing volume on rallies
✅ Strong Downtrend:
- Lower highs and lower lows
- Price below falling moving averages
- Valid downward trendline intact
- ADX above 25
- Increasing volume on declines
⚠️ No Clear Trend (Stay Out):
- Choppy price action
- MAs flat or intertwined
- ADX below 20
- Price between support/resistance
Common Beginner Mistakes:
❌ Looking at only one timeframe
❌ Ignoring the bigger picture
❌ Trading every small wiggle as a "trend"
❌ Not waiting for confirmation
❌ Confusing corrections with reversals
Pro Tips:
💡 **The 3-Touch Rule:** A trend becomes more reliable after price respects a trendline at least 3 times
💡 **Trend is Your Timeframe:** What's an uptrend on daily might be a pullback on weekly
💡 **When in Doubt, Zoom Out:** Higher timeframes show the true direction
💡 **Trade WITH the trend, not against it:** Counter-trend trades have lower probability
**Remember:** Trend identification isn't about being perfect - it's about being on the right side of the market more often than not. Start with the basics (higher highs/lows), then add confirmation tools as you gain experience.
More updates with examples and Explanation on individual topics in a easy way to understand.
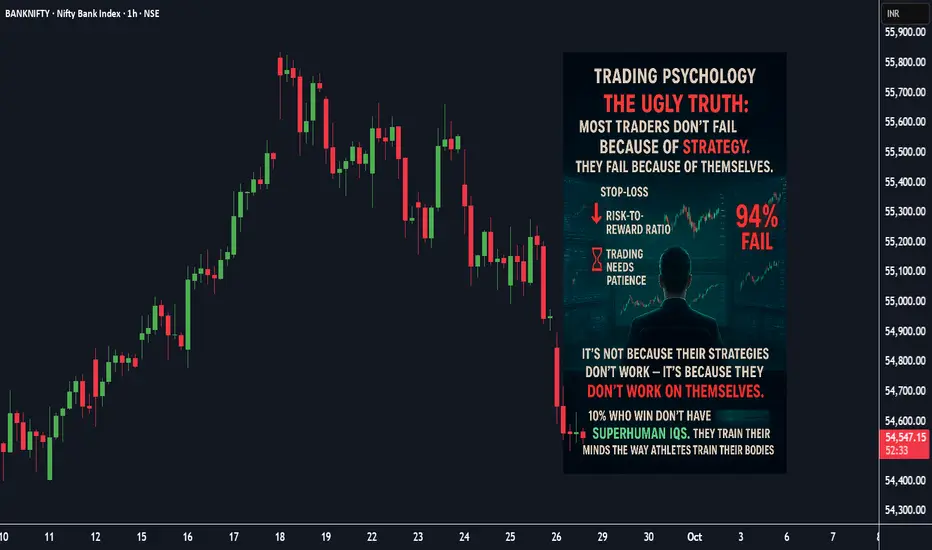
Psychology, Why 90% of Traders Fail (And How to Be the 10%)⚡ The ugly truth: Most traders don’t fail because of strategy. They fail because of *themselves* . It’s NOT bad strategies, it’s bad psychology.
📉 Here’s the real story 👇:
We know about stop-losses.
We know about risk-to-reward.
We know patience matters.
Imagine this: You’ve planned your trade. Price goes against you. Suddenly, your brain whispers:
👉 “Just hold a little longer.”
👉 “Double your position, you’ll recover.”
👉 “Skip the stop-loss this time, it’ll bounce back, praying it turns back.”
NSE:COFORGE
Sound familiar?
That inner voice has blown more accounts than any chart pattern ever did.
🧠 “It’s not because their strategies don’t work—it’s because *they don’t work on themselves*.
✅ The 10% who wins don’t have superhuman IQs . They *train their minds* the way athletes train their bodies.
Here’s how you can upgrade yourself today :
1️⃣ **Detach From Money** → Don’t measure success by today’s P&L.
Measure it by *following your plan*. Consistency is the real wealth.
2️⃣ **Write Your Rulebook 📘** → Define your entries, exits, and risk rules. Print it. Stick it near your screen.
No match = no trade. (Yes, it’s boring. That’s why it works.)
3️⃣ **Journal Your Trades** → Every. Single. Trade. Wins and losses. How did you feel?
Why do you enter?
after doing this, you’ll start to * see your patterns * —and they’ll expose your weaknesses too..
🎯 Success in trading isn’t about predicting/beating the market. It’s about controlling *yourself*, beating your own impulses.
💬 Question for you: Which habit is killing your trades?
NSE:MARUTI
If you could fix just ONE habit right now:— what would it be?
Which one would change your results the most?
1️⃣ Overtrading 🔂
2️⃣ Revenge Trading ⚔
3️⃣ Ignoring Risk ⚠
4️⃣ chasing losses 🏃➡️
5️⃣ No 📘rulebook/📰Journal
💬 Comment below ⬇️
I'll post my new content accordingly.
Happy Trading and Investing!
Regards:
@TradeWithKeshhav
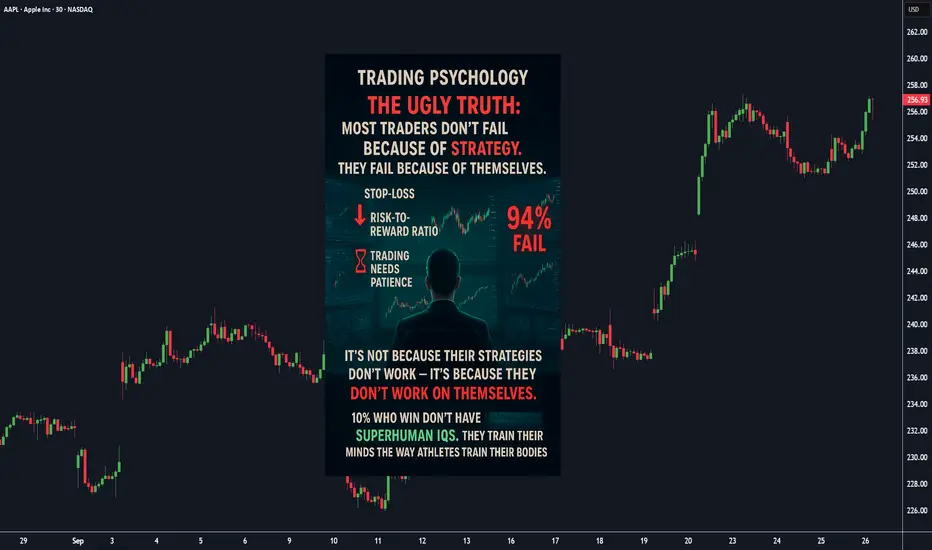
Psychology, Why 90% of Traders Fail (And How to Be the 10%)⚡ The ugly truth: Most traders don’t fail because of strategy. They fail because of *themselves* . It’s NOT bad strategies, it’s bad psychology.
📉 Here’s the real story 👇:
We know about stop-losses.
We know about risk-to-reward.
We know patience matters.
Imagine this: You’ve planned your trade. Price goes against you. Suddenly, your brain whispers:
👉 “Just hold a little longer.”
👉 “Double your position, you’ll recover.”
👉 “Skip the stop-loss this time, it’ll bounce back, praying it turns back.”
NASDAQ:GOOGL
Sound familiar?
That inner voice has blown more accounts than any chart pattern ever did.
🧠 “It’s not because their strategies don’t work—it’s because *they don’t work on themselves*.
✅ The 10% who wins don’t have superhuman IQs . They *train their minds* the way athletes train their bodies.
Here’s how you can upgrade yourself today :
1️⃣ **Detach From Money** → Don’t measure success by today’s P&L.
Measure it by *following your plan*. Consistency is the real wealth.
2️⃣ **Write Your Rulebook 📘** → Define your entries, exits, and risk rules. Print it. Stick it near your screen.
No match = no trade. (Yes, it’s boring. That’s why it works.)
3️⃣ **Journal Your Trades** → Every. Single. Trade. Wins and losses. How did you feel?
Why do you enter?
after doing this, you’ll start to * see your patterns * —and they’ll expose your weaknesses too..
🎯 Success in trading isn’t about predicting/beating the market. It’s about controlling *yourself*, beating your own impulses.
💬 Question for you: Which habit is killing your trades?
NASDAQ:MSFT
If you could fix just ONE habit right now:— what would it be?
Which one would change your results the most?
1️⃣ Overtrading 🔂
2️⃣ Revenge Trading ⚔
3️⃣ Ignoring Risk ⚠
4️⃣ chasing losses 🏃➡️
5️⃣ No 📘rulebook/📰Journal
💬 Comment below ⬇️
I'll post my new content accordingly.
Happy Trading and Investing!
Regards:
@TradeWithKeshhav
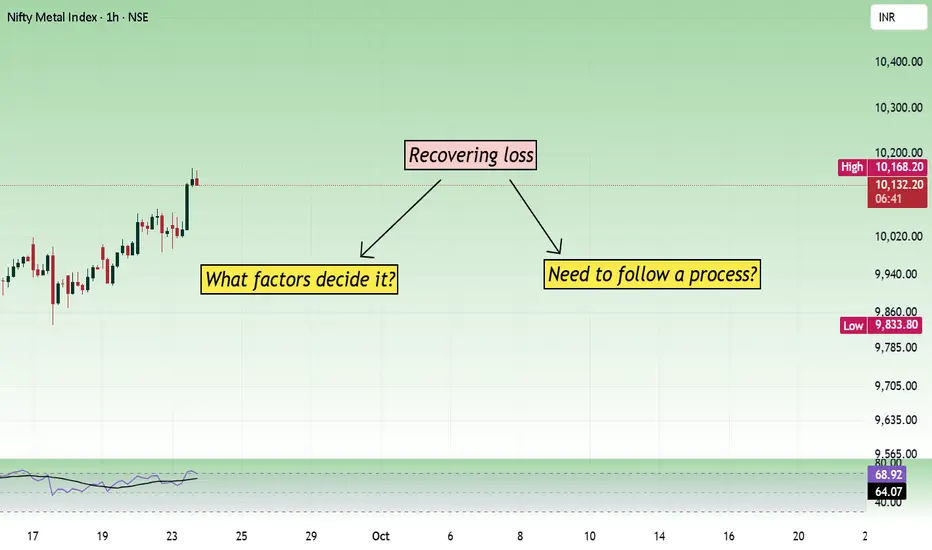
Trader's Queries - The process of recovering loss.Query: How to recover loss faster?
Answer: Those who are new to trading believe it is simple to make money. When they suffer significant losses, they trade more to recover the losses. In my interactions with Novice traders, the majority of them express a desire to recover their losses fast. Does this mindset help in the development of better trading ability? How does a person with this mindset improve?
Trading is a process. This implies that you can not become a profitable trader overnight. It requires financial resources, technical expertise, the correct mindset, and more practice. A person who wants to become a profitable trader should concentrate on the process of trading. When they concentrate on recovering losses fast, they do overtrade, revenge trade, and impulsive trade, and again they are in loss. For instance, if you want to become a skilled driver, you will focus on honing your driving skills before learning what to do in the event of an unexpected situation on the road. It's easy to recover a loss; you just need to improve your trading abilities. And only U, and no one else, can do it. Although others can offer guidance, you are ultimately in charge of your trades.
The market moves in its own phase. Trading opportunities develop as per market conditions, not as per traders' expectations. So you can not predict how much you can recover daily or how much you can earn per day. When these things can not be planned or predicted, it creates uncertainty in the trader's mind. How you manage your expectations decides how fast you can recover from loss.
Part 1 Master Candlestick PatternIntroduction
Options trading has always attracted traders and investors because of its flexibility, leverage, and the ability to profit in both rising and falling markets. Unlike simple stock buying, where you purchase shares and wait for them to rise, options allow you to speculate, hedge, or even create income-generating strategies. But this flexibility comes at a cost: risk.
In fact, while options provide opportunities for huge rewards, they also carry risks that can wipe out capital quickly if not managed properly. Many new traders get lured by the promise of quick profits and ignore the hidden dangers. The truth is, every option trade is a balance between potential gain and potential loss — and understanding the nature of these risks is the first step to trading responsibly.
In this guide, we’ll explore all major types of risk in options trading — from market risk and time decay to volatility traps, liquidity issues, and even psychological mistakes.
1. Market Risk – The Most Obvious Enemy
Market risk is the possibility of losing money due to unfavorable price movements in the underlying asset. Since options derive their value from stocks, indices, currencies, or commodities, any sharp move against your position can create losses.
For call buyers: If the stock fails to rise above the strike price plus premium, you lose money.
For put buyers: If the stock doesn’t fall below the strike price minus premium, the option expires worthless.
For sellers (writers): The risk is even greater. A short call can lead to unlimited losses if the stock keeps rising, and a short put can cause heavy losses if the stock collapses.
👉 Example:
Suppose you buy a call option on Reliance Industries with a strike price of ₹3,000 at a premium of ₹50. If the stock stays around ₹2,950 at expiry, your entire premium (₹50 per share) is lost. Conversely, if you had sold that same call, and the stock shot up to ₹3,300, you’d lose ₹250 per share — far more than the premium you collected.
Lesson: Market risk is unavoidable. Every trade needs a pre-defined exit plan.
2. Leverage Risk – The Double-Edged Sword
Options provide huge leverage. You control a large notional value of stock by paying a small premium. But this magnifies both profits and losses.
A 5% move in the stock could mean a 50% change in the option’s premium.
A trader who overuses leverage can blow up their capital in just a few trades.
👉 Example:
With just ₹10,000, you buy out-of-the-money (OTM) Bank Nifty weekly options. If the market moves in your favor, you might double your money in a day. But if it goes the other way, you could lose everything — and very fast.
Lesson: Leverage is powerful, but without discipline, it’s deadly.
3. Time Decay Risk – The Silent Killer (Theta Risk)
Options are wasting assets. Every day that passes reduces their time value, especially as expiry nears. This is called Theta decay.
Option buyers suffer from time decay. Even if the stock doesn’t move, the option premium keeps falling.
Option sellers benefit from time decay, but only if the market stays within their expected range.
👉 Example:
You buy an at-the-money (ATM) Nifty option one week before expiry at ₹100. Even if Nifty stays flat, that option could drop to ₹40 by expiry simply because of time decay.
Lesson: If you are an option buyer, timing is everything. If you are a seller, time decay works in your favor, but risk still exists from sudden moves.
4. Volatility Risk – The Invisible Factor (Vega Risk)
Volatility is the heartbeat of options pricing. Higher volatility means higher premiums because there’s a greater chance of large price moves. But this creates Vega risk.
If you buy options during high volatility (like before elections, results, or big events), you may pay inflated premiums. Once the event passes and volatility drops, the option’s value can collapse, even if the stock moves as expected.
Sellers face the opposite problem. Selling options in low volatility periods is dangerous because any sudden jump in volatility can cause premiums to spike, leading to losses.
👉 Example:
Before Union Budget announcements, Nifty options trade at very high premiums. If you buy expecting a big move, but the budget turns out uneventful, volatility drops sharply, and the option loses value instantly.
Lesson: Never ignore implied volatility (IV) before entering an option trade.

Part 2 Support and Resistance1. How Option Pricing Works
Option pricing is determined primarily by two components:
1.1 Intrinsic Value
The intrinsic value of an option is the difference between the current market price of the underlying asset and the option’s strike price:
For a call option: Intrinsic Value = Max(0, Current Price – Strike Price)
For a put option: Intrinsic Value = Max(0, Strike Price – Current Price)
1.2 Time Value
The time value accounts for the possibility that the option’s price may increase before expiration. Factors influencing time value include:
Time to Expiry: Longer durations increase the likelihood of profitable movement.
Volatility: Higher volatility increases the potential for price swings, making options more expensive.
Interest Rates and Dividends: These factors can adjust the expected returns of the underlying asset and, consequently, the option premium.
1.3 The Black-Scholes Model
The Black-Scholes model is a widely used formula for estimating theoretical option prices. It considers factors like:
Current stock price
Strike price
Time to expiration
Volatility
Risk-free interest rate
This model forms the foundation of modern option pricing, though practical trading often considers market sentiment and liquidity as well.
2. Types of Option Styles
Options come in several styles, each dictating when the option can be exercised:
American Options: Can be exercised any time before expiration.
European Options: Can only be exercised on the expiration date.
Exotic Options: Include complex derivatives such as barrier options, Asian options, and lookback options, often used by institutional investors.
3. Uses of Options
Option trading serves multiple purposes in financial markets:
3.1 Hedging
Investors use options to protect their portfolios from adverse price movements:
Protective Put: Buying a put option to insure a long stock position.
Covered Call: Selling a call option on a stock already owned to earn additional premium income.
3.2 Speculation
Traders can use options to profit from anticipated price movements without owning the underlying asset:
Buying call options for bullish expectations.
Buying put options for bearish expectations.
Using leverage, a small investment can yield substantial returns if predictions are correct.
3.3 Income Generation
Selling options allows traders to collect premiums regularly:
Cash-Secured Puts: Selling put options while holding enough cash to buy the underlying asset if exercised.
Covered Calls: Generates income by selling calls against owned stock.
3.4 Arbitrage
Institutional traders use options to exploit price discrepancies between markets, combining options and underlying assets for risk-free profits.

On the Fear of FailureContemporary man suffers from a malaise that he often fails to express in words, stemming from the barrage of stimuli that overwhelm him daily and, in particular, from the crisis of traditional values that once provided clarity about the meaning of his existence.
This malaise is often fear, a preservation instinct whose evolutionary function is to prepare us for potential threats or to regulate behaviours that could harm the community, the cornerstone of our survival as a species.
Fear accompanies us at every moment: fear of failure, of disappointing our loved ones, of losing status, or even fear of fear itself.
In the world of investments, the inherent risk of facing uncertainty and the slim chances of success amplify the emotional burden of every decision. Thus, fear, originally protective, can become a paralysing or self-destructive force.
Manifestations of Fear in Investors
In the wild ecosystem of investments, fear can be classified into three main manifestations. The first is the fear that an idea or method will fail, leading investors to cling to flawed systems for too long or to delay the necessary testing before executing them. By nature, we avoid discomfort, and after investing time and energy in a project, facing a dead end feels profoundly unsettling.
The second is the fear of missing out on “the big opportunity,” particularly common among novice investors exposed to communities that showcase extraordinary results, often exaggerated or fabricated. This fear drives them to act recklessly, increasing the likelihood of costly mistakes.
The third, and most devastating, is the fear of being a failure, a malaise that can lead to anxiety, depression, and social isolation, while severely undermining performance.
A Way of Understanding is a Way of Feeling
The challenge in confronting paralysing impulses like fear lies in the fact that many proposed solutions, such as motivational speeches or rationalist approaches, end up reinforcing the same belief system that generates the discomfort. For instance, a motivational speech often has a fleeting effect, focusing on achieving success and developing positive ideas rather than embracing mistakes as a fundamental part of growth.
Paralysing fear can even limit the ability to assimilate constructive ideas or take positive actions. It is our belief system, the way we interpret reality, that either liberates or enslaves us and defines our capacity to succeed in any endeavour.
Most people today hold a flawed belief system, obsessed with outcomes and external validation, which makes them vulnerable to discomfort and distances them from authentic progress.
Conquest Through Failure
Just as a muscle strengthens by tearing its fibres to the point of exhaustion, love blossoms from sacrifice, and a skill is forged through time and dedication, both investments and life itself thrive on our exposure to mistakes for growth.
In trading, every loss or failed strategy is an opportunity to learn, adjust, and move forward, provided we transform our beliefs to see failure as the engine of progress and obstacles as stepping stones to virtue. Once we embrace this truth as the essence of our reality, we accept that disappointing others, being vulnerable to criticism, or being misunderstood is the inevitable price of growth—not only in investments but in every facet of our existence.
Every great discovery or talent has emerged from the struggle against failure, often confronting barriers imposed by institutions, social norms, or internal fears. Limitations such as age, lack of formal education, or excuses to justify failure often chain the common man to inaction.
Yet history shows us how Charles Darwin, Gregor Mendel, Michael Faraday, or Abraham Lincoln, without formal academic training, transformed the course of science, politics, and humanity. Others, like Charles Bukowski, Peter Mark Roget, or Maria Sibylla Merian, achieved their dreams at an advanced age, proving that time is not a barrier to reaching fulfilment.
The reality is that anyone, by overcoming obstacles in any field, can achieve excellence in a few years if they free themselves from limiting emotions and beliefs. Existence itself, whether by divine design or the vastness of the universe, endows us with opportunities: in one year, someone can overcome an addiction; in just two years, someone can maximise their physical potential; in less than five years, with effort and without fear of mistakes, almost any skill can be mastered. As long as we breathe, we hold in our hands the ability to positively transform our reality.
Conclusions
Although my usual focus is on the technical aspects of markets, on this occasion, I have sought to connect with the human side of the investors who read me, as I wish for them to understand that failing means fearing and retreating in the face of setbacks, while succeeding is failing fearlessly for a prolonged period until achieving virtue.
I am convinced that understanding mistakes and failure as inevitable and necessary parts of growth will not only strengthen their finances in the future but also make them freer and more confident individuals in all aspects of their lives.
Face every loss with gratitude, transforming mistakes into learning, and act with prudence and determination.
Timeframes Change EverythingInfluential educators often spread erroneous ideas that end up costing the community money. One of the most harmful opinions, sadly accepted by most investors, is that all timeframes are equal for practical purposes, since the market is fractal. With this article, I aim to shed light on this phenomenon and demonstrate that timeframes are more than just a matter of preference.
Mass Psychology and Historical Record
Shorter timeframes, such as intraday charts, offer a price record and a more limited context compared to longer timeframes—daily, weekly, or monthly—which can make it difficult to identify clear and reliable patterns. Additionally, another relevant aspect is that the duration of a market phenomenon is often an indicator of its consistency: trends that persist over time tend to reflect more stable and predictable behavior.
For this reason, investors prefer to base their decisions on an analysis that considers a greater amount of historical data, such as that provided by longer timeframes. The lack of a complete history limits the ability to detect solid and consistent patterns, increasing the risk of less informed decisions.
News, Events, and Rumors
The appearance of a surprise announcement about interest rates or a geopolitical event can trigger panic or euphoria among investors, leading them to buy or sell assets without a clear strategy. Even a simple rumor can cause chaos in price charts, highlighting how unpredictable humans are in the face of new circumstances. This instability is generally clearly reflected in 5-, 15-, or 60-minute charts, where volatility increases dramatically. The historical record of this irrationality rarely affects trends in longer timeframes, which offer a more stable and consistent perspective.
On this, the renowned investor and author, Dirk du Toit , has said the following:
"The smaller your timeframe, the greater the randomness of what you're observing. If you're watching price changes every five or fifteen minutes, the degree of randomness is very high, and your probability of anticipating the next correct price movement, or series of price movements, is very low."
Manipulation:
Higher timeframes require a greater volume of money to be manipulated, as the interests that form the price action have matured over a longer period (increasing their reliability). Generally, higher timeframes are operated by more capitalized participants who trade with long-term objectives.
High-frequency trading (HFT) is a form of automated trading that uses advanced algorithms, high-speed computer systems, and low-latency connections to execute a large number of trades in fractions of a second. This type of trading is characterized by exploiting small market inefficiencies, operating with large volumes, and holding positions open for extremely short periods.
In lower timeframes, price movements can appear random or "noisy" due to HFT activity, which makes traditional technical analysis difficult for manual traders.Technical patterns (such as supports, resistances, or breakouts) can break quickly due to algorithmic action, which does not operate based on classical patterns, but on high-frequency data like order flow or statistical correlations.
Randomness increases with shorter timeframes. An example of this is the reduction in the success rate of trading systems as we move to lower timeframes. Profitable systems (documented) on daily charts can become unusable on timeframes like 4-hour or 1-hour.
Additional Ideas:
-All classic indicators (MACD, RSI, Bollinger Bands, Keltner Channels, Donchian Channels, Williams Alligator, Ichimoku Cloud, Parabolic SAR, DMI, etc.) have been created based on timeframes higher than intraday.
-All known classic methodologies (Dow Theory, Chartism, Elliott Theory, Harmonic Patterns, Wyckoff Method, Gann Theories, Hurst Cycles, Japanese Candlestick Patterns, etc.) were created with a focus on timeframes higher than intraday.
-All great classic analysts, and most great current investors, apply an investment approach higher than the intraday timeframe.
On Some Authors:
-Richard W. Schabacker in his book “Technical Analysis and Stock Market Profits” (1932) structured market fluctuations into Major Movements (monthly chart or higher), Intermediate Movements (weekly chart), and Minor Movements (daily chart). His analyses were based on the study of these timeframes.
"The more time it takes for the chart to form the image of any formation, the greater the predictive significance of that pattern and the longer the subsequent movement, the length, size, and strength of our formation."
- Dirk du Toit in his book titled “Bird Watching in Lion Country” comments:
"The smaller your timeframe, the greater the randomness of what you're observing. If you're watching price changes every five or fifteen minutes, the degree of randomness is very high, and your probability of anticipating the next correct price movement, or series of price movements, is very low."
"A coin, just like a five-minute chart, has no memory. Just because it has come up heads eight times in a row, it doesn't start to 'adjust' to provide the required probability balance of a 50/50 ratio in a given number of tosses. Five- or fifteen-minute charts are the same. Trying to predict whether the next five-minute period will end up or down is exactly like flipping a coin."
Conclusions:
I do not intend to dismiss methodologies that take advantage of fluctuations in shorter timeframes. My goal is to warn retail investors about the risks of intraday trading: randomness, manipulation, and limited information turn these timeframes into dangerous terrain. Even effective systems proven on daily charts tend to suffer statistical wear. In contrast, higher timeframes offer clarity and consistency, backed by mass psychology, historical record, and trading volume.
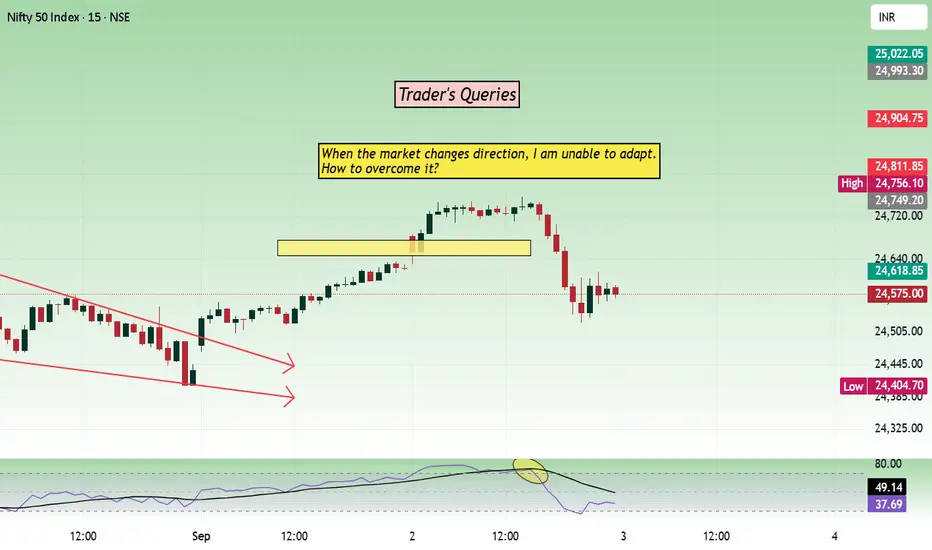
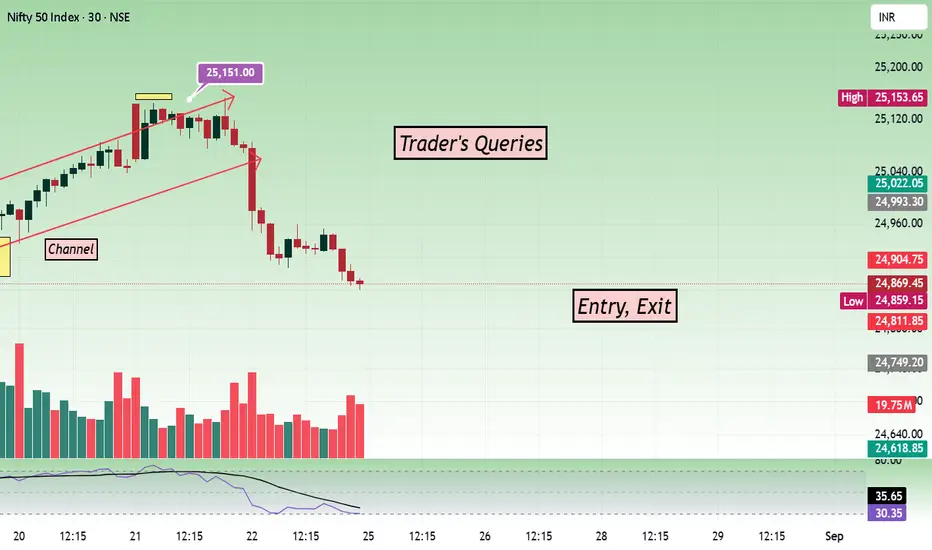
Trader's Queries - Trend direction and adapting it...Query: When the market changes direction, I am unable to adapt. How to overcome it?
Answer: I was thinking about this topic in the morning, and nifty itself gave the exact scenario. So we will take today’s price action and understand the trend direction change. Before going into the technical, we should know that humans can adapt to any situation. We are designed in that way. Because of our emotions during the live market, we forget that we can adapt.
Sometimes the trend direction changes fast, sometimes it takes time, like today. When it takes time to change direction, we have time to adapt. Do you agree?
Price took 3 hours to consolidate within a narrow range before deciding the direction. Mark the range. And take entry when the price closes above or below the range. Spike will be less in a higher time frame. In this chart, I have taken a 15-minute time frame.
Do indicators help?
Yes, it helps. You can see RSI in the chart, and it is in an overbought area when the price was consolidating. Any bearish sign indicates a bearish scenario. Once the RSI crosses the MA, the price breaks the range and falls.
When price gives time to decide what to do, make use of that opportunity. Price action, support/resistance, and indicators like RSI, MACD can help you to understand the direction change.
Every time the market gives a different scenario and I have explained one scenario with an example. Hope it helps. Keep learning. Keep growing.
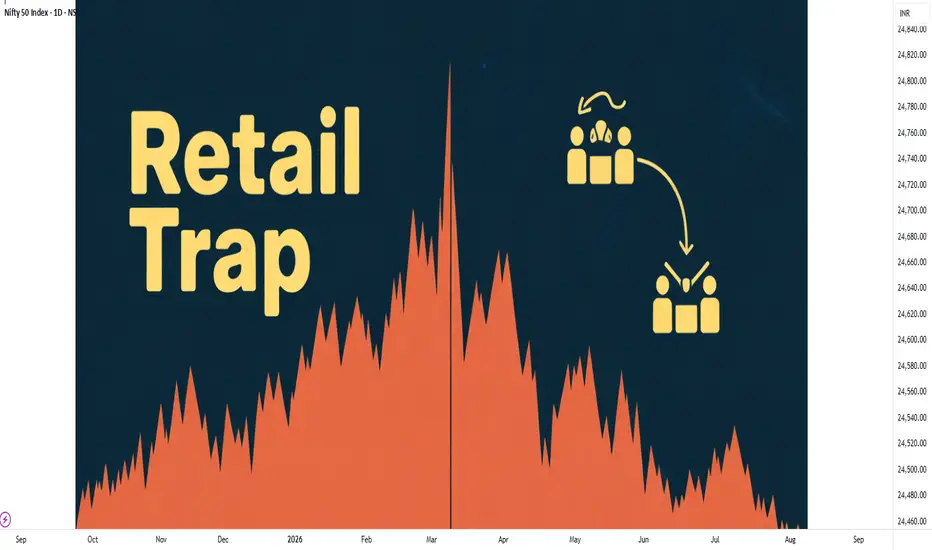
Why Most Retail Investors Buy at the Top and Sell at the Bottom!Hello Traders!
Most retail investors often struggle with timing the market. They end up buying when prices are high and panic-selling when markets fall. Let’s break down why this happens and how you can avoid it.
The Psychology Behind the Mistake
Fear of Missing Out (FOMO): When stocks rally, people feel they might miss the opportunity. This pushes them to buy at high levels.
Panic and Fear: During corrections or crashes, emotions take over. Instead of holding, many sell in fear of further losses.
Herd Mentality: Most investors follow the crowd. If everyone is buying, they buy. If everyone is selling, they sell too.
How to Avoid This Trap
Have a Clear Plan: Define your entry and exit strategy before investing. Don’t act on impulse.
Focus on Fundamentals: Long-term value creation comes from fundamentals, not short-term price moves.
Use SIP or Staggered Buying: Instead of putting all your money at once, invest gradually to avoid catching tops.
Control Emotions: Discipline and patience are your biggest strengths as an investor.
Rahul’s Tip:
Smart investing is not about predicting the exact top or bottom. It’s about consistency, discipline, and managing risk. If you can keep emotions out of your decision-making, you’ll already be ahead of most retail investors.
Conclusion
Buying at the top and selling at the bottom is not a market problem, it’s a mindset problem. Once you fix the psychology, your investment journey becomes much smoother.
If this helped, like/follow/comment.
Trader's Queries - How to take right entry, exit in trading?Trader's Queries are back with more insights as I have gained more experience in trading.
Query: Frequently, I find myself entering and exiting trades late; how can I address this issue?
Answer: Often, traders who lack confidence in the trend make late entries and exits. This practice diminishes profits and heightens risk. Is there a method to enhance profits while minimizing risk?
Indexes frequently open with gaps up or down. If you are aware of key support and resistance levels before the market opens, executing trades will be easier. However, if you wait until after the market opens to assess support and resistance before deciding on your actions, your entries will likely be delayed.
Stocks typically do not experience significant gap-up or down days, so the opening should not catch you off guard.
You can utilize these strategies to identify optimal entry and exit points.
Price action – Always the number one.
Volume
VWAP
RSI or MACD
Nifty spot chart has volume in TradingView. I use it to understand the trend. Price action gives you more information when you understand where it is forming.
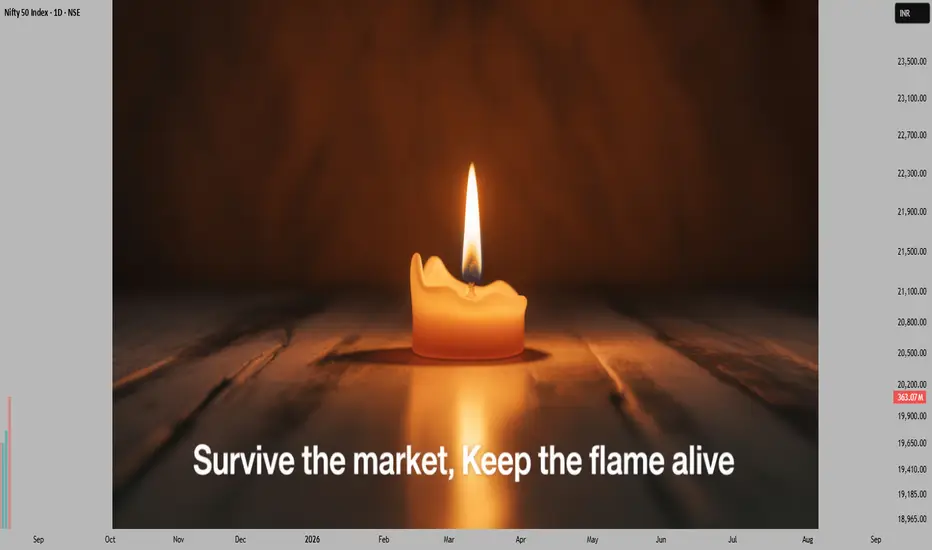
Survive the Market, Keep the Flame AliveThere was once a candle burning in a dark room.
Every night, the darkness surrounded it. The candle felt small, almost useless, compared to the never-ending black. But it kept burning.
At first, the candle thought it had to fight the darkness. It wanted to shine stronger, to push the darkness away. But then it realised something important, darkness never goes away. It will always be there.
The candle could not win against the dark.
Its only job was to survive the night.
Even with a small flame, it could give enough light to walk, to see, to keep hope alive.
Over time, the candle understood: strength was not about fighting. Strength was about lasting.
Trading is very similar.
The market is like the darkness. It is huge, unpredictable, and does not care what you want. You cannot control it.
Your job as a trader is not to fight the market. Your job is to protect your flame, your money, your patience, your discipline.
The traders who last are not the ones chasing big profits every day. They are the ones who protect themselves, who stay calm, and who last long enough to see opportunities.
This game is not about controlling the market. It is about controlling yourself.
Good trading is not exciting. It is simple, repetitive, and sometimes boring. But boring is safe. And safe is what keeps your flame alive.
Wins will come. Losses will come. Neither will destroy you if your flame is protected.
Ask yourself:
Can you protect your money on bad days?
Can you accept small losses without fear?
Can you stay patient when nothing is happening?
The market will always be uncertain. The darkness will always be there.
But if you can keep your light burning, the morning will come.
From Great Expectations to Zero Expectations...Making decisions on our own during trade hours is a requirement. A novice trader anticipates becoming a successful trader quickly, in a few days or months. Trading requires experience to thrive, just like any other career. The tension that comes with expecting to be successful in every deal will be lessened if a novice understands this and stops having high expectations of himself. We also have high expectations from other traders. We expect traders who are our friends to contribute their analysis, trading strategies, and trading advice. Since trading requires us to control our emotions, the truth is that we are the only ones who can accomplish that, and others cannot assist us in it. And also, since trading is an independent job, there is no point in depending on others. Having high expectations of yourself and others won't be beneficial in trading. Develop a mindset that can accept the outcome of the trade. Trading becomes easier with it. After losing money, a trader also has high expectations for proving to his loved ones that he is a wise trader. Are you aware of where this idea came from? Ego. This ego makes you fearful and greedy. Never attempt or consider proving yourself to other people. It is not that important and a tough thing to do. You will make poor trades if you have that ego. Try to improve as a trader in small steps. Eventually, minor adjustments can have significant outcomes. Becoming a better trader, rather than trying to prove to others, is the true gift.

Survival First, Success LaterThere was once a stone that lay deep in the heart of a flowing river.
Every day, the water rushed past it, sometimes gently, sometimes with force. The stone wanted to stay strong, unmoved. It believed that by holding its ground, it could outlast the river.
For years, the stone resisted. It didn’t want to change. It believed that strength meant standing still, no matter how hard the current pulled.
But slowly, almost without noticing, the stone began to wear down. The river wasn’t trying to destroy it. The water wasn’t cruel. It was simply doing what rivers do - moving, shifting, carving its own path.
One day, the stone realised it wasn’t the same shape anymore. It was smoother now, smaller in places. It hadn’t won by resisting. It had survived by adapting. It had learned to let the river shape it without breaking it apart.
The stone couldn’t control the river. All it could do was endure without letting itself be shattered.
Trading is NOT so different.
The market moves like a river. It doesn’t care if you want it to go left or right. It doesn’t reward those who stand rigid against its flow. It rewards those who learn when to hold their ground, when to let go, and how to survive the constant pull of forces bigger than themselves.
This is NOT a story about rivers and stones. It’s a story about YOU.
About learning to endure without breaking. About understanding that survival comes not from fighting the current, but from learning how to live within it.
Much like the stone, every trader begins with the same illusion, that strength means control, that certainty can be conquered with enough knowledge or willpower.
But time in the markets teaches you otherwise. It shows you, again and again, that survival isn’t about resisting the flow. It’s about learning to move with it, to protect yourself from the inevitable storms without being broken by them.
And so, this is where the real story of trading begins.
Trading often appears simple from a distance. You buy, you sell, you make a profit, and then you repeat the process.
But anyone who has spent enough time in the markets will tell you the truth. This isn’t a game of certainty. This is a game of survival.
The market humbles you early. It doesn’t care how much you know, how brilliant you think you are, or how much confidence you bring. The market doesn’t reward ego; it breaks it down piece by piece.
Almost everyone starts with the same mindset. You want to win. You want to make money. You believe you can figure it out if you study hard enough, work smart enough, hustle more than the next person.
But eventually, reality steps in. You begin to understand this game isn’t about knowing where the price will go next. It’s about knowing where you will stop, where you will cut a loss, where you will step aside and wait.
The traders who survive are not the ones who chase perfection or seek to predict every move. They are the ones who learn how to lose properly - small losses, controlled losses. Losses that don’t bleed into something bigger, mentally or financially.
Most people can’t do that. They fight the market. They fight themselves. They refuse to accept small losses, believing they can somehow force a different outcome.
Those small losses eventually snowball. Blowups rarely come from one bad trade. They come from ignoring the small signs over and over again. The market isn’t cruel. It’s just indifferent. It’s your responsibility to protect yourself.
Good trading isn’t loud. It isn’t exciting. It isn’t full of adrenaline and big calls.
Good trading is quiet, repetitive, and frankly, a little boring. It’s built on discipline, not drama. Your job is to manage risk, protect your capital, and let time do its work.
There is no holy grail. There is only process. A process you can repeat with a clear head, day after day, year after year, without losing yourself in the noise.
Wins will come. Losses will come. Neither defines who you are. What defines you is how you respond.
⦿ Can you stay calm after a red day?
⦿ Can you follow your plan even after a mistake?
⦿ Can you sit on your hands when there’s nothing to do and trust the work you’ve already done?
Patience, in the end, is the real edge. Most won’t have it.
They’ll bounce between strategies, searching for certainty where none exists. They’ll burn out chasing shortcuts. They’ll forget that progress comes through small, steady steps taken over years, not through chasing big wins.
Trading is a mirror. It reflects your fear, your greed, your impatience. It shows you who you really are. Ignore what it reveals and you’ll keep paying for the same lesson until you finally learn it.
In the end, this game isn’t about the market. It’s about YOU.
⦿ Learn to protect yourself.
⦿ Learn to sit with boredom.
⦿ Learn to lose well.
⦿ Learn to wait without losing faith.
If you can do that, the market has a way of rewarding you in time.
OHLC Monthly Magic🎯 Simple but Powerful Trading Concept – No Indicators, No Patterns Needed!
Dear viewers,
Today, I'm sharing something so simple that most traders completely overlook it. While everyone else is busy complicating trading with fancy indicators, patterns, and strategies — I want to take you back to the basics that actually work.
✅ I’m using a Nifty chart to explain this. I’ve highlighted the previous month’s candle, and using the drawing tool’s magnet mode, I’ve plotted simple horizontal lines at the:
• Open
• High
• Low
• Close
📊 That’s it! No indicators. No patterns. Just price action from the previous month.
Now, switch to the Weekly or Daily timeframe and observe what happens around those levels. You’ll see clear supply and demand zones forming — automatically. These are the real institutional levels where price reacts strongly.
🔒 Who Should Use This?
If you're a retail trader, I do not recommend getting into intraday or index options — they are high-risk and emotionally draining, especially for beginners.
However, if you're an experienced trader and can handle the volatility, here’s how you can use this method powerfully:
📅 After marking the previous month’s OHLC levels:
• Move to the current month
• Watch how price interacts with those levels
• Combine this with RSI for extra confirmation:
📈 RSI + OHLC = High-Probability Zones
• If RSI > 60 and price is nearing the previous high — there's an 80-90% chance of a breakout.
• If RSI < 40 and price is near the previous low — expect further downside.
• We ignore the 40–60 RSI range. It’s noise. We're only focused on strong bullish or bearish momentum.
✅ Try this on stocks, crypto, forex (EUR/USD) — anything.
Once you master this concept, you won’t need any fancy indicators or complicated supply-demand theories. Just price action and momentum will guide your trades.
Thanks for watching, and apply this to see the magic yourself. Check my previous post for deeper understanding of -
Positional Trading Setup
Swing Trading Setup
Stock Options Swing Setup
And - Investment Positional Trading Setup (coming soon)
Focus on which is simple. God Blesses you All!
Faraaz T
Sr. Exec. Research Analyst - Equity
Stockholm Securities - UK

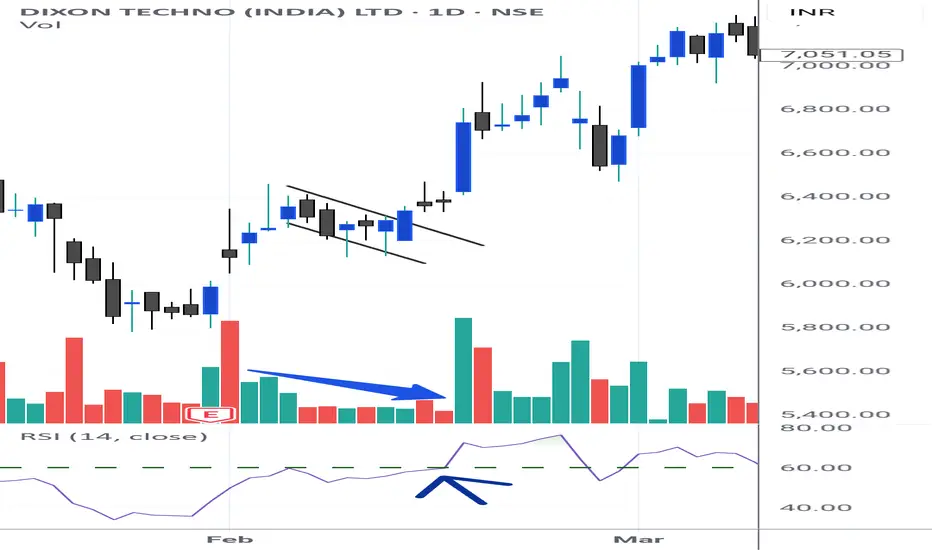
Swing Trading - Pullback and Volume contraction setup - PROA pullback entry with volume contraction is a powerful setup used by swing traders and position traders to enter strong trends at low-risk points. Here's how you can identify and trade this setup:
✅ Concept:
• A pullback is a temporary decline in price within an established uptrend.
• Volume contraction during this pullback shows reduced selling pressure, indicating that the correction is healthy and likely to resume upward.
📊 Technical Setup:
1. Trend Filter
• Uptrend confirmation using:
• Monthly RSI > 60
• Weekly RSI > 60
• 50 EMA above 200 EMA on Daily chart (optional confirmation)
2. Price Action
• Stock is making higher highs and higher lows
• After a sharp rally, price pulls back 3–5 candles on the Daily chart
• Pullback should be orderly (no panic selling or wide candles)
3. Volume Contraction
• Volume decreases gradually during the pullback
• Look for lowest volume near the end of the pullback
• Indicates sellers are drying up and big players are not exiting
4. Entry Trigger
• Entry when price breaks above previous day's high with:
• Spike in volume on breakout
• Optional: bullish candlestick (Marubozu, Bullish Engulfing, or Hammer)
5. Stop Loss
• Just below the pullback low or
• Below the 10 EMA on daily chart
6. Target
• First target = previous swing high
• Trail SL using ATR or 20 EMA if trend extends
📘 Example:
Let’s say you’re watching Tata Motors:
• Monthly RSI = 68
• Weekly RSI = 65
• Daily chart: Stock rallied from ₹800 to ₹860, then pulls back to ₹840 with 3 red candles
• Volume during pullback: 12M → 10M → 7M → 5M
• On Day 4, price forms a bullish hammer and breaks ₹845 on higher volume
📈 Entry = ₹845
🛑 Stop Loss = ₹835
🎯 Target = ₹865+ (prior high), trail after that
🔍 Bonus Filters (Optional):
• Inside bar formation
• Fibonacci retracement (38.2%–50% zone)
• Near support from moving averages (20 EMA / 50 EMA)
Check my previous post in understanding full concept in detail. Support and follow for PRO level understanding. Share with as many retail traders as possible.
God Bless you All!
Faraaz T
Sr. Equity Research Analyst
Stockholm Securities - UK
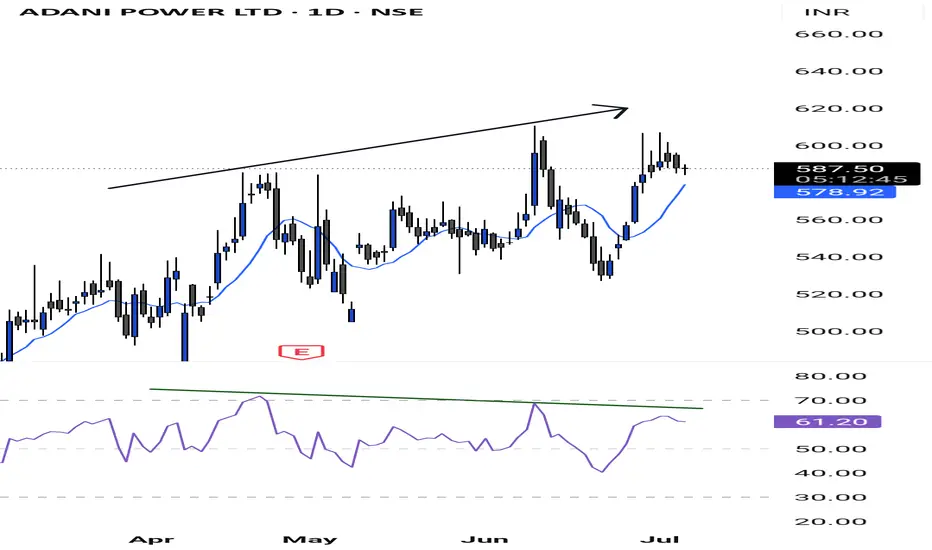
Swing Trading - Stock Options Strategy (Part 2)🔍Important Add-On: RSI Divergence Strategy in Swing Trading (Stock Options)
In the previous educational video on swing trading using stock options, one key element was missing — RSI Divergence.
📉 What is RSI Divergence?
RSI Divergence occurs when the price of a stock makes a higher high, but the RSI forms a lower high on the daily chart. This is a strong signal of weakening momentum and a potential reversal.
📌 Key Guidelines to Follow:
Avoid Taking Long Positions:
If you observe a higher high in price but a lower high in RSI (bearish divergence), avoid entering into a long (buy) trade — even if all other criteria align.
Use the Divergence as a Filter:
Among the pre-selected 25 liquid F&O stocks I provided, if you identify such bearish divergence on the daily chart, that stock should be kept aside and not considered for a long trade setup.
Look for PE (Put Option) Opportunities:
If a stock is showing RSI divergence to the upside while the monthly and weekly charts are above the 9 SMA, this could indicate an upcoming downside move. In such cases, consider PE (Put Option) selling or downside trades (with proper risk management).
🧠 Always Combine with Multi-Timeframe Confirmation:
While divergence is a powerful signal, always validate it alongside your existing strategy rules like 9 SMA and market structure.
Note - You can see in the chart that prices are forming higher highs, while RSI levels are making lower lows. In this case, even if the momentum or the monthly and weekly trends push the price above the 9 SMA, we will not consider this option for entry.
Any doubts, please ask in the comment section.
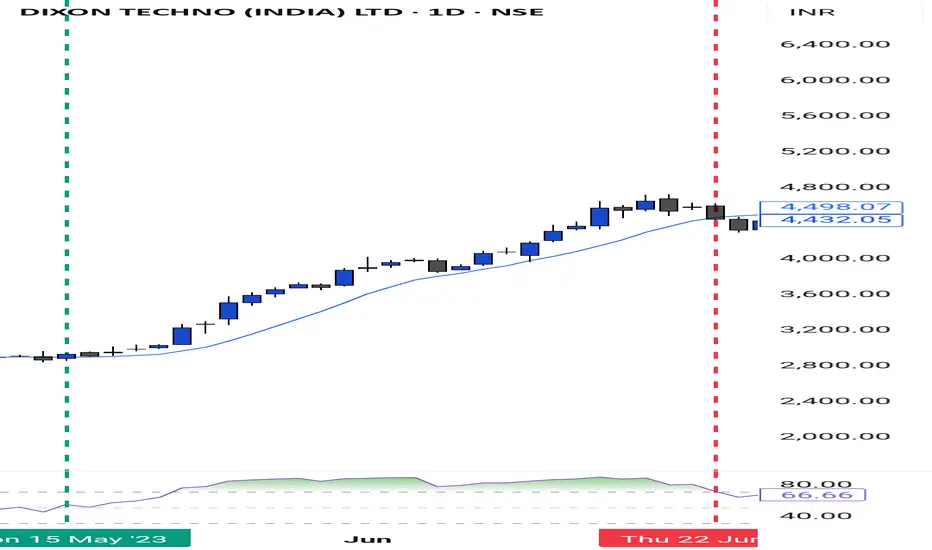
Swing Trading - Stock Options Buying Strategy📈 Swing Trading Strategy – Stock Options
Tools Used: 9 SMA, RSI, Market Structure
Stock Universe: 25 Pre-Selected High Beta, Highly Liquid F&O Stocks
🔒 No further filtering or stock selection is required. Trade only within this universe.
✅ Strategy Overview
This is a swing trading strategy focused on buying stock options, using a systematic multi-timeframe confirmation approach involving:
• 9-period Simple Moving Average (9 SMA)
• Relative Strength Index (RSI)
• Market Structure
📌 Rules of Engagement
1. 📅 Monthly Timeframe – Primary Trend Filter
• The monthly candle must close above the 9 SMA.
• The RSI must be greater than 50 on the monthly chart.
2. 📆 Weekly and Daily Timeframes – Trend Confirmation
• Both weekly and daily candles must close above the 9 SMA.
• The RSI must be above 50 on both the weekly and daily charts.
3. 🕒 Entry Trigger – 15-Minute Chart (Execution Timeframe)
Once higher timeframes align:
• Switch to the 15-minute chart.
• Wait for a pullback to the 9 SMA, and enter near this level.
4. 🛡️ Stop Loss – Initial Risk Management
• Set the stop loss just below the low of the daily candle that first closed above the 9 SMA.
5. 🏁 Exit & Re-Entry Criteria
• Exit the position if the daily candle closes below the 9 SMA.
• Re-enter only when the full setup aligns again across all timeframes.
🔁 Profit Trailing Strategy
🔒 Step 1: Lock-In at Cost
• After three consecutive bullish daily candles, trail your SL to breakeven (your entry price).
📉 Step 2: Dynamic Trailing
• For every 5 bullish daily candles,
➤ Trail your SL to the lowest low of the 1st candle in that group.
• Continue this until a daily close below the 9 SMA, at which point exit completely.
⏰ Option Expiry Guidelines
• Enter trades only after 2 days of expiry (e.g., from Friday onwards for weekly expiry on Thursday).
• Exit trades before the last 2 days of expiry to avoid theta decay.
• Choose liquid strike prices in 0.5 or 1-point intervals.
▸ Example: If the stock is at ₹439, pick ₹400 ITM or ₹450 for better liquidity.
⚠️ Additional Notes
• Strictly trade within the 25 pre-identified high beta, liquid F&O stocks.
• This strategy performs best in trending markets.
• Avoid overtrading or deviating from the setup rules.
• Maintain a trading journal to track entries, exits, and stop loss adjustments.
•
📊 High Beta, Liquid F&O Stocks (Current List)
Adani Enterprises Adani Power Axis Bank IndusInd Bank Bajaj Finance Kotak Mahindra Bank HDFC Bank Tata Motors Larsen & Toubro JSW Steel Reliance Industries IndiGo Tech Mahindra Titan Sun Pharma Cipla Bajaj Finserv BPCL Mahindra & Mahindra Aurobindo Pharma Dr Reddy’s Laboratories Shriram Finance Lupin Container Corporation (Concor) Siemens
VIMP - Same process will be followed for Downtrend/PE buying. Montly candle must give its closing below 9 SMA with RSI 50 crossing below
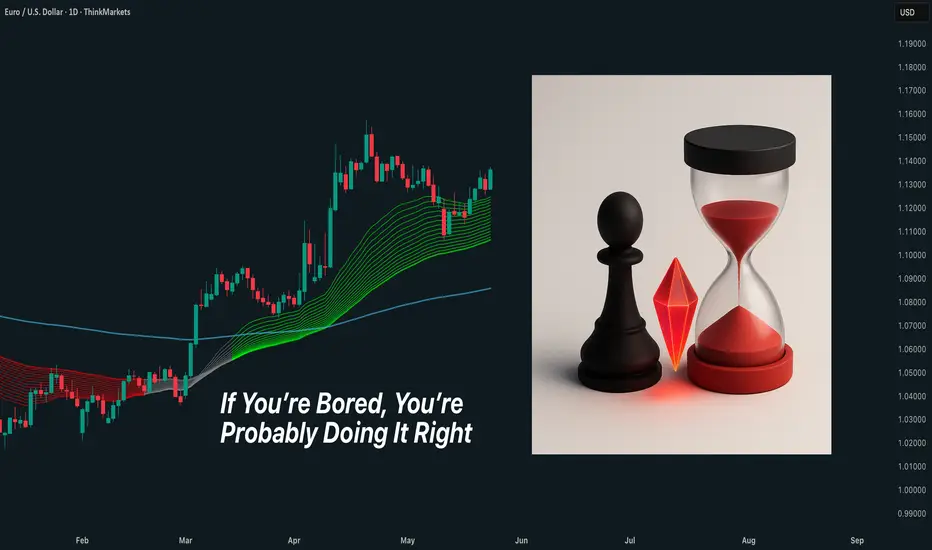
If You’re Bored, You’re Probably Doing It RightYou think trading should be exciting?
That every day should feel like a high-stakes chess match?
That if it doesn’t feel intense, something’s wrong?
Nope.
Good trading is boring.
Systematic.
Repetitive.
Unemotional.
You take your setup. You size properly. You respect your stops. You move on.
Same rules. Same routine. Same process.
It’s not sexy. But it’s stable.
The truth?
The more exciting your trading feels, the more likely you’re slipping.
Overleveraging. Overtrading. Overreacting.
Boredom isn’t a bug. It’s a feature.
It means you’re not chasing.
You’re not forcing.
You’re following your edge — and letting the numbers do the heavy lifting.
You don’t need adrenaline.
You need consistency.
Get comfortable with boredom. That’s where the money is.
Boredom is not your enemy — it’s your ally.
Stay patient, stay consistent.
Charts & Grit
What is Open Interest?
Open interest (OI) is the total number of active contracts held by traders at any moment. It helps gauge market activity and trends, especially in futures and options trading.
Increasing OI: More money is entering the market, suggesting a bullish trend.
Decreasing O: Indicates a potential end to the current price trend.
What is Volume?
Volume measures the number of contracts traded in a day. It shows how many transactions occurred, regardless of whether they were new or existing contracts.
Key Difference: Open interest counts active contracts, while volume counts contracts traded.
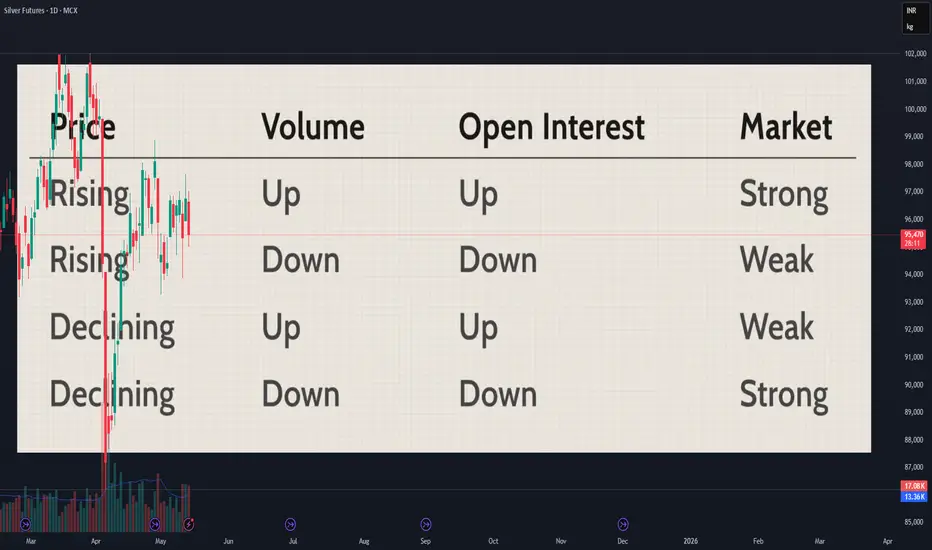
What is Price Action?
Price action tracks how a security's price moves over time, indicating trends.
Market Strength: If prices rise with increasing volume and OI, the market is strong.
Market Weakness: If prices rise but volume and OI fall, the market may be weak.
How is Open Interest Calculated?
For example, if Trader A buys 1 contract from Trader B, OI increases by 1. If Trader C buys 2 contracts from Trader D, OI rises by 2, totaling 3. If Trader A closes their position, OI decreases unless a new trader opens a position.
Analyzing Open Interest Data:
1. Rising OI + Rising Prices: Bullish market with active buyers.
2. Rising Prices + Falling O: Money may be leaving, indicating a bear market.
3. High OI + Falling Prices: Potential panic selling as buyers lose money.
4. Falling Prices + Decreasing OI: Sellers under pressure, suggesting a negative outlook.
Understanding these concepts helps traders make smarter decisions in the market.
The “Pain Threshold” Concept & Why It Ruins Traders!Hello Traders!
Ever felt that unbearable urge to close a trade just because you "can’t take it anymore"? That’s your Pain Threshold kicking in—a psychological limit where traders make emotional, irrational, and costly mistakes. Understanding and managing this concept is key to long-term trading success. Let’s dive into why the Pain Threshold ruins traders and how to overcome it!
1. What is the "Pain Threshold" in Trading?
The Pain Threshold is the moment when traders can no longer tolerate a trade’s loss or drawdown, leading them to exit prematurely, overtrade, or revenge trade.
It’s a psychological trigger that causes traders to abandon rational decision-making, leading to impulsive actions that damage their account.
This emotional breaking point happens because of fear, over-leverage, poor risk management, or simply a lack of discipline.
2. How the Pain Threshold Destroys Your Trading?
Cutting Winning Trades Too Early: Traders exit profitable trades too soon, fearing that the market will reverse.
Holding Losing Trades Too Long: Instead of cutting losses, traders hope for a reversal, leading to massive drawdowns.
Overtrading & Revenge Trading: After a painful loss, traders jump into new trades emotionally, without proper setups.
Ignoring Trading Plans & Strategies: Traders abandon their pre-planned stop-loss and target levels because emotions take over.
Blowing Up Accounts: When pain crosses a threshold, traders make reckless decisions, like doubling down on bad trades.
3. How to Overcome the Pain Threshold & Trade Like a Pro?
Accept That Drawdowns Are Normal: Losses happen even to the best traders— treat them as part of the game.
Use Proper Position Sizing: If a loss feels unbearable, your lot size is too big. Reduce risk per trade.
Predefine Your Risk Before Entering Trades: Set a fixed stop-loss and take profit —and stick to it!
Detach Emotionally from Your Trades: Don’t get emotionally attached to any single trade—focus on the long game.
Develop a Systematic Approach: Follow a trading plan based on data, not emotions.
Take Breaks When Needed: If emotions are high, step away— the market isn’t going anywhere!
4. The Secret: Raise Your Pain Threshold Like Pro Traders!
Trade Small Until You Build Confidence: Reduce risk until you’re mentally comfortable holding trades longer.
Use a Trading Journal to Track Emotional Mistakes: Review past trades to understand when emotions affected your decisions.
Practice Holding Trades According to Your Plan: The longer you stay disciplined, the stronger your pain tolerance becomes.
Accept That the Market is Unpredictable: No one wins every trade— focus on consistency, not perfection.
Conclusion
The Pain Threshold is the silent killer of trading accounts, forcing traders into emotional decisions that ruin profitability. Instead of falling into the trap of fear and impulse reactions, train yourself to handle market fluctuations with a rational, disciplined approach.
Have you ever closed a trade too early or held onto a bad one for too long? Let’s discuss below!
