Open Interest Analysis1. What is Open Interest?
Open Interest refers to the total number of outstanding or open contracts (futures or options) that currently exist in the market. These contracts have not been squared off, exercised, or expired. Unlike volume— which counts total traded contracts for a given session—OI tells you how many active contracts remain open at the end of the trading day.
You can think of OI as the number of "open commitments" between buyers and sellers.
If two parties create a new contract, OI increases by 1.
If they exit or square off, OI decreases by 1.
If contracts are transferred between traders (one enters, one exits), OI remains the same.
This makes OI a direct indicator of market participation and trader conviction.
2. Difference Between Volume and Open Interest
Aspect Volume Open Interest (OI)
Measures Number of contracts traded in a day Total active contracts still open
Reset Reset daily Carry forward until expiry
Shows Activity level for that session Market participation and trend strength
Use Short-term momentum Trend confirmation and sentiment
Both volume and OI together provide a powerful market outlook.
3. How Open Interest is Created and Destroyed
OI Increases When:
A new buyer and a new seller enter the market.
New long and short positions are created.
OI Decreases When:
A buyer and seller close their existing positions.
Squaring off reduces outstanding contracts.
OI Remains Unchanged When:
One trader exits and another takes over the position.
Understanding these mechanics helps traders interpret market signals accurately.
4. Interpreting Open Interest with Price Action
The true power of OI comes when you combine it with price movement. OI alone is not actionable—its interpretation depends heavily on price behavior.
Below are the four essential combinations used in OI analysis:
A. Price Up + OI Up → Fresh Long Build-up (Bullish)
This means traders are entering new long (buy) positions. It shows confidence in upward momentum.
Interpretation:
Strong bullish trend
Buyers aggressively participating
Trend likely to continue
Used for: Swing trades, trend-following trades, and breakout confirmation.
B. Price Down + OI Up → Fresh Short Build-up (Bearish)
When the price falls and OI increases, it signals new short positions being created.
Interpretation:
Strong bearish sentiment
Traders expect further price decline
Downtrend gaining strength
Used for: Short selling strategies, bearish breakouts, continuation trades.
C. Price Up + OI Down → Short Covering (Bullish but Temporary)
As shorts exit their positions, OI declines, leading to a temporary upward price move.
Interpretation:
Rally driven by short covering—not fresh longs
Trend may not sustain
Usually seen before resistance breakouts or reversals
Used for: Intraday trades, profit booking zones, cautious buying.
D. Price Down + OI Down → Long Liquidation (Bearish but Temporary)
Longs square off their positions, reducing OI and causing price to fall.
Interpretation:
Weakness in bullish sentiment
Not necessarily aggressive bearishness
Might lead to consolidation or reversal
Used for: Stop-loss resets, exit signals for long positions.
5. Open Interest in Options Trading
Options (Calls and Puts) provide even deeper insights into market psychology.
Key Concepts:
Call OI shows resistance zones.
Put OI shows support zones.
Change in OI shows if traders are adding or unwinding positions.
A. High Call OI → Resistance Zone
Large Call OI means sellers are confident that price will not exceed that level.
Example: Bank Nifty 48000 CE highest OI = strong resistance.
B. High Put OI → Support Zone
Put writers believe price will not fall below this level.
Example: Nifty 21500 PE highest OI = strong support.
C. PCR (Put–Call Ratio)
PCR = Total Put OI / Total Call OI
This helps measure market sentiment.
PCR > 1 → Bullish (more Put writing)
PCR < 1 → Bearish (more Call writing)
Extreme readings indicate reversals
6. Open Interest and Market Structure
OI acts as a backbone for understanding the structure of trends.
1. In a Strong Uptrend:
Price makes higher highs
OI increasing
More long positions accumulating
2. In a Strong Downtrend:
Price making lower lows
OI rising steadily
Shorts dominating
3. During Consolidation:
Price range-bound
OI rises (indicating buildup for breakout)
Option writers dominate (call & put both increase)
4. During Reversal Signals:
Price moves opposite of OI direction
Divergences form
Indicates weakening trend
7. Open Interest in Futures
For futures traders, OI helps identify:
Trend strength
Reversal chances
Institutional participation
Liquidity zones
Breakout reliability
Futures OI Build-up Types:
Long Build-up
Short Build-up
Long Unwinding
Short Covering
Each type gives a specific trading opportunity.
8. How Institutions Use Open Interest
Smart money (FIIs, prop desks, institutions) uses OI to:
Hedge large portfolios
Accumulate positions silently
Trap retail traders in false breakouts
Control liquidity and volatility
Institutions track OI changes to understand where retail traders are vulnerable.
Example:
If huge Call writing appears before a breakout, it may be a trap to absorb liquidity before moving higher.
9. Open Interest as a Risk Management Tool
OI not only helps predict trends but also helps manage risk:
Avoids trading in low OI contracts (illiquid)
Helps identify expiry-week volatility
Shows where stop-hunts may happen
Indicates where option sellers are positioned
High OI zones act as magnets for price due to hedging flows.
10. How to Use OI for Better Trading Decisions
Step-by-Step Approach:
Look at price trend (up/down/sideways).
Check OI change (increasing/decreasing).
Identify build-up type (long/short/unwinding/covering).
Mark support and resistance using option OI.
Check PCR for sentiment direction.
Use volume + OI + price for confirmation.
Place trades near OI cluster levels for best risk–reward.
11. Limitations of OI Analysis
While OI is powerful, it has limitations:
Does not show whether buyers or sellers are stronger
Can give false signals during low liquidity
Options OI can create misleading levels before expiry
Sudden changes may be due to hedge adjustments, not trend
News-driven markets can invalidate OI-based setups
Therefore, combine OI with price action, volume, and market structure.
12. Conclusion
Open Interest analysis is an essential tool for understanding the psychology and commitment of market participants. By combining OI with price and volume, traders can identify trend strength, potential reversals, support and resistance zones, and institutional activity. Whether analyzing futures or options, OI serves as a reliable indicator for planning trades with precision. While it has limitations, when used with proper risk management and complementary tools, OI analysis significantly enhances trading accuracy and confidence.
Tradingrange
Thematic Trading Strategies1. What Is Thematic Trading?
Thematic trading is an approach that identifies and invests in powerful macro trends (“themes”) rather than individual stocks in isolation. These themes may include:
Artificial intelligence and automation
Clean energy and sustainability
Electric vehicles (EVs)
Digital transformation
Cybersecurity
Space exploration
Biotechnology advancements
Shifting demographics (aging populations, rising middle class)
Geopolitical realignments
Consumption trends (premiumisation, digital retail)
Instead of selecting stocks purely based on historical performance, thematic traders focus on where the world is heading, and then choose assets that are positioned to benefit from that direction.
2. Why Thematic Trading Is Growing Rapidly
Several structural reasons explain its rising popularity:
a) Long-Term Visibility
Mega trends like renewable energy adoption or AI penetration unfold over decades, providing a clearer long-term direction compared to cyclical sectors.
b) Innovation-Driven Growth
Technological disruptions create exponential opportunities. Companies aligned with these innovations often deliver outsized returns.
c) Investors Want Purpose-Driven Portfolios
Thematic portfolios allow investors to align their investments with personal beliefs—such as sustainability, robotics, or healthcare advancement.
d) Easier Access Through ETFs & Basket Products
Dozens of thematic ETFs now offer exposure to specific trends, making participation easier.
3. Core Elements of a Thematic Trading Strategy
To build a strong thematic strategy, traders analyze three dimensions: the trend, the beneficiaries, and the timing.
a) Identifying the Theme
A strong theme usually has:
Long-term structural drivers
Global policy support (like green energy subsidies)
Strong demand-side and supply-side catalysts
Early or mid-stage development (not fully priced in)
b) Theme Validation
For validation, traders study:
Growth forecasts
Industry adoption rates
Scientific or technological feasibility
Capital inflows into the sector
Market size expansion
Regulatory environment
c) Mapping the Value Chain
Once the theme is established, traders look at the value chain:
For example, in Electric Vehicles:
Battery manufacturers
Lithium/cobalt miners
EV OEMs
Charging infrastructure providers
Software and sensor companies
Understanding the value chain helps discover early movers and high-growth segments.
d) Selecting Instruments
Thematic trading can be executed using:
Individual stocks
ETFs & sector baskets
Index futures
Options (for leverage & hedging)
Commodity plays related to the theme
Global stocks or ADRs
4. Types of Thematic Trading Strategies
**1. Technological Themes
These are the most widely followed themes today, due to rapid digital transformation.
Key examples:
Artificial Intelligence
Machine Learning & Automation
Robotics
Cybersecurity
Cloud computing
FinTech & digital payments
Why attractive?
Tech themes offer exponential growth potential as adoption scales globally.
2. Sustainability & Clean Energy Themes
Driven by global climate commitments and government incentives:
Solar and wind energy
Hydrogen fuel economy
Electric vehicles
Waste management & recycling
Water purification
Green metals (lithium, copper, nickel)
Why attractive?
Clean energy is expected to dominate global energy transition, providing decades of investment opportunity.
3. Healthcare & Biotechnology Themes
These include:
mRNA technology
Genomics & DNA sequencing
Precision medicine
AI-driven medical diagnostics
Senior care & aging population industries
Why attractive?
Healthcare demand grows steadily with demographic shifts and breakthroughs.
4. Demographic Themes
These focus on changes in population structures:
Rising middle class in Asia
Aging populations in Japan, Europe
Urbanization in developing economies
Millennial and Gen Z consumption patterns
Why attractive?
Demographic shifts drive predictable long-term market behavior.
5. Geopolitical & Macro Themes
These arise due to global realignments:
Defence and aerospace sector uptrend
Commodity supercycles
Reshoring of manufacturing
Supply-chain diversification
Currency realignments
Why attractive?
These themes often have strong policy and budgetary backing.
6. Consumer Behavior Themes
Based on changing lifestyles:
Digital commerce boom
Subscription economy
Luxury consumption growth
Health & wellness industry
Travel and experiential spending
Why attractive?
Consumer preferences shape long-lasting corporate winners.
5. How To Build a Thematic Portfolio
A systematic approach ensures risk-managed exposure.
Step 1: Define the Theme
Example: "AI adoption in enterprise workflows"
Step 2: Evaluate Theme Drivers
Corporate AI spending
Cloud migration
Data infrastructure growth
Step 3: Map the Value Chain
Semiconductors
Data centers
Software & AI service providers
Hardware companies
Step 4: Select Stocks or ETFs
Choose leaders + emerging disruptors.
Step 5: Portfolio Allocation
Balance between:
High-growth stocks
Value chain diversification
Geographical spread
Step 6: Risk Management
Stop-loss
Portfolio rebalancing
Diversification across themes
6. Benefits of Thematic Trading
a) High Growth Potential
Themes like AI and clean energy can outperform traditional sectors.
b) Long-Term Visibility
Themes often remain relevant for years, reducing dependency on short-term volatility.
c) Innovation Exposure
Provides access to cutting-edge technologies before mainstream adoption.
d) Easier Diversification
ETFs offer broader exposure with fewer stock-specific risks.
7. Risks in Thematic Trading
a) Overhype Risk
Trends can become overpriced quickly due to speculative demand.
b) Technological Uncertainty
Some innovations fail to reach commercial viability.
c) Regulatory Risks
Government rule changes can impact themes like crypto or clean energy.
d) Concentration Risk
Too much focus on a single theme reduces diversification.
e) Timing Risk
Entering a theme at its peak can lead to long drawdowns.
8. Examples of Popular Thematic Trades
AI Boom (2023–2025)
Benefited:
Chipmakers
Cloud platforms
AI software companies
EV and Battery Metals Surge
Lithium and copper saw explosive demand.
Cybersecurity Uptick
Driven by ransomware growth and global cyber threats.
Green Energy Push
Solar, hydrogen, and EV charging firms gained substantial traction.
9. Best Practices for Thematic Traders
Study multi-year macro reports
Focus on value chain leaders
Avoid hype-driven buying
Diversify across multiple themes
Use ETFs when unsure about specific stocks
Regularly review theme performance
Balance high-risk innovation stocks with stable players
Conclusion
Thematic trading strategies provide a powerful framework for capturing long-term transformative trends shaping global markets. By focusing on structural changes—technological, economic, environmental, or demographic—traders can design portfolios that benefit from multi-year compounding growth. While thematic trading offers enormous potential, it also requires disciplined research, smart diversification, and timing awareness.
When done correctly, thematic trading not only provides strong returns but also aligns investments with the future direction of global progress.

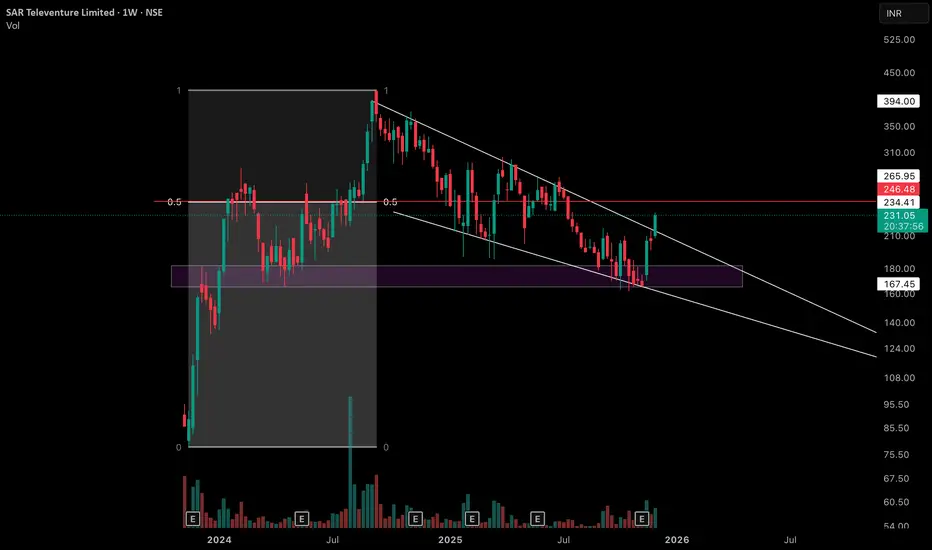
Weekly Equilibrium at Former Supply Zone with 4 observationsObservation 1 - On this weekly chart of SAR Televenture Limited, price has created an interesting equilibrium between the major swing low and the all‑time high swing high, with the 0.5 level highlighted by the red horizontal line as a key mid‑point reference.
Observation 2 - The purple zone marked on the chart was earlier a clear supply / resistance area but has now flipped into a support zone, getting respected multiple times over the past several weeks.
Observation 3 - After printing its all‑time high, price has moved into a sequence of lower highs and lower lows, but each leg has remained relatively controlled instead of showing any one‑sided, sharp liquidation move. This creates a broader consolidation structure where volatility is present yet contained.
Observation 4 - The white lines on the chart represent the upper and lower rejection boundaries of this consolidation channel, and most of the recent candles are developing within these two lines.
Disclaimer: This post is purely for educational and informational purposes, intended to study price structure and market behavior on the weekly timeframe. It is not investment advice or a recommendation to buy or sell any security; traders and investors should do their own research and consult a registered financial professional before making any decisions.
Part 11 Trading Master ClassIron Condor – Best for Sideways Markets
Perfect for low-volatility environments where price stays in a range.
How it works
You create:
A bull put spread (below market)
A bear call spread (above market)
You earn net premium from both sides.
When to use
Markets are consolidating.
You expect low volatility and no big moves.
Risk and reward
Risk: Limited, predefined.
Reward: Limited to net premium collected.
Example
Nifty trading at 22,000
Sell 21,800 PE – Buy 21,700 PE
Sell 22,200 CE – Buy 22,300 CE
You collect total premium and profit if Nifty stays between 21,800–22,200.

How Derivatives Hedge RiskWhat Are Derivatives?
A derivative is a financial contract whose value is based on an underlying asset such as:
Stocks
Bonds
Indices
Commodities (oil, gold, wheat, etc.)
Currencies
Interest rates
Crypto assets
Common types of derivatives used for hedging include:
Futures
Options
Forwards
Swaps
Each of these tools functions differently, but all help manage risk.
Why Hedging Matters
Risk in financial markets comes from many sources:
Price volatility
Uncertain interest rates
Currency fluctuation
Commodity cost changes
Market crashes
Global geopolitical shocks
Weather-driven agricultural risks
Economic cycles
If a company or investor does nothing about these uncertainties, they are exposed to losses that could have been prevented. Hedging creates a protective barrier.
For example:
An airline fears rising crude oil prices.
An exporter fears the Indian rupee becoming stronger against the dollar.
A stock investor fears a market correction.
A manufacturer fears steel input cost rising.
All these risks can be hedged using derivatives.
How Derivatives Hedge Risk — The Core Logic
Hedging works on one simple principle:
A loss in the cash market should be offset by a gain in the derivative market.
The purpose is not to generate extra profit but to protect against loss.
Let’s understand this with the major derivative types.
1. Futures Contracts – Locking Prices for Certainty
A future is an exchange-traded contract that locks an asset price today for a future date.
How futures hedge risk:
If you fear that the price of an asset will move against you, you take an opposite position in futures.
Example – Hedging against rising prices
A wheat processor fears wheat prices may rise.
He buys wheat futures today.
If spot prices rise later:
He pays more in the physical market.
But his futures position makes a profit.
The profit offsets the extra cost—risk hedged.
Example – Hedging against falling prices
A farmer fears wheat prices may fall.
He sells wheat futures today.
If spot prices drop:
He gets less money for selling wheat physically.
But he gains on the short futures.
Again, loss in one place is covered by gain in the other.
Futures are powerful hedging tools for:
Commodity producers
Commodity consumers
Stockholders
Index investors
Currency-dependent businesses
Interest-rate-sensitive institutions
They bring price certainty and remove uncertainty.
2. Options – Insurance Against Adverse Movements
An option is a contract that gives the buyer the right—but not the obligation—to buy or sell an asset at a fixed price.
There are two types:
Call option – Right to buy
Put option – Right to sell
Options are the best hedging tool because they provide protection while allowing participation in favourable moves.
Hedging with Put Options (Downside Protection)
Buying a put is similar to buying insurance.
A stock investor buys a put option at a strike price.
If the stock falls heavily:
Loss in the stock is offset by gain in the put option.
If the stock rises:
He loses only the premium, but still enjoys the upside.
This is called a protective put.
Hedging with Call Options (Upside Protection for Short Sellers)
If someone has sold a stock or commodity and fears that prices may rise, they buy a call option as insurance.
If prices rise:
The call increases in value.
Loss in the short position is reduced or offset.
Why options are preferred for hedging:
You control risk with limited premium.
You keep unlimited favourable movement.
They work like financial insurance policies.
3. Forward Contracts – Customized Hedging
A forward contract is like a future but traded privately (OTC), not on an exchange.
They are customized based on:
Quantity
Price
Duration
Delivery terms
Hedging With Forwards – Example
An Indian exporter expecting $1 million in three months fears the USD/INR rate might fall.
He enters into a forward contract with a bank to sell $1 million at a fixed rate.
If the dollar weakens:
He gets less money in the market.
But the forward contract guarantees a fixed rate.
Thus the business avoids currency risk.
Forwards are widely used by:
Exporters and importers
Banks
Large corporations
Commodity producers
They hedge exchange rate risk, interest rate risk, or commodity price risk.
4. Swaps – Exchanging Cash Flows to Reduce Risk
A swap is a contract between two parties to exchange cash flows.
Two common types:
Interest Rate Swaps
Currency Swaps
Interest Rate Swap Example
A company with a floating-rate loan fears rising interest rates.
It enters into a swap to convert the floating rate into a fixed rate.
If market rates rise, the company pays more interest normally,
but gains in the swap compensate the higher payment.
This stabilizes finance costs.
Currency Swap Example
A company with revenue in USD but expenses in INR can exchange currency cash flows using a swap so that currency fluctuations do not hurt the business.
Swaps reduce uncertainty for long-term financial planning.
Real-World Hedging Examples
Airlines and Crude Oil
Airlines hedge oil prices using futures and swaps because fuel cost is uncertain. Hedging ensures predictable expenses.
Farmers and Commodity Prices
Farmers hedge against falling commodity prices using futures and options.
Manufacturing Companies
Steel consumers hedge rising metal prices using futures.
Exporters and Importers
Currency forwards and options reduce FX volatility risk.
Stock Investors
Portfolio managers hedge index risk using index futures or index put options.
Benefits of Hedging with Derivatives
✔ Reduces risk and uncertainty
✔ Protects profit margins
✔ Stabilizes cash flows
✔ Improves planning and budgeting
✔ Protects portfolios from market crashes
✔ Provides insurance-like safety
✔ Allows businesses to focus on operations instead of price fluctuations
Limitations and Risks of Hedging
Hedging has costs (like option premium).
Over-hedging can reduce profits.
Mis-using derivatives can increase risk.
Requires knowledge and discipline.
Mark-to-market losses can occur, even if final protection holds.
But despite costs, hedging is essential for long-term stability.
Conclusion
Derivatives are powerful tools for managing and reducing financial risk. By taking an opposite position in futures, options, forwards, or swaps, businesses and investors can ensure that adverse market movements are offset by gains in derivative markets. This transforms unpredictable markets into manageable environments.
Whether it is an airline hedging fuel costs, an exporter hedging currency risk, or an investor protecting a stock portfolio, derivatives act as a financial shield. They do not eliminate uncertainty, but they convert unknowns into planned, controlled outcomes. That is the true power of hedging.
Part 10 Trade Like InstitutionsBear Put Spread – Best for Mild Downtrend with Controlled Risk
Same concept but for bearish conditions.
How it works
Buy a lower strike put.
Sell a farther out-of-the-money put.
When to use
Expect small to moderate fall.
Want low risk and fixed cost.
Risk and reward
Risk: Limited to net debit (premium).
Reward: Limited but predictable.
Example
Buy Bank Nifty 49,000 PE at ₹150
Sell 48,800 PE at ₹70
Net premium = ₹80
Max profit = 200 – 80 = ₹120

Part 8 Trading Master ClassLong Put – Best for Bearish Markets
This is the opposite of a long call.
How it works
You buy a put option.
Profit when price drops below strike.
When to use
You expect a sharp fall.
You want a cheap hedge for your portfolio.
Risk and reward
Risk: Limited to premium paid.
Reward: Large profit as price falls.
Example
You buy 48,000 put on Bank Nifty for ₹80.
If BN falls to 47,500, the option may rise to ₹600.

Part 1 Support and Resistance How Option Trading Works
Option trading can take place on exchanges such as the Chicago Board Options Exchange (CBOE) or through online trading platforms provided by brokers. Traders can take one of two main positions:
Buying Options – This involves paying the premium to acquire the right to buy or sell the underlying asset. Buying options limits the trader’s loss to the premium paid but offers theoretically unlimited profit for calls if the asset price rises, or significant profit potential for puts if the asset price falls.
Selling/Writing Options – This involves receiving the premium in exchange for assuming the obligation to buy or sell the underlying asset if the buyer exercises the option. Writing options can generate steady income through premiums but carries high risk, especially if the market moves unfavorably.

Part 11 Trading Master Class What Are Options?
Options are financial contracts that give the buyer the right, but not the obligation, to buy or sell an underlying asset at a predetermined price (called the strike price) before or on a specific date. Unlike shares, which give ownership, options only provide trading rights.
There are two main types of options:
Call Option – gives the right to buy.
Put Option – gives the right to sell.
The buyer of an option pays a premium, while the seller (or writer) receives the premium and must fulfill the contract if the buyer exercises it.

Explaining the seller trap in XAUUSD/GOLDIt is an explanatory video about how sellers are trapped between market rumours and profit booking phases.
The gold chart is a classic example of this in the current scenario, where everyone is waiting to short Gold and gets trapped in the resulting volume.
Be careful with the trade setups.
I have mentioned the clear range of bullish and bearish continuation.

GIFT Nifty Signals Bullish Start🏛️ What is GIFT Nifty?
Let’s start with the basics.
GIFT Nifty is the new name for what used to be known as the SGX Nifty—a derivative contract that mirrors the Nifty 50, but is traded outside India.
It now runs on the GIFT City platform (Gujarat International Finance Tec-City).
It gives traders, especially foreign institutional investors (FIIs), the ability to trade in Nifty futures even before the Indian market opens.
Think of it as an early indicator of how the Nifty 50 might perform when the Indian market opens at 9:15 am.
✅ Important: GIFT Nifty is NOT a separate index.
It simply reflects the expected movement of the Nifty 50 index, based on global market cues and overnight developments.
🧠 Why Did SGX Nifty Become GIFT Nifty?
Until July 2023, the Nifty futures were traded on the Singapore Exchange (SGX).
But to bring more liquidity and volume back to Indian shores and to establish India as a global financial hub, the trading of Nifty derivatives was moved from Singapore to the GIFT IFSC platform.
Thus, SGX Nifty became GIFT Nifty.
📈 Why GIFT Nifty’s Morning Move Matters
Each morning, traders, analysts, media houses, and even retail investors check GIFT Nifty levels.
Why?
Because it acts as a directional clue. Here’s how:
If GIFT Nifty is up by 100 points, it’s a sign that Nifty 50 is likely to open higher.
If it’s down by 75 points, it hints at a gap-down opening.
It reflects the sentiment of global markets, overnight US cues, geopolitical risks, and FII mood.
📊 Example:
GIFT Nifty trading at 22,450 (up 80 points)
Yesterday’s Nifty close: 22,370
→ Bullish sign → Indian markets may open with a gap-up of 70–100 points.
📌 What Does “Bullish Start” Mean?
A bullish start means the market is expected to open on a positive note—meaning, the index (like Nifty or Sensex) may start the day higher than the previous day’s closing.
This can happen due to:
Strong global cues (e.g., Dow Jones, Nasdaq closing higher)
Positive FII activity
Good earnings announcements
Supportive macroeconomic data
Favorable government or budget policy
Cooling of global tensions or crude oil prices
So, when GIFT Nifty shows a positive movement before 9 am, traders call it a bullish pre-market setup.
🔍 Real-World Example – July 18, 2025
On July 18, 2025:
GIFT Nifty was up by 55 points, indicating a positive start.
This came after a volatile weekly expiry on Thursday.
Strong earnings expected from companies like Reliance, JSW Steel, L&T Finance added to positive sentiment.
US markets closed flat, but no major negative surprise.
FIIs were net sellers, but DIIs absorbed selling pressure.
→ All this combined gave a green signal from GIFT Nifty to the domestic market.
💼 How Traders Use GIFT Nifty in Strategy
✅ 1. Pre-Market Planning
GIFT Nifty gives early clues, so:
Intraday traders plan opening range setups
Option traders adjust straddles/strangles based on expected gap
F&O traders look at overnight position rollover
✅ 2. Risk Management
A weak GIFT Nifty warns of gap-downs due to global negativity.
This allows traders to:
Hedge long positions
Tighten stop-losses
Avoid aggressive morning trades
✅ 3. Sectoral Rotation
If GIFT Nifty is up, focus shifts to high-beta stocks like Bank Nifty, Reliance, Adani Group, etc.
If it's down, defensive plays like FMCG and Pharma may perform better.
🧮 How to Read GIFT Nifty Properly?
Here are 3 simple tips:
✔️ Tip 1: Compare with Previous Day’s Nifty Close
If GIFT Nifty > Last close → Gap-up expected
If GIFT Nifty < Last close → Gap-down likely
✔️ Tip 2: Watch Global Cues
Dow/Nasdaq closing + crude oil + USD/INR = impact GIFT Nifty
If all show strength, GIFT Nifty usually reacts positively
✔️ Tip 3: Use With FII/DII Data
Bullish GIFT Nifty + FII Buying = Strong setup
Bullish GIFT Nifty + FII Selling = Weak opening might reverse later
🌎 GIFT Nifty & Global Linkage
India is now deeply linked with:
US markets (Nasdaq, S&P 500)
Crude oil
Dollar Index
Global interest rate policies (Fed, ECB)
So if:
US markets crash overnight → GIFT Nifty reacts instantly
Crude oil falls sharply → Positive for India → GIFT Nifty turns green
📍 Important: GIFT Nifty Is Not Always Accurate
Sometimes GIFT Nifty shows bullish signs, but:
Domestic news (politics, budget) pulls market down
FII/DII data surprises post-opening
Index gaps up but then reverses during the day
That’s why traders use GIFT Nifty as a clue, not a guarantee
🚦 Final Thoughts – Why You Should Watch GIFT Nifty
GIFT Nifty is like the morning alarm for the market:
It tells you what’s likely to happen before the bell rings.
Gives you a head start to plan your trades.
Helps spot sectoral strength, F&O positioning, and market mood.
EURUSD buy to sell setup?EURUSD has already played out as anticipated in Sunday’s analysis. Price reached the target for shorts and is now retracing from the first point of interest — a larger demand zone.
The 4H structure remains bearish, so in line with the trend, I expect price to drop further into the lower interest area around 1.1000. That’s where buyers could start stepping in, adding liquidity to the market.
I’ll be watching for a buy-to-sell setup to position myself accordingly.
Interesting setup overall — let’s see how it plays out.

SRF Update – Trading Near a 3-Year Range Watch for breakout📌 Cheat Entry: ₹2704
📌 Entry: ₹2864 (ATH Level)
📌 Stop Loss: ₹2259.8 (Closing Basis, -16.6%)
📌 Target 1: ₹3386 (+25%, R:R 1:1.5 from Cheat Entry)
📌 Positional Target: ₹3910 (+44.6%, R:R 1:2.7 from Cheat Entry)
💡 How to Trade:
1️⃣ Test Quantities: Add small quantities above the Cheat Entry (₹2704).
2️⃣ Full Entry: Add the rest above the ATH breakout level (₹2864).
3️⃣ Look for a clean breakout with a wide-range candle supported by strong volumes.
⚠️ Position Sizing Tip:
The market remains weak. Trade only 10% of your usual position size.
Example: If you usually buy 100 stocks, buy 3 above Cheat Entry and the rest above ₹2864 (ATH breakout).
✅ Why Trade This Setup:
🏷️ Stock has been in a range since Oct 2021 and is now trading below its ATH.
📈 Once the ATH is broken, no resistance remains, setting the stage for a potential Stage 2 breakout.
🚀 Stock gapped up on Jan 9, 2025, with volumes 7x-8x higher than previous sessions—a potential breakaway gap.
🔑 Trading above key DMAs, showing resilience in a falling market.
⚠️ Risks to Watch:
Nifty 50 & Overall Market: The structure remains Lower-High, Lower-Low (LL-LH). Any bounce could be just a natural pullback within this structure.
If Nifty or the broader market falls further, the probability of failure increases significantly.
Until Nifty & broader market close above 200 DMA & 50 DMA, and change the structure to HH-HL, the risks are amplified.
Probability: 2 out of 3 trades may fail in such conditions.
💡 Pro Tip: Trade small quantities unless you’re skilled at managing risk. Missing a rally is better than burning your capital.
📜 Disclaimer:
This analysis is shared for educational purposes only and does not constitute financial advice or a recommendation to buy or sell securities. Please consult with a certified financial advisor and consider your risk tolerance before making any trading or investment decisions.
🔍 Final Thoughts:
📊 This trade aligns with the potential for a major breakout, but it’s crucial to manage risk and position sizing carefully. Make decisions based on your risk appetite and always do your due diligence.

Vedanta Ltd view for Intraday 17th Dec #VEDL
Vedanta Ltd view for Intraday 17th Dec #VEDL
Resistance 523-524 Watching above 525 for upside movement...
Support area 505 Below 518 ignoring upside momentum for intraday
Support 505 Watching below 505 or downside movement...
Resistance area 523-524
Above 510 ignoring downside move for intraday
Charts for Educational purposes only.
Please follow strict stop loss and risk reward if you follow the level.
Thanks,

2 Good swing trading ideas for 26 July marketsI make educational content videos for swing / positional trading

Gold falls mainly for XAU to riseWorld gold prices plummeted as the USD continued to demonstrate its strength compared to most other currencies in the world
In the long term, the upward trend in gold prices remains unchanged. However, in the short term, precious metals continue to be under selling pressure due to a strong USD and the rather cautious monetary policy of the US Federal Reserve (Fed).
The personal consumption expenditures (PCE) price index is awaited on Friday

UPL - Trading RangeUPL is ready to break above the trading range.
UPL has corrected approximately 50% and now near bottom forming a strong base indicating that bulls have accumulated and ready to go higher

Consolidation in Siyaram Silk.Falling Wedge Breakout in Siyaram Silk on Normal Volumes. It's been consolidating since last Two Years on Broader Timeframe. Hopefully it will Break the Range.

Trading in Small trading rangeBreakout candidate , one its breakout from the trading range, we can see sharp upmove.

Crypto Total Market Cap Update- The market is back above 1.5t$
- The structure looks solid and the range has been broken too
- I think we can surely see more infusion in the market very soon.
- BTC and all other alts can easily double triple or quadruple your whole Portfolio

BTC's Future TrajectoryHey there, fellow crypto enthusiasts! 🚀
What's the scoop on BTC? Well, let's dive into the cryptocurrency rabbit hole and share my five cents on the matter, as illustrated on the chart.
A Remarkable Year 🚀
The year 2021 witnessed the culmination of a robust uptrend in this pair. When I refer to a robust trend, I mean an astounding increase of 1,500% or more, with the majority of this surge occurring within the span of a single year.
The Onset of a Significant Shift 🔰
BTC reached a peak in 2021, only to be followed by a reversal. As evident in the chart, within just 3months, from the end of 2021 to the beginning of 2022, it shed approximately half (50%) of its gains from the highs.
The Deceptive Rally 👀
When an asset experiences such a substantial decline over a short period, it often gives rise to relief rallies. These rallies can be quite potent and may even appear as bull markets on shorter timeframes. BTC rebounded by almost 45% from the lows it hit in January 2022, and a significant portion of this increase occurred within just 15 days. However, at the end of March 2022, there was a false breakout from a range, and the trend reversed once again.
Second Plunge 🔰
This time, BTC tumbled by over 60% from the highs it reached in the March 2022 rally. The fall's momentum was even more pronounced, taking only 2.5 months to reach this 60% decline. This added up to a total loss of 75% from the 2021 highs. Notably, BTC was testing and holding the 2017 highs during this period. As you might recall, resistance, once breached, can often act as support in the future. However, it was not apparent at that time that the pain was far from over.
Another Deceptive Rally 👀
Following the second decline, there was a three-month-long relief rally, amounting to roughly 44% from the recent lows recorded in June 2022. Unfortunately, this rally was nothing more than a bear market rally and the fall continued.
The Final Leg: Positive Clues ✅
The last downward move on the chart saw a decline of no less than 39% from the highs of the second relief rally. However, there were notable changes in behavior that can be observed in the chart:
1. The amplitude of the downward move was comparatively smaller than in the previous two declines.
2. The downthrust- distance between lows decreased.
3. The retest, as seen on the chart, failed (taken out) this time, unlike the two previous retests.
4. Breakout of a falling wedge can be seen, which typically signifies a bullish reversal.
5. All of these developments were occurring in the vicinity of the 2017 highs.
A Structural Shift ⚡
The chart reflects a shift in structure following the wedge breakout, with higher highs and higher lows emerging. This type of structural change is generally considered bullish.
Bullish Outlook for the Future 💰
Assuming that the low has been established, the aforementioned alterations in behavior suggest the possibility of another bull market.
Presently, BTC appears to be within a rough range of 25,000 to 31,000. However, the chance of a shakeout at the lower end (around 24,750) cannot be ruled out. A failed breakdown of this level and then an upward reversal should be seen as a buying opportunity.
Alternatively, if BTC continues its trajectory without a shakeout, a definitive breakout above 31,500, followed by a successful retest, should also be interpreted as a buying opportunity. This scenario may lead to 46K or highs in the long run.
Bearish Scenario 🐻
On the contrary, a decisive break down below 24,700 may pave the way for a drop to 19,650 or even lower.
Everything up there is for educational purpose only so,
✌🏻 PEACE OUT and keep those chain vibes strong! 💪
And if you've enjoyed this crypto convo, don't forget to give that "boost" button a virtual high-five! 👍 Keep your crypto radar active by hitting the follow button for more brain-boosting posts and intriguing ideas. 🔔
Your visit's much appreciated, and I am here to learn together in the fascinating world of Bitcoin and beyond. 🙏 Stay crypto-cool! 😎

ACCACC fut broke out of 5 trading sessions range with decent OI on an hourly chart as well trading well above VWAP.
Could be bought with mentioned stoploss & target.
Not to be missed breakout.

CIPLA go longGo long if CIPLA if cross 1268.90
then take
Entry : 1268.95
Stop loss : 1210.95
Target: 1382.75
Take position with less QUANTITY because it's at high and risk is high
