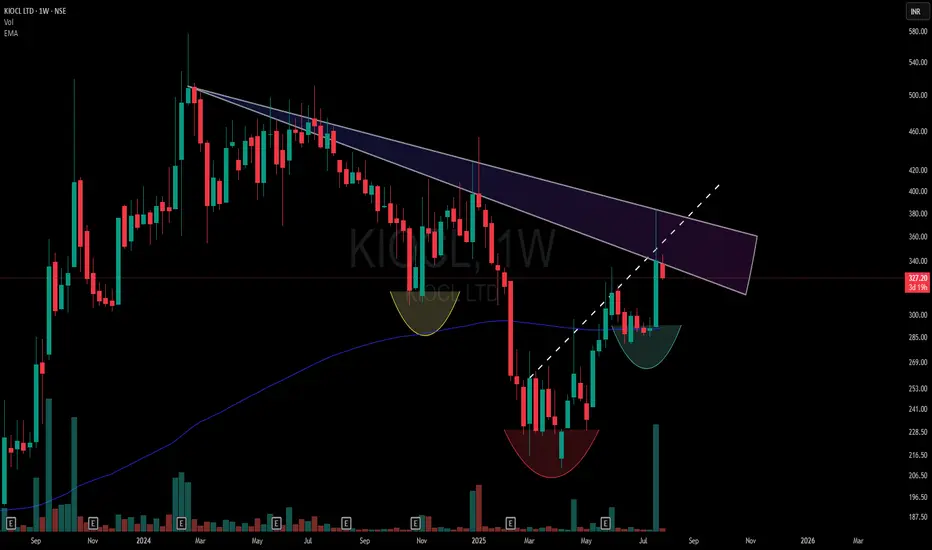
Dual Counter-Trend Zone and Market Structure Shift- This chart highlights a dual counter-trend resistance zone formed by two overlapping CT trendlines (marked in the shaded purple region).
🟡 Yellow Cup – Marks the origin base of the structure (assumed starting shift).
🔴 Red Cup – Establishes a Lower Low Base, still within bearish control.
🟢 Green Cup – Forms a Higher Low Base, showing a market structure change supported by a noticeable volume surge.
- The dotted trendline drawn through the zone acts as a hidden resistance confluence
⚠️ Disclaimer:
This post is non-forecasting in nature. It is not a buy/sell recommendation or financial advice. The chart is shared purely for educational and structural analysis purposes.
Tradingstrategies
Learn Advanced Institutional Trading🏛️ Learn Advanced Institutional Trading
Step into the world of professional-level trading and master how institutions control the markets.
This advanced level dives deep into:
Market Structure Mastery – Spot trends, breakouts & manipulation zones
Smart Money Tactics – Learn how big players accumulate & distribute silently
Volume & Liquidity Zones – Trade where institutions trade
Precision-Based Entries – No noise, just logic
Risk Management Systems – Protect capital like a pro
Avoid Retail Traps – Outsmart fakeouts, stop hunts & emotional trades
Whether you're trading options, futures, or intraday levels—this training gives you the edge to follow the real money and make consistent, calculated moves.
📌 Upgrade your strategy. Trade with purpose. Win like institutions.

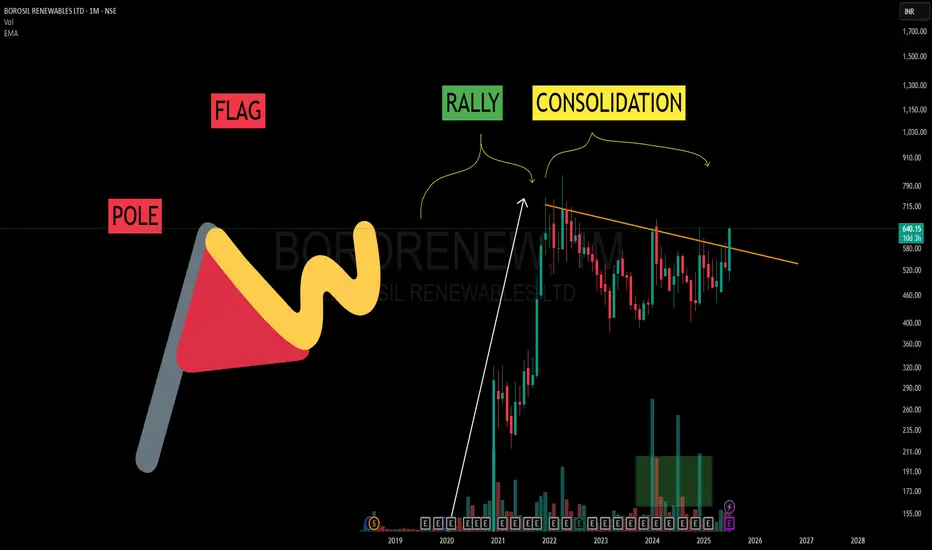
Flag, Pole and Patience– Learning from the Bigger TimeframeIn trading, patterns on higher timeframes often carry deeper meaning.
What you’re seeing in this chart isn’t a forecast — it’s a learning opportunity.
Let’s break this down:
🔺 POLE:
This sharp rally from 2020–2022 represents a strong burst of momentum. That’s your Pole — it shows clean directional intent from market participants.
🏁 FLAG:
After the rally, price didn’t crash — it started consolidating. This sideways or slightly downward structure is known as the Flag.
It often appears as a phase of “cooling off” — traders taking profits, new buyers waiting.
📈 RALLY + CONSOLIDATION = Classic Flag & Pole
A rally followed by consolidation = textbook flag structure.
⏳ And here’s the takeaway:
When viewed on a Monthly (WTF - Way Too Far 😅) timeframe, these patterns take years to form. But that also means they carry weight.
No predictions here. Just learning.
Understanding market rhythm through structure > outcome can be your edge.
Supply to Demand Flip Explained! | Spot High-Probability Zones Ever wondered how smart traders catch the perfect entries? 🤔
In this video, I break down the Supply-Demand Conversion Zones—where Supply turns into Demand and vice versa. With real chart examples .

RTNPOWER – A Classic Price Action Study Around Major Trendlines🟦 Dotted Blue Line
Represents the main counter trendline, stretched over a significant duration. Price has currently pushed above it, but the weekly candle is still open.
⬜ White Line (Hidden CT)
A hidden resistance line, drawn from key lower highs. Price is currently reacting near this line — acting as a logical area where sellers might test control ( for my setups )
🟨 Yellow Zones
These levels highlight higher lows, a sign of evolving structure. These bases often add context to the strength behind a breakout move.
🔴 Red Line (MTF Resistance)
Plotted from historical monthly rejection zones — a crucial area for confluence and reaction.
🛠️ Only sharing my Charting — no recommendations, no forecasting .

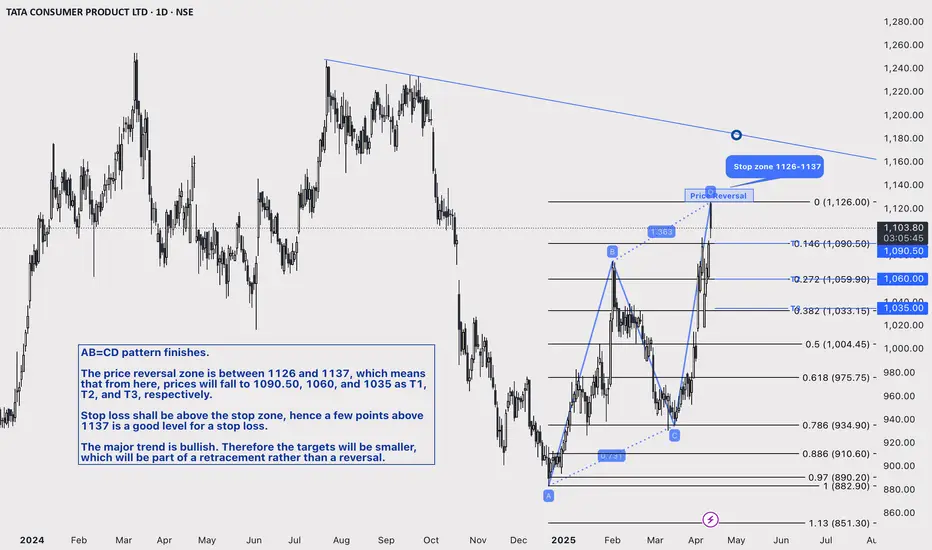
Tataconsumer ABCD pattern: BearishAB=CD pattern finishes.
The price reversal zone is between 1126 and 1137, which means that from here, prices will fall to 1090.50, 1060, and 1035 as T1, T2, and T3, respectively.
Stop loss shall be above the stop zone, hence a few points above 1137 is a good level for a stop loss.
The major trend is bullish. Therefore the targets will be smaller, which will be part of a retracement rather than a reversal.
Market Structure Shift: How to Spot Trend Reversals EarlyHello Traders! Spotting trend reversals early can be a game-changer in trading. A Market Structure Shift (MSS) occurs when price action transitions from an uptrend to a downtrend (or vice versa), giving traders a heads-up before major moves happen. Learning how to identify these shifts early can help you avoid traps and catch high-probability setups. Let’s break it down!
1. What is a Market Structure Shift (MSS)?
A Market Structure Shift (MSS) is when price transitions from a clear trend into a potential reversal.
It usually occurs when the price breaks a key level of support or resistance and fails to continue in the original trend.
MSS is often confirmed when price action starts forming lower highs & lower lows (bearish shift) or higher highs & higher lows (bullish shift).
2. How to Identify a Trend Reversal Early?
Break of Market Structure (BMS): When price breaks a recent swing high (in a downtrend) or a swing low (in an uptrend), it signals a shift in market sentiment.
Liquidity Grab & Stop Hunts: Smart money often pushes price beyond key levels to trigger stop-losses before reversing the trend.
Volume Confirmation: A real market structure shift is supported by increased volume , confirming strong buying or selling interest.
Failure to Make New Highs/Lows: If a trend starts struggling to create fresh highs in an uptrend (or fresh lows in a downtrend ), it indicates a weakening trend.
Moving Average Crossovers: When short-term moving averages (like 9 EMA or 21 EMA) cross below long-term ones (like 50 EMA), it can indicate a structural shift.
Divergence in RSI or MACD: If price makes a higher high , but RSI/MACD makes a lower high , it suggests momentum is weakening , hinting at a potential reversal.
3. How to Trade a Market Structure Shift?
Wait for Confirmation: Don’t enter immediately—wait for price retest or rejection at key levels.
Use Stop-Loss Wisely: Place stop-loss above the previous high (for short trades) or below the previous low (for long trades) to manage risk effectively.
Combine with Other Indicators: MSS is more powerful when used alongside support/resistance, volume analysis, and Fibonacci levels.
Look for Retests: Often, price will retest the broken structure level before continuing in the new trend. This gives a better risk-to-reward entry.
Trade with the New Trend: Once MSS is confirmed , look for pullbacks and enter in the direction of the new trend.
Conclusion
Understanding Market Structure Shifts helps traders stay ahead of trend reversals and avoid getting caught in bad trades. By combining price action, volume, and technical indicators , you can spot reversals early and execute high-probability setups.
Have you ever used market structure shifts in your trading? Let me know in the comments! 👇

How to Identify a True Breakout vs. a False Breakout?
Hello Traders! Identifying breakouts correctly is one of the most crucial skills in trading. A true breakout can lead to strong trending moves, while a false breakout can trap traders and trigger stop-losses. Let’s explore how to differentiate between the two and avoid unnecessary losses!
1. True Breakout: Signs to Look For
High Volume Confirmation – A real breakout is accompanied by a significant increase in trading volume, confirming strong buying or selling pressure.
Clear Support & Resistance Levels – The price must break above a key resistance (bullish) or drop below a strong support (bearish) with conviction.
Retest of the Breakout Level – Many true breakouts retest the breakout level before continuing the trend. This pullback provides a great entry opportunity.
Strong Candlestick Formation – A bullish breakout should have a solid green candle closing above resistance, while a bearish breakout should have a strong red candle closing below support.
Trend Confirmation – If the breakout aligns with the overall market trend, it has a higher probability of succeeding.
2. False Breakout: Warning Signs to Avoid
Low Volume Breakout – If the price moves beyond resistance/support without a surge in volume, it’s likely a false breakout.
Quick Reversal After Breakout – If the price immediately returns inside the range, it indicates weak momentum and a possible trap.
Fakeout Candlestick Patterns – Watch for wicks and long shadows at breakout levels, as they suggest a rejection instead of a real move.
No Follow-Through – A breakout should be followed by sustained price movement in the breakout direction. If the price stalls, it could be a fake move.
Breakout Against the Trend – A breakout that goes against the prevailing market trend is more likely to fail.
3. Pro Tips to Trade Breakouts Successfully
Wait for the Retest – Many traders enter after confirmation from a successful retest of the breakout level.
Use Volume Indicators – Tools like OBV (On-Balance Volume) and Volume Profile help confirm if the breakout is valid.
Set Stop-Loss Wisely – Place stop-losses below the breakout level for long trades and above the level for short trades to avoid whipsaws.
Look for Confluence – If the breakout aligns with moving averages, RSI, or Fibonacci levels, it has a higher probability of success.
Conclusion
A true breakout offers great trading opportunities, but recognizing false breakouts is equally important to avoid traps. Always wait for confirmation, use volume analysis, and stick to your risk management plan.
Have you ever fallen for a false breakout? Share your experiences in the comments below! 🔥👇

Emotions vs. Logic: The Biggest Battle in Trading!Hello Traders!
In today’s post, let’s talk about one of the biggest battles every trader faces— Emotions vs. Logic . As traders, we often struggle between the two: the emotional side that wants to act impulsively and the logical side that urges patience and strategy. Let’s dive into why this battle exists and how to navigate it effectively.
The Role of Emotions in Trading:
Fear: Fear can make you exit a position too early, causing you to miss out on profits, or even worse, not enter a trade at all because you’re scared of losses.
Greed: Greed can make you hold on to a position longer than necessary, hoping for more profit, but ultimately leading to larger losses when the market turns.
Overconfidence: After a few successful trades, overconfidence can make you take larger risks without proper risk management, increasing the chances of significant losses.
The Role of Logic in Trading:
Strategy: Logic allows you to trade based on a well-thought-out strategy , which includes entry and exit points, stop losses, and profit targets.
Discipline: A logical approach requires following the trading plan without getting swayed by temporary market fluctuations.
Risk Management: Logic always keeps risk in check, ensuring that you don't take trades that go beyond your risk tolerance.
Balancing Emotions with Logic:
Understand Your Emotions: The first step is to back off and acknowledge your emotions. Are you acting out of fear, greed, or excitement? Understanding this can prevent you from making impulsive decisions.
Stick to the Plan: Once you have a clear strategy, trust the logic behind it. Emotions will try to cloud your judgment, but discipline and sticking to the plan will keep you on track.
Take Breaks: If you find yourself overwhelmed by emotions, take a break and step away from the screen. Giving yourself space will help you make logical decisions when you return.
Key Takeaways:
Emotions are natural but must be managed to avoid impulsive decisions.
Logic and strategy should guide your trades, ensuring consistency and discipline.
The balance between emotions and logic is the key to becoming a successful trader.
Conclusion:
The battle between emotions and logic is real, but understanding how to manage both is crucial for your trading success. Trust in your strategy, stick to your plan, and manage your emotions effectively to become a more disciplined and successful trader.

Leverage Trading vs. Cash Trading: Understanding Risk and RewardHello Traders!
In today’s post, we’ll explore the difference between Leverage Trading and Cash Trading , and how to understand the Risk vs. Reward dynamics in each. Both methods have their pros and cons, and it's essential to choose wisely depending on your trading goals and risk tolerance. Let’s break down both types:
Leverage Trading:
Leverage allows you to control a larger position with a smaller amount of capital by borrowing funds from a broker. This can amplify your potential profits, but it also increases your risk significantly. With leverage, you can earn higher returns on small price movements, but if the market moves against you, your losses can quickly escalate.
Risk: With leverage, even a small adverse move can lead to significant losses, sometimes more than your initial investment.
Reward: If the market moves in your favor, the potential for higher profits is substantial, as you're controlling a larger position.
Margin Call: If the market moves against your position, you might receive a margin call, requiring you to add more capital to maintain your position.
Cash Trading:
Cash trading, also known as spot trading , involves buying and selling assets using your own capital, without borrowing funds. This method is less risky compared to leverage trading because you’re not exposed to margin calls or the risk of losing more than your investment. However, your potential returns are limited to the capital you have available.
Risk: The risk is limited to your initial investment, and you can never lose more than what you’ve invested in the trade.
Reward: The returns are generally more moderate compared to leverage trading, but this can be a safer and more controlled approach.
Stability: With cash trading, you don’t have to worry about margin calls, making it a more stable and less stressful option for risk-averse traders.
Key Takeaways:
Leverage can offer higher rewards, but it also exposes you to higher risks.
Cash trading is safer, with limited risk, but the profit potential is more modest.
Always assess your risk tolerance and choose the appropriate trading method based on your goals.
Managing risk is critical in both types of trading. Use stop losses and risk management strategies to protect your capital.
Conclusion:
Both leverage trading and cash trading have their unique benefits and drawbacks. If you’re comfortable with higher risk and have a good understanding of the markets, leverage can provide great rewards. But if you prefer a more conservative approach with less risk, cash trading might be the better option. Always trade within your means and manage your risk effectively.

The Falling Wedge Pattern: A Guide to Catching Bullish BreakoutsFalling Wedge Pattern: A Continuation Chart Pattern
Hello Traders!
In today's post, we’ll explore the Falling Wedge Pattern , one of the most reliable continuation patterns that traders look for during uptrends. It’s an important tool for identifying potential breakout points in trending markets. If you want to learn how to trade these breakouts effectively, mastering the Falling Wedge is essential.
The Falling Wedge pattern typically forms during an uptrend and consists of converging trendlines, where the price makes lower highs and lower lows. However, despite the price being pushed lower, the momentum starts weakening, and eventually, the price breaks above the upper trendline, signaling a continuation of the prevailing uptrend .
What is the Falling Wedge Pattern?
The Falling Wedge Pattern is characterized by two converging trendlines, where the upper trendline slopes downward more steeply than the lower trendline. This pattern shows a decreasing range between highs and lows, and when the price breaks above the upper trendline, it indicates a continuation of the uptrend .
Key Characteristics of the Falling Wedge Pattern
Uptrend Prior to the Pattern: The Falling Wedge pattern forms during a strong uptrend , signaling that the market is taking a brief pause before resuming the previous momentum.
Converging Trendlines: The pattern consists of two downward-sloping trendlines that converge, with the upper trendline steeper than the lower one. This shows that the selling pressure is weakening.
Breakout Confirmation: A bullish breakout occurs when the price breaks above the upper trendline, signaling the continuation of the uptrend .
Volume Increase on Breakout: The breakout is confirmed when there is an increase in volume, indicating strong momentum behind the move.
How to Trade the Falling Wedge Pattern?
Entry Point: The ideal entry point is when the price breaks above the upper trendline, confirming the bullish breakout .
Stop Loss: Place your stop loss just below the lower trendline or the most recent swing low to protect your trade from sudden market reversals.
Profit Target: Measure the height of the wedge and project that distance upward from the breakout point to determine the price target .
Risk Management Considerations
Position Sizing: Adjust your position size based on your risk tolerance and the distance between the entry point and the stop loss.
Stop Loss Placement: Make sure to place your stop loss in a way that minimizes risk but still gives enough room for the trade to move in your favor.
Wait for Confirmation: Always wait for the breakout confirmation, and make sure that the price action is supported by an increase in volume.
What This Means for Traders
The Falling Wedge pattern is an excellent tool for traders who are looking for reliable continuation trades in strong uptrends. It can help identify breakout points and offer favorable risk-to-reward setups when combined with other technical indicators.
Look for the Falling Wedge pattern during uptrends to identify high-probability continuation trades.
Confirm with volume to ensure the breakout is backed by strong momentum.
Use stop loss placement to manage risk effectively while targeting favorable risk-to-reward ratios.
Conclusion
The Falling Wedge pattern is a reliable continuation pattern that can help traders identify breakout opportunities in trending markets. By mastering its formation, waiting for the breakout confirmation, and managing risk effectively, you can increase the chances of a successful trade in the uptrend .
Have you traded the Falling Wedge pattern before?
Share your experiences and thoughts in the comments below! Let’s continue learning and growing as traders!

"Analyzing Nifty 50: Support, Resistance, and Trade Insights"Let's take a look at the Nifty 50 chart to analyze current support and resistance levels, and whether it's a good time to consider a bullish trade or if the market might drop further.
Currently, the Nifty 50 is showing a downtrend, forming lower highs and lower lows. This suggests that the market is struggling. However, there is a bottom trend line that supports the index quite well. Despite this, recent heavy selling by Foreign Institutional Investors (FIIs) means we haven’t seen a clear reversal pattern yet. Right now, the market is consolidating near this trend line.
For the Nifty to turn bullish, we would need to see a strong buying moment . We hope the index doesn’t fall below this trend line, but if it does, we could see a drop of several hundred points.
At this point, it might be wise to hold off on making any trades until we have clearer confirmation of market direction. For those considering a bullish position, a sensible stop-loss would be below 22,700 .
Please remember, this is for educational purposes only. Make sure to do your own analysis before making any trades and don't just follow someone else's advice blindly.

Manual Trading vs. Algo Trading: What’s the Future?Hello Traders!
In today’s post, we’ll explore a hot topic in the trading world – Manual Trading vs. Algo Trading , and discuss the pros and cons of each. These two approaches to trading have been gaining popularity, but the question remains: which one is better, and what does the future hold for both?
What is Manual Trading ?
Manual trading is the traditional form of trading where the trader makes all the decisions. This includes identifying entry and exit points , using technical indicators , and analyzing the market to make informed decisions. Traders who use manual trading rely heavily on their experience , emotion , and intuition to decide when to buy or sell.
What is Algo Trading ?
On the other hand, Algo trading uses computer algorithms and pre-programmed instructions to execute trades. It’s based on a set of rules, such as price , volume , and time , to determine when a trade should be placed. This method eliminates human emotion, and trades are executed with precision and speed, often in milliseconds . Algo traders use advanced tools like artificial intelligence (AI) , machine learning , and big data to build smarter trading strategies.
Pros of Manual Trading
Human Element : Manual traders can rely on their intuition, experience, and emotions to make informed decisions. This helps them adjust to market nuances and situations that algorithms may miss.
Flexibility : Manual traders have the ability to make on-the-spot decisions based on changing market conditions.
Emotional Control : Although emotions can be a downside, a skilled manual trader knows how to manage emotions effectively, which allows them to make calculated decisions.
Pros of Algo Trading
Speed and Efficiency : Algo trading can process large amounts of data quickly, making trades in milliseconds. This can be advantageous in fast-moving markets.
Reduced Emotional Bias : Since the algorithm follows strict rules, there’s no emotional interference, making the process more rational and systematic.
Backtesting : With algo trading , traders can backtest strategies against historical data to see how the algorithm would have performed, helping to fine-tune strategies.
24/7 Trading : Algo trading can run continuously, taking advantage of global markets and never missing trading opportunities.
Cons of Manual Trading
Time-Consuming : Manual trading requires a lot of attention and focus, which can be mentally exhausting, especially during volatile markets.
Emotional Impact : Emotions such as fear and greed can affect a trader’s decision-making process, leading to mistakes.
Limited to Available Time : Traders are limited by time and must be physically present to execute trades.
Cons of Algo Trading
Technical Issues : Algorithms can fail or face technical glitches, leading to unexpected losses.
Lack of Adaptability : Algorithms are designed to follow rules, which means they may not adapt well to unexpected market events or major news.
Over-Optimization Risk : Over-optimized strategies may perform well in backtests but can fail in real market conditions.
The Future of Trading
As technology continues to advance, the future of trading will likely see more integration of AI , big data , and machine learning in both manual and algo trading . While algo trading will continue to dominate for its speed, efficiency, and ability to trade large volumes, manual trading still holds value for traders who rely on their judgment, intuition, and ability to adapt to rapidly changing market conditions.
Conclusion: Manual trading and algo trading each have their unique advantages. If you’re someone who enjoys making quick decisions and analyzing the market based on real-time information, manual trading might be your best fit. However, if you prefer speed , automation , and trading without emotional bias, algo trading could be the way to go.
What are your thoughts on Manual Trading vs. Algo Trading ? Share your experience and insights in the comments below! Let’s learn from each other!

Abandoned Baby Pattern: A Powerful Reversal Tool for TradersHello Traders!
Today, let’s dive into the Abandoned Baby Pattern , an exciting and reliable candlestick pattern that can provide powerful reversal signals. Known for its ability to mark trend reversals, this pattern is a must-know for traders looking to enter at the right moment after a trend shift.
What is the Abandoned Baby Pattern?
The Abandoned Baby is a three-candle pattern that signifies a potential trend reversal. It occurs after a strong price move, usually at the end of an uptrend or downtrend. The pattern consists of the following candles:
A strong price movement in the trend direction (either bullish or bearish).
A gap down (for bullish reversal) or gap up (for bearish reversal) candle that opens and closes outside the previous candle’s range, signaling indecision.
A gap in the opposite direction , completing the pattern, and signaling a trend reversal.
Key Characteristics of the Abandoned Baby Pattern
Gap Down or Gap Up: The second candle gaps away from the first one, showing indecision and setting the stage for a reversal.
Trend Reversal: The Abandoned Baby pattern typically indicates that the trend is about to reverse.
Confirmation Candle: The third candle is the confirmation of the reversal, showing the direction of the new trend.
Volume Surge: Look for a spike in volume on the third candle to confirm the reversal.
How to Trade the Abandoned Baby Pattern?
Entry Point: Enter a position once the third candle closes, confirming the reversal direction.
Stop Loss: Place your stop loss just below (for a bullish reversal) or above (for a bearish reversal) the third candle to manage risk.
Profit Targets: Use a risk-to-reward ratio to set your profit targets, or measure the distance from the base to the top of the pattern for a more precise target.
Real-World Application: Nifty 50 Case Study
Looking at the Nifty 50 chart, we can clearly see the Abandoned Baby Pattern signaling a strong trend reversal. After the gap down and the formation of the three candles, the price broke out in the new direction, with clearly marked targets for potential trades.
Risk Management Considerations
Position Sizing: Always adjust your position size according to your risk tolerance and the volatility of the pattern.
Stop Loss Placement: Properly place the stop loss to avoid getting caught in false breakouts.
Patience & Confirmation: Wait for the third candle to close before entering the trade for confirmation of the reversal.
What This Means for Traders
The Abandoned Baby pattern is a great tool for spotting trend reversals. Combining it with other technical analysis tools like volume and support/resistance levels will make it even more effective.
Look for the pattern at the end of a strong trend to increase the probability of a successful reversal.
Confirm with volume for added reliability.
Use stop losses to minimize potential losses while targeting favorable risk-to-reward ratios.
Conclusion
The Abandoned Baby Pattern is a powerful tool for traders, signaling a strong trend reversal. By understanding its structure and how to trade it effectively, you can spot high-probability setups for profitable trades.
Have you traded using the Abandoned Baby pattern?
Share your experiences in the comments below! Let’s learn and grow together as traders.

Option Buying, Selling & Hedging: Key Nifty Strategies
Hey traders! Today, we’re diving into the exciting world of options trading. We’ll compare three key strategies: Option Buying , Option Selling , and Option Hedging . Let’s break them down with a real-time example of Nifty options and understand how each of them works.
Option Buying (Call Option)
Trade Details:
Strike Price: 22950 CE
Expiry Date: 27th February 2025
Premium: 191
Probability of Profit: 33.36%
Maximum Profit: Undefined
Maximum Loss: 14,325 (-99.85%)
Breakeven Point: 23141.0
Payoff Chart Analysis:
When you buy a Call Option , your loss is limited to the premium you paid (14,325).
The profit potential is unlimited if the underlying asset (Nifty) moves significantly higher.
The payoff chart shows a steep upward curve , indicating significant profit if the market goes up, but also highlighting the steep loss if the market doesn’t move in your favor.
Option Selling (Put Option)
Trade Details:
Strike Price: 22950 PE
Expiry Date: 27th February 2025
Premium: 189.6
Probability of Profit: 61.54%
Maximum Profit: 14,220 (7.41%)
Maximum Loss: Undefined
Breakeven Point: 22761.0
Payoff Chart Analysis:
When you sell a Put Option , you receive premium upfront and aim to profit from minimal market movement.
Maximum loss is potentially unlimited if the market falls drastically.
Profit is capped at the premium received (14,220), making it a strategy suited for range-bound markets .
The payoff chart shows a gradual upward slope , with limited profit potential and high risk if the market moves sharply lower.
Option Hedging (Buy and Sell Combination)
Trade Details:
Sell Put Option (22950 PE) at 189.6
Buy Put Option (22850 PE) at 146.65
Net Credit: 3,221 (7.72%)
Maximum Loss: 4,279 (-10.26%)
Breakeven Point: 22908.0
Payoff Chart Analysis:
Option Hedging involves combining option buying and option selling to limit risk while maintaining profit potential.
The maximum loss is capped , which is crucial for managing risk in volatile markets.
This strategy offers moderate profit (3,221) with a relatively higher probability of profit (50.49%).
The risk-to-reward ratio (1:0.75) suggests a more balanced approach than buying or selling options alone.
Real-World Application:
Option Hedging is beneficial when you expect volatility but want to control potential losses by limiting exposure.
Example: Combining a short Put with a long Put to create a bullish or neutral strategy in uncertain market conditions.
Key Comparisons
Profit Potential:
Buying options offers unlimited profit .
Selling options offers limited profit but carries unlimited risk .
Hedging offers a moderate profit with capped loss , balancing risk and reward.
Risk and Loss:
Buying options has a limited loss (premium paid).
Selling options exposes you to unlimited loss .
Hedging reduces risk by capping both profit and loss, offering more control.
Probability of Profit:
Selling options usually has a higher probability of profit due to premium collection .
Buying options typically has a lower probability due to the need for significant market movement.
Hedging strikes a balance, with 50.49% probability of profit .
Break-even Point:
For option buyers , the break-even point is above the strike price, meaning the underlying asset needs to rise substantially for you to profit.
For option sellers , the break-even point is lower than the strike price, meaning the underlying asset can drop slightly before you start losing money.
Hedging combines both, providing a controlled risk environment.
Real-World Application
Option Buying (Call):
Great for when you expect sharp upward moves .
Example: You buy a Call option because you believe the market is going to soar, and you want to capture that upside.
Option Selling (Put):
Ideal for stable or slightly bullish markets .
Example: You sell a Put option because you believe the market will stay the same or rise slightly, and you’re comfortable taking the risk in exchange for the premium.
Option Hedging:
Perfect when you expect volatility but don’t want to take on excessive risk.
Example: You combine a short Put with a long Put to create a bullish or neutral strategy in uncertain market conditions.
Risk Management Considerations
For Option Buying:
Know your maximum loss (the premium you paid) and never risk more than you can afford to lose.
Control your risk by picking options that fit your risk tolerance and market expectations.
For Option Selling:
Ensure you have enough margin to cover potential losses.
Always be aware of the unlimited risk that comes with selling options.
For Hedging:
Balance risk and reward effectively by using both buying and selling strategies.
Helps you minimize the impact of extreme market movements while still being in the game.
Conclusion
All three strategies— Option Buying , Option Selling , and Option Hedging —have their pros and cons. The best one for you depends on your market outlook, risk tolerance, and trading goals.
What strategy do you prefer? Let me know in the comments!

Three Black Crows: How to Spot and Profit from Bearish ReversalsHello Traders!
I hope you’re all doing great! Today, we’ll discuss the Three Black Crows candlestick pattern, one of the most reliable bearish reversal patterns you can find in technical analysis. If you're serious about identifying potential trend reversals, understanding this pattern is essential.
The Three Black Crows is a powerful bearish signal that typically marks the end of an uptrend. It consists of three consecutive long red (or black) candles that close progressively lower, showing strong selling pressure and a shift in momentum. This pattern is particularly effective when it forms at a key resistance level, and it can lead to significant price declines.
What is the Three Black Crows Pattern?
The Three Black Crows candlestick pattern signals the reversal of an uptrend. The pattern forms when:
The first candle is a large red candle, closing near the low of the day.
The second candle opens below the first one and closes lower.
The third candle opens lower than the second one and closes near its low.
Each candle in the sequence is characterized by strong bearish price action, and their alignment suggests that bears are gaining control.
Key Characteristics of the Three Black Crows Pattern
Bearish Trend Reversal: Three long red candles following an uptrend suggest a shift in momentum from buyers to sellers.
Strong Resistance Zone: The pattern is more reliable when it forms near a strong resistance level, where the price has struggled to move past in the past.
Closing at the Low: Each of the three candles closes near their respective lows, showing increasing selling pressure.
Volume Confirmation: Volume should ideally increase with each successive candle, confirming that bears are taking control.
How to Trade the Three Black Crows Pattern
Entry Point: After the formation of the third candle, consider entering a short position once the price breaks the low of the third candle. This confirms the bearish trend.
Stop Loss: Place your stop loss just above the high of the third candle to minimize risk in case of a false breakout.
Profit Target: Measure the distance from the high of the pattern to the low of the third candle. Project this distance downward from the breakout point to estimate your profit target.
Real-World Application: Tata Consultancy Services Case Study
In the chart of Tata Consultancy Services (above), we can see a classic example of the Three Black Crows pattern. The price formed a resistance zone and then saw the three consecutive bearish candles break the support, confirming the bearish trend reversal. The huge fall after the pattern’s confirmation indicates the power of this candlestick formation.
Risk Management Considerations
Position Sizing: Adjust your position size based on your risk tolerance and make sure it fits within your overall portfolio strategy.
Stop Loss Placement: Place your stop loss above the third candle to avoid potential losses from a false breakout.
Confirmation with Volume: Always wait for volume confirmation before entering the trade. Volume should increase as the pattern forms.
What This Means for Traders
The Three Black Crows is an excellent pattern to spot potential trend reversals, especially after an uptrend. This pattern works best when combined with other technical indicators like trendlines, support and resistance, and moving averages to confirm the trend reversal.
Look for the pattern at resistance levels to identify high-probability bearish reversals.
Confirm with volume to increase the reliability of the pattern.
Use proper stop loss placement to manage your risk and ensure a favorable risk-to-reward ratio.
Conclusion
The Three Black Crows candlestick pattern is a reliable bearish reversal signal that can help traders capitalize on price declines. By identifying the pattern correctly, waiting for confirmation, and applying solid risk management strategies, you can improve your trading success.
Have you traded using the Three Black Crows pattern?
Share your experiences in the comments below! Let’s keep learning and growing together!

Michael Steinhardt's Secrets to Macro Trading & Risk ManagementMichael Steinhardt: The Master of Macro Trading and Risk Management
Hello Traders!
Today, we’ll be diving into the trading journey of Michael Steinhardt , one of the most successful hedge fund managers of all time. Known for his macro trading strategies and exceptional risk management , Steinhardt built a fortune by analyzing global economic trends and capitalizing on large-scale opportunities. His ability to predict market movements and his contrarian approach made him a standout in the investment world.
Steinhardt’s philosophy has always been about staying ahead of the market by focusing on big-picture trends while managing risk. He believes in making large-scale bets that align with macroeconomic conditions and using strict risk controls to protect capital.
"The greatest investors know that it’s not just about making money, but managing your risk to ensure the longevity of your wealth."
Let’s explore Steinhardt’s approach to macro trading , risk management , and some of his most successful trades.
Michael Steinhardt’s Key Trading Principles
Focus on Macro Trends :
Steinhardt’s expertise lay in macro trading , where he used global economic and political events to guide his investment decisions. By focusing on major economic forces such as inflation, interest rates, and global conflicts, Steinhardt identified high-probability trades that aligned with long-term market movements.
Risk Management is Key :
For Steinhardt, risk management was always top priority. He made large bets, but always with a clear plan on how to minimize losses. He was never afraid to cut his losses quickly, ensuring that no single trade could threaten his capital.
Contrarian Betting :
Steinhardt often made contrarian bets , going against the prevailing market sentiment when he saw opportunities. This mindset allowed him to capitalize on market inefficiencies , especially when most investors were following trends blindly.
Stay Flexible and Adaptable :
Steinhardt’s ability to adapt to changing market conditions is one of his defining traits. He was never married to a single position and was always open to adjusting his strategy if the market environment shifted.
Large-Scale Opportunities :
Steinhardt focused on high-impact trades . Whether it was currency movements, commodities, or stock indices, he made calculated decisions that aligned with his macro view of the world .
How Michael Steinhardt Made His Fortune
Steinhardt’s hedge fund, Steinhardt Partners , was founded in 1967, and over the years, it became one of the most profitable investment firms in the world. His unique approach to macro trading allowed him to make massive gains during some of the most volatile periods in history, including the 1970s oil crisis and the 1987 stock market crash .
His contrarian strategies also led him to big profits in the currency markets and commodities during times of global economic unrest.
Risk Management and Flexibility
Steinhardt was well known for his aggressive risk management strategy . He used techniques like hedging and diversifying his positions to protect his capital from large market swings. This allowed him to stay in the game during times of market stress and continue making profitable trades.
He also emphasized flexibility . If an investment thesis was proven wrong, he was quick to exit the position and look for new opportunities. Adaptation and quick action became hallmarks of his successful trading approach.
What We Can Learn from Michael Steinhardt’s Trading Philosophy
Michael Steinhardt’s approach to trading is a fantastic lesson in macro analysis , risk management , and flexibility . Here are the key takeaways:
Focus on macro trends to make large-scale, informed trades.
Manage risk effectively to preserve capital and protect against unforeseen market shifts.
Don’t be afraid to go against the crowd when your analysis tells you a different story.
Adapt to changing market conditions and avoid sticking to rigid strategies that no longer align with the market environment.
Conclusion
Michael Steinhardt’s legacy as one of the greatest hedge fund managers comes down to his macro trading expertise , his strict risk management , and his adaptable mindset . He was able to navigate volatile markets by using his deep understanding of global trends and staying true to his analysis.
What’s your take on Michael Steinhardt’s approach to macro trading?
Let’s discuss in the comments below. Happy trading, and keep learning from the best!

Mastering the Flag Chart Pattern for Profitable BreakoutsFlag Chart Pattern: A Key to Successful Breakouts
Hello Traders!
I hope you’re all doing well! Today, we’ll be taking a deep dive into the Flag Chart Pattern . This continuation pattern is a favorite for traders looking for a strong trend to follow. If you want to spot reliable breakouts, the Flag pattern is something you’ll want to master. It can help you ride strong trends and get in at the right moment after a brief consolidation.
What is the Flag Pattern?
The Flag Chart Pattern forms after a sharp price movement (the Flagpole ), followed by a brief consolidation period. The consolidation forms a rectangular or parallelogram shape, which is the Flag . Once the price breaks out of this consolidation, it often continues in the same direction as the initial Flagpole .
In other words, the Flag Pattern signals that the market is taking a quick breather before continuing its strong momentum in the same direction.
Key Characteristics of the Flag Pattern
Flag Pole : The initial sharp price movement (either upward or downward), showing strong momentum.
Flag : The consolidation phase that follows the pole, typically characterized by parallel trendlines, forming a rectangular or parallelogram shape.
Breakout : The price breaks above (for a bullish pattern) or below (for a bearish pattern) the flag's upper or lower boundary, confirming the continuation of the trend.
Volume Confirmation : Volume usually decreases during the consolidation (flag) phase, followed by a surge in volume at the breakout, which confirms the strength of the move.
How to Trade the Flag Pattern Like a Pro
Entry Point : The best time to enter is after the price breaks above the flag’s upper boundary (for bullish setups).
Stop Loss : Place your stop loss just below the flag’s lower boundary or the most recent swing low, to minimize risk.
Profit Target : For setting targets, measure the height of the flagpole and project that distance from the breakout point to set your profit target.
Real-World Application: Dixon Technologies Case Study
Looking at the Dixon Technologies chart, we can see a clear Flag Chart Pattern forming. After a sharp price increase (the flagpole ), the stock consolidated, creating the flag . Once the price broke out above the flag’s upper trendline, the price continued to rise, confirming the continuation of the uptrend. The expected target can be calculated using the flagpole’s height, projecting it from the breakout point.
Conclusion
The Flag Chart Pattern is one of the most reliable continuation patterns in technical analysis. By recognizing the flagpole , waiting for the breakout, and managing your risk effectively, you can increase the chances of a successful trade.
Have you traded using the Flag pattern?
Share your experiences in the comments below! Let’s learn together and keep improving our trading strategies!

Options Trading vs. Stock Trading: Which is Right for You?Hello Traders!
In today’s post, we’re going to compare Options Trading vs. Stock Trading. Both strategies can be profitable, but they come with different risk profiles, time commitments, and potential for returns. Let’s dive into the key differences and help you decide which trading method aligns with your financial goals and risk tolerance.
Stock Trading: The Classic Approach
Stock trading is the act of buying and selling stocks to capitalize on price movements. As an investor, you own a share of the company and benefit from its growth or dividends over time. Stock trading is widely recognized as the foundation of the market and remains one of the most common forms of trading.
Key Characteristics of Stock Trading:
Long-Term Investment Strategy: Stock traders tend to hold their positions for a longer duration, from weeks to years.
Ownership of the Asset: When you buy stocks, you own a part of the company, which may yield dividends or appreciate over time.
Moderate Risk and Return: Stock trading typically provides consistent, moderate returns , but the risks are lower compared to options.
Requires Patience: Stock trading is ideal for those who are patient and willing to hold onto their investments through market fluctuations.
Options Trading: Leverage and Flexibility
Options trading involves buying or selling options contracts, which give you the right (but not the obligation) to buy or sell an underlying asset at a predetermined price within a specified time frame. It offers greater leverage, meaning you can control more stock with less capital. However, this leverage comes with higher risk.
Key Characteristics of Options Trading:
Leverage Potential: Options allow you to control larger positions with a smaller initial investment.
Time Sensitivity: Options have expiration dates, which means the price movement must happen within a limited time frame.
Higher Risk, Higher Reward: With leverage, options can yield higher profits, but the potential for loss is also greater, especially when options expire worthless.
Flexibility in Strategy: Options offer a range of strategies, including covered calls, straddles, and spreads , that can help manage risk and maximize profit.
Active Management Required: Options traders need to monitor their positions frequently due to the time-sensitive nature of the trades.
Which Is Better? Stock Trading or Options Trading?
Both strategies have their advantages depending on your goals and trading style. Here’s a comparison:
Stock Trading:
Ideal for Long-Term Investors: Stock trading is suitable for traders looking for steady returns over time with relatively low risk.
Less Complexity: Stock trading is simpler and easier to understand compared to options, making it more accessible for beginners.
Lower Risk per Trade: The risk is limited to the amount invested in the stock, and the price movement is easier to predict.
Options Trading:
Higher Potential Returns in a Shorter Time Frame: Options provide the ability to profit from short-term price movements with higher leverage , leading to potentially higher returns.
Requires Skill and Active Management: Options require more expertise and constant monitoring to manage risk and maximize returns.
Higher Risk, Higher Reward: While the potential for returns is greater, options trading involves a higher level of risk, and you could lose your entire investment.
Conclusion: Which is Right for You?
Choosing between options trading and stock trading depends on your personal trading goals, risk tolerance, and time availability.
Stock trading is ideal if you want to take a long-term approach, avoid complexity, and hold your positions for steady, moderate growth.
Options trading is for those who want to utilize leverage for potentially higher returns and are willing to actively manage their trades.
What’s your trading preference?
Are you more inclined towards stock trading or options trading ? Let me know your thoughts in the comments below!

Scalping vs. Swing Trading: Which One is Better for You?Hello Traders!
Today’s topic is one that often sparks debate in the trading community: Scalping vs. Swing Trading. Both strategies have their unique strengths and challenges, and the choice between them largely depends on your trading style, time availability, and risk tolerance. Let’s break down the key differences to help you decide which approach may be better suited for you!
Scalping: The Fast-Paced Trading Strategy
Scalping is a trading strategy that focuses on making small profits from small price movements throughout the day. Traders who engage in scalping, also known as scalpers , typically execute multiple trades in a short period, often holding positions for just a few minutes or even seconds.
Key Characteristics of Scalping:
Short Holding Period: Scalpers hold positions for seconds to minutes, looking to capitalize on small price fluctuations.
High Frequency of Trades: A scalper executes many trades in a day, potentially dozens or hundreds, depending on market conditions.
Low Profit per Trade: While scalping, the profit per trade is small, but the cumulative returns can be substantial if executed consistently.
Requires Fast Decision-Making: Scalpers need to make quick decisions, as they operate in fast-moving markets.
Low Time Commitment per Trade: The time spent on each individual trade is short, but scalping requires constant attention to the markets throughout the trading session.
Swing Trading: The Mid-Term Strategy
Swing trading involves holding positions for a few days to weeks to capture larger price movements. Swing traders aim to take advantage of market “swings” or trends, rather than focusing on small fluctuations like scalpers.
Key Characteristics of Swing Trading:
Medium Holding Period: Positions are typically held for a few days or weeks to capitalize on medium-term price swings.
Fewer Trades per Day: Swing traders typically make fewer trades compared to scalpers, often only executing trades a few times per week.
Larger Profit per Trade: While the profit per trade is larger, swing traders can also face greater risk as positions are held for longer periods.
Trend-Following Approach: Swing traders often look to trade in the direction of the prevailing trend, using technical indicators to identify potential entries and exits.
More Time Between Trades: Swing traders don’t need to monitor the markets constantly like scalpers; they can afford to check their positions less frequently.
Which One is Better?
There is no clear-cut answer to which strategy is better—it depends on your personal preferences, lifestyle, and risk tolerance. Let’s compare them:
Scalping
Best for Active Traders: If you enjoy being constantly engaged with the market and have the time to dedicate to making quick decisions, scalping might be ideal for you .
Requires Quick Reflexes and a High Level of Focus: Scalping can be intense, as you need to react quickly to price movements.
Lower Risk per Trade, But High Frequency of Trades: While the risk per trade is small, the frequent trades can accumulate fees or slippage that impact overall profitability.
Swing Trading
Best for Less Active Traders: Swing trading is ideal if you don’t have time for constant monitoring but still want to take advantage of market movements.
Better for Those Who Can Handle Larger Price Moves: Swing traders need to be more patient and prepared for larger price swings.
More Time Between Trades, More Time for Analysis: Swing traders can dedicate more time to research and analysis before entering positions.
Conclusion:
Ultimately, scalping and swing trading are two effective strategies with their own strengths and weaknesses. Scalping suits fast-paced traders who thrive on constant action, while swing trading is better for those looking for a more relaxed, mid-term approach . Your choice should depend on your trading personality, time commitment, and comfort with risk.
What’s your preferred strategy? Scalping or Swing Trading?
Let me know your thoughts in the comments below! Happy trading!

Mastering the Double Bottom Pattern for Trend Reversal Trading!Understanding the Double Bottom Pattern: A Key to Trend Reversal
Hello Traders! Today, let’s dive into the Double Bottom Chart Pattern , a classic technical pattern that signals a potential reversal in a downtrend. The double bottom is considered one of the most reliable patterns for identifying trend reversals, especially in the context of bullish market movements .
This pattern is typically found when the price forms two consecutive lows , each close to the same level, with a peak (or “neckline”) in between. Once the price breaks above the neckline, it indicates a potential long entry point.
Identifying the Double Bottom Pattern
Formation: Recognized by two consecutive lows, the Double Bottom forms when the price hits a support level, bounces up, and then returns to retest the same low before reversing higher.
Neckline Breakout: The pattern is confirmed when the price breaks above the “neckline” (the resistance level formed between the two bottoms). This breakout is typically followed by a sharp upward movement.
Volume Confirmation: Volume typically increases during the breakout, confirming the pattern and signaling strong momentum.
Support Zone: The area between the two bottoms, where the price repeatedly tests support, is a key area for setting stop losses and defining your risk management.
Trading Strategy: Double Bottom Pattern
Entry Point: Consider entering a long position once the price breaks above the neckline, confirming a trend reversal.
Stop Loss: Place your stop loss just below the second bottom to minimize risk if the price retraces.
Profit Targets: Measure the distance from the bottom to the neckline and project that distance upwards from the breakout point to determine your potential target.
Real-World Application: Lumax Industries Case Study
Looking at the chart of Lumax Industries , we can see a perfect example of the Double Bottom Pattern from 2008-2010. After the price tested the support zone twice, it broke above the neckline, confirming the reversal and setting the stage for strong upward momentum. This would have been an excellent entry point for traders who understood the power of this chart pattern.
Risk Management Considerations
Position Sizing: Adjust your position size according to the risk involved in trading this pattern.
Stop Loss Placement: The stop loss should be placed below the second bottom to protect against potential false breakouts.
Patience & Confirmation: Wait for confirmation of the breakout, and ensure volume is increasing as the price breaks through the neckline.
What This Means for Traders
By mastering the Double Bottom Pattern , traders can confidently enter trend reversals and capitalize on the subsequent price movement.
Look for the pattern in downtrending markets to identify potential opportunities for reversal.
Use volume as confirmation to validate the breakout and avoid false signals.
Be disciplined with stop losses to manage risk while allowing for maximum reward.
Outcome:
The Double Bottom Pattern is a powerful tool for identifying trend reversals, and when used correctly, it can provide high-probability trade setups with excellent risk-to-reward ratios. By understanding its formation and applying proper risk management, traders can enhance their trading strategies and improve their overall performance.
What’s your experience with the Double Bottom pattern?
Have you used this pattern in your trading? How did it work for you? Share your thoughts in the comments below!

Bull Market vs. Bear Market: How to Trade Both Successfully!Bull Market vs. Bear Market: How to Trade Both Successfully!
Hello everyone! I hope you're all doing great in life and in your trading journey. Today, I bring an educational post on Bull Market vs. Bear Market —two crucial phases that every trader and investor must understand. Whether the market is rising or falling, having a strategy for both conditions is essential for success. Let’s break down the key differences, trading strategies, and opportunities in each market!
Bull Market vs. Bear Market: Key Differences
Market Direction:
Bull Market → A period when stock prices rise consistently , reflecting strong economic growth and investor confidence. Demand is higher than supply, pushing stock prices upward.
Bear Market → A period when stock prices fall continuously , usually due to economic downturns, high inflation, or external shocks. Fear dominates, and investors pull money out of the markets.
Trader & Investor Sentiment:
Bull Market → Optimism is high, and traders are willing to take more risks . Investors have a buy-and-hold mentality , expecting further gains.
Bear Market → Pessimism dominates, leading to panic selling . Investors focus on preserving capital instead of taking risks.
Risk & Reward:
Bull Market → Higher rewards , as most stocks trend upward. Corrections are usually short-lived, allowing traders to capitalize on price increases.
Bear Market → Higher risk , as market volatility increases. Stocks tend to fall sharply, leading to heavy losses for uninformed traders .
Strategy & Approach:
Bull Market Trading → Traders focus on momentum stocks, breakouts, and uptrend confirmations .
Bear Market Trading → Traders look for short-selling opportunities, hedging strategies, and defensive stocks .
Opportunities in Each Market:
Bull Market → Growth stocks, tech stocks, IPOs, and high-risk assets thrive in bull markets.
Bear Market → Defensive sectors like FMCG, Pharma, Gold, and Bonds perform well.
How to Trade in a Bull Market?
✔ Follow the Trend: Buy on dips near support levels and stay in the trade until the trend reverses.
✔ Use Momentum Indicators: RSI, MACD, and Moving Averages help in identifying strong uptrends and overbought conditions.
✔ Focus on Growth Stocks: Tech stocks, finance, and emerging market stocks tend to perform well in a bull market.
✔ Avoid Shorting the Market: Short trades have lower success rates in strong uptrends. Stick with trend-following strategies .
✔ Stay Invested Longer: A long-term buy-and-hold strategy is beneficial in bull markets as prices continue rising.
How to Trade in a Bear Market?
✔ Short-Selling Opportunities: Stocks with weak fundamentals fall harder during a bear market, creating opportunities for short trades.
✔ Look for Safe-Haven Assets: Gold, government bonds, and defensive stocks (FMCG, healthcare) tend to hold value.
✔ Use Stop-Loss & Position Sizing: Volatility increases in bear markets, making risk management crucial.
✔ Hedge Your Portfolio: Options strategies like put options, covered calls, and inverse ETFs can help protect investments.
✔ Wait for Signs of Reversal: Don't rush into trades—look for market bottom confirmations using volume, RSI divergence, and trendline breaks .
Outcome:
Both Bull and Bear Markets present profitable opportunities, but having the right strategy for each condition is key to success.
Which market do you find easier to trade— Bull or Bear? Let me know in the comments!

Steve Cohen’s Secret: How He Built a Billion-Dollar Hedge Fund!Steve Cohen: The Hedge Fund Titan Who Mastered Short-Term Trading
Hello everyone! I hope you're all doing great in life and in your trading journey. Today, I bring an educational post on Steve Cohen , one of the most successful hedge fund managers in history. Known for his aggressive short-term trading strategies, deep market insights, and risk management skills , Cohen turned his hedge fund SAC Capital into a multi-billion-dollar powerhouse.
Cohen’s trading style is fast, data-driven, and highly disciplined , making him one of the best traders of all time. His ability to adapt to market changes and identify high-probability trades has allowed him to consistently outperform others.
Steve Cohen’s Key Trading Principles
Trade with an Edge: Cohen believes that traders should only take trades when they have a clear advantage in terms of price action, volume, or market sentiment.
Short-Term Momentum Matters: Unlike long-term investors, Cohen focuses on high-probability, short-term moves , capturing quick gains.
Risk Management is Everything: He strictly controls losses by using well-placed stop losses and adjusting position sizes based on volatility.
Stay Adaptable: Cohen’s hedge fund traders constantly adjust their strategies based on market conditions , proving that flexibility is key to success.
Focus on Liquidity: He prefers highly liquid stocks that allow large positions to be entered and exited efficiently.
Psychology is Key: Cohen understands that emotions impact decision-making and teaches traders to remain objective and data-driven.
Steve Cohen’s Iconic Trades & Investments
✔ SAC Capital’s Aggressive Trading Approach: Cohen’s hedge fund executed hundreds of trades daily , focusing on market inefficiencies.
✔ Major Holdings in Tech Stocks: He has consistently invested in high-growth tech companies, capitalizing on market trends.
✔ Adaptation to Algorithmic Trading: Over time, Cohen has integrated quantitative models and AI-driven strategies into his trading.
What This Means for Traders:
By following Cohen’s approach, traders can learn to focus on short-term momentum, manage risk effectively, and develop adaptability in changing markets .
Outcome:
Applying these lessons can help traders think like professionals, react faster to market movements, and make data-driven decisions .
What’s your biggest takeaway from Steve Cohen’s legendary trading career ? Share your thoughts in the comments!
