MRPL Triangle BreakoutMRPL has given a Breakout after forming a Triangle Pattern on 1D timeframe with very high volumes. The stock is also trading above its 200EMA.
Traingle

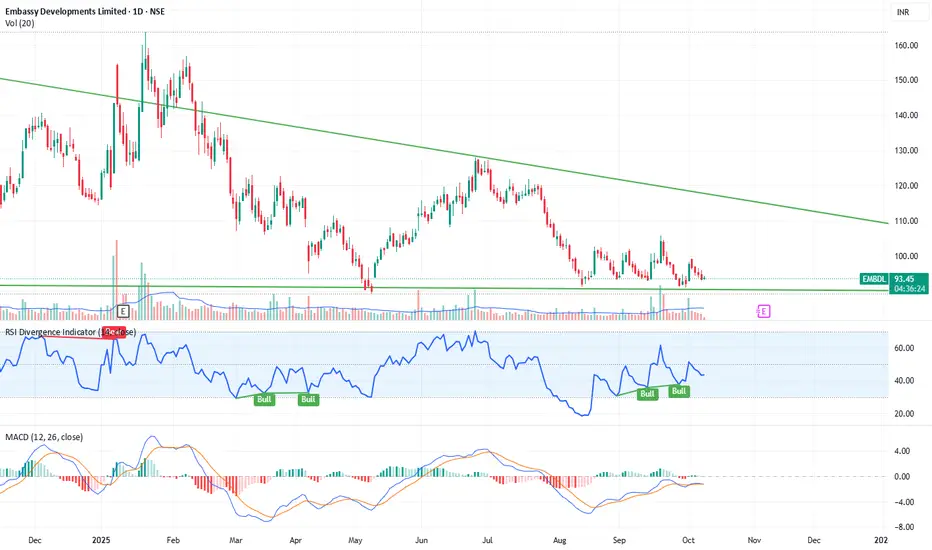
Embassy Developments Stock Analysis: Bullish Reversal in Sight? This chart of Embassy Developments Limited (EMBDL) showcases a potential shift in momentum, signaling a bullish reversal from its recent downtrend. Here's a closer look at the technical indicators:
Trend Analysis:
The stock is testing a support level around ₹93.50, which has held in the past, suggesting potential for a bullish bounce.
The price is currently near a descending resistance line, showing that the stock is facing pressure but also indicating a potential breakout opportunity once it clears this resistance.
RSI (Relative Strength Index):
The RSI has been oscillating between the 40 and 60 mark, reflecting periods of overbought and oversold conditions.
Recently, the RSI has moved towards bullish territory, indicating growing buying interest. The last signals (green “Bull” labels) show positive momentum, which could suggest the start of an upward move.
MACD (Moving Average Convergence Divergence):
The MACD indicator is showing signs of bullish crossover, with the MACD line (orange) crossing above the signal line (blue), suggesting potential upward momentum in the near future.
The histogram also indicates that the bullish momentum is increasing, further confirming a possible trend reversal.
Key Points to Watch:
Support Zone: The stock is approaching a critical support level near ₹93.50. A bounce from this level could indicate a bullish trend continuation.
Breakout Opportunity: The price is testing the downward resistance trendline. A breakout above this level could trigger a strong upward move towards previous resistance levels around ₹110-115.
RSI & MACD Confirmation: The indicators show growing bullish momentum. A continued increase in RSI above 50 and a sustained positive MACD could confirm a bullish shift in the stock's direction.
Conclusion for Study :
This chart offers an example of how to analyze a stock’s price action, momentum, and trend through RSI, MACD, and support/resistance levels. Understanding how these indicators interact can help in forming strategies for potential entry or exit points in real-time trading scenarios.
This analysis is purely for educational purposes and should be viewed as a study of the stock's technicals.
Eris Lifesciences Ltd: Symmetrical Triangle FormationEris Lifesciences Ltd . is currently exhibiting a Symmetrical Triangle Pattern on its daily chart. This pattern is characterized by converging trendlines formed by lower highs and higher lows, indicating a period of consolidation. While symmetrical triangles often serve as continuation patterns, they can also signal potential reversals, depending on the breakout direction.
The pattern's apex is approaching, suggesting that a breakout—either upward or downward—is imminent. It's crucial to monitor the breakout closely, as the direction will determine the subsequent trading strategy.
📉 RSI Analysis: Indicating Sideways Momentum
The RSI for Eris Lifesciences is currently below 50, indicating a neutral to bearish momentum. This suggests that the stock is in a sideways trend, with neither bulls nor bears gaining a clear advantage. Such conditions are typical during consolidation phases, reinforcing the current symmetrical triangle pattern.
🕯️ Candlestick Insight: Doji Formation
Recently, multiple doji candlestick with long legs has formed, signaling indecision in the market. A Doji occurs when the opening and closing prices are nearly identical, reflecting a balance between buying and selling pressures. The long wicks indicate that both bulls and bears attempted to take control but failed, leaving the market in a state of equilibrium.
This formation suggests that significant market participants are awaiting a catalyst to drive the next move, making it a critical point to observe for potential breakout confirmation.
🧠 Strategic Outlook: Awaiting Breakout Confirmation
Given the current technical indicators—a symmetrical triangle pattern, neutral RSI, and a doji candlestick—it's prudent to adopt a wait-and-see approach. The next significant move will depend on the breakout direction from the triangle:
Bullish Scenario: A breakout above the upper trendline, accompanied by increased volume and a rising RSI, would suggest a continuation of the uptrend. Bearish Scenario: Conversely, a breakdown below the lower trendline, with declining volume and a falling RSI, would indicate a potential reversal to the downside.
In both scenarios, it's essential to wait for confirmation through volume and momentum indicators before entering a position.
📌 Conclusion
Eris Lifesciences Ltd. is at a pivotal juncture. The formation of a symmetrical triangle, coupled with a neutral RSI and a doji candlestick, points to a period of consolidation. Traders should remain vigilant for a breakout in either direction, using volume and momentum indicators to confirm the move before making trading decisions.
As always, it's advisable to conduct thorough research and consider consulting with a financial advisor before making any investment decisions.

AT&T Inc BREAKOUTAT&T Inc Share has broken its previous pattern after a strong bullish move. It increased by 100% in two years, from 14 to 27, and now it’s breaking out with a big bullish monthly candle. Due to this strong upward momentum over the past few years, the stock might consolidate for a while before moving higher. This means the upward move could take some time or even a year, so we should keep that in mind when swing trading or investing.
The target and stoploss levels depend on each person’s risk appetite. A minimum risk-reward ratio of 1:1 is always good for swing trades. For example, if our target is around 32 or 33, we could set the stoploss below 25, like at 24.5. This would give a risk-reward ratio of approximately 1.77.
This is just an analysis based on the chart pattern. We can't always expect the share to move exactly as we want. That's why we always put a stoploss. Because many different people are trading based on their own thoughts and decisions. So, never feel bad if a share doesn’t move the way you expect. There’s always an opportunity somewhere else to grab.

ONGC: A Triangle, a Setup, and a Launchpad for Wave 5Following the completion of Wave 3 — an impulsive rally from the 205 low — ONGC entered what looks like a classic Wave 4 triangle. The internal structure — labeled A through E — unfolded in a controlled, converging fashion, respecting the triangle boundaries. Wave E recently ended near 241.54, right on top of the 100-day simple moving average, which has acted as dynamic support.
Interestingly, we saw strong volume come in during the rally into Wave D, indicating buying interest. This was followed by a period of low volume and sideways drift during Wave E, which fits the expected behavior for the final leg of a triangle. RSI also cooled off during this period, resetting from overbought levels, and currently hovers just below the 50 mark.
The invalidation for this triangle setup is placed below the Wave C low, around 235.5. A decisive break below this level would nullify the triangle structure and open the door for a deeper, more complex correction. But as long as price respects this zone and begins to push upward with volume, the case for a Wave 5 rally remains strong.
Fibonacci projections place the 100% extension of Wave 1 through 3 near 263.75 and the 1.618 extension near 277.50 — a likely zone for Wave 5 termination. If ONGC can break above the D-wave high with momentum, it may very well be headed toward those levels in the coming weeks.
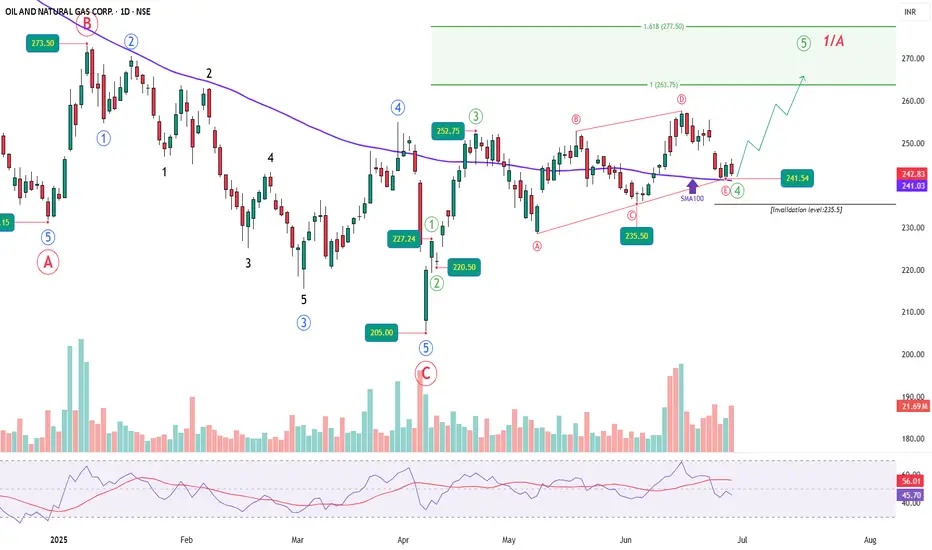
Chart Analysis for Bajaj Finserv Ltd. (Weekly Timeframe)The stock is forming a bullish triangle pattern, a classic continuation pattern signaling potential upside. The price is respecting the ascending trendline, showing strong support near ₹1,700 levels, while the upper resistance line has been tested multiple times. This signifies increasing buyer strength.
Key Levels to Watch:
• Support: ₹1,698
• Resistance (Breakout Level): ₹2,050
• Target Price (Post Breakout): ₹2,336 (derived from the triangle’s height projection).
• Stop Loss: ₹1,515 (below the trendline support).
Short-Term Long Trade Setup
• Entry: Around ₹1,700, once the price shows bullish confirmation (e.g., reversal candlestick patterns or high volume).
• Target: ₹2,050 (short-term) and ₹2,336 (medium-term).
• Stop Loss: ₹1,515 to manage risk effectively.
Market Sentiment:
The stock shows a bullish structure, supported by prior consolidation and breakout potential. Patience is key for confirming a breakout above ₹2,050 before expecting the measured move towards ₹2,336.
DISCLAIMER- Please do your own research before investing in the market. This is for educational purposes only

SOL Eyes 40% Surge: Strong Technical PatternsKey Observations:
1. All-Time High (ATH): Marked at 259.59, indicating a significant resistance level.
2. Bullish Patterns Identified:
• Higher High (HH) and Higher Low (HL) Structure:
• This indicates a bullish market structure where price is making consistent higher highs and higher lows.
• Fair Value Gap (FVG):
• An imbalance or inefficiency in the price that could act as a magnet for price to revisit before continuation.
• Bullish Triangle Pattern:
• Suggests price consolidation within narrowing ranges, typically preceding a breakout to the upside.
3. Support Zone:
• A green box around the 175–180 region shows a strong demand zone where price could reverse upward if retested.
Projection:
• A breakout is expected either towards the resistance zone (near ATH) or lower if the support fails.
Actionable Steps:
• For Bulls:
• Watch for bullish confirmation (e.g., bullish engulfing candles) near the FVG/support zone.
• Target the ATH as the first major resistance, with a potential breakout higher.
• For Bears:
• Monitor price action for a break below 175. This could signal bearish momentum towards lower price targets.
DISCLAIMER- THIS IS FOR EDUCATIONAL PURPOSES ONLY, PLEASE DO YOUR RESEARCH BEFORE INVESTING

SBI ready to fill gap Forming pennant, removed weak hand with a fall and immediate recovery.
New month started with shorting fresh contracts will begin. Put contracts can be shorted and likewise longs can be initiated.
Gap fill expected with further more targets. Bank nifty is also bullish.

LICI Stage 2 continuation breakoutStage 2 continuation buy
Entry above 1090-1110
SL 980
Only for journaling not for the trading.
This post is for my personal use.
Note : only for learning, not a trading recommendation. i am posting as a trading journal before and after breakout.

Happiest mind long setupNvidia leading in USA, likewise indian IT companies will also lead soon. Happiest mind is one among them. Traingle setup with good strong support.

Astral ready to rock n rollInside candle bar trade + Triangle breakout + Weekly Bullish candle
Small trade:
Entry: 1968.80
Target: 2073.40
SL: 1948.50
(Time: 1-2 Week)
Big target: 1968.80
Target: 2290
SL: 1808.50
(1 month)
View for educational purposes

#SbiLife cash : Looks good around 1492-1500#SbiLife cash -Posiitonal call
18.02.2024
Looks good around 1492-1500
Stoploss 1460
Target 1537-1540/1600/1700
Cmp 1508.45 & High 1516.20#S

BALKRISIND | TRIANGLE BREAKOUT | RR 3Disclaimer: This is NOT a recommendation to trade, but my own observation. Please do your own analysis before entering positions.
Reasons to Buy:
__________________________
1. A good breakout with HH, HL formation out of a Triangle pattern.
2. Stock consolidating at higher levels.
3. Lows are being protected in this consolidation.
Entry : CMP
SL : 2513
Target : 3213
RR : 3

RAIL VIKAS NIGAM - Triangle pattern RAIL VIKAS NIGAM - Triangle pattern| CMP: 123.70, SL: 110, Target: 137, 153, 180

Godfrey Phillips Triangle FormationGodfrey is in a Triangle formation and this is the chance to catch this stock on it support. Keep a stop loss at 1620 and expect targets of 2030 when the triangle is broken and the consolidation ends. Expect a very sharp move after breakout.

This is a great consolidation,Good days ahead for syngene?Should see breakout horizontal and symmetrical Traingle with volumes.
Already volume spikes.
SL will be below that horizontal support after breakout.
Keep a tight SL.
Only trade after the Breakout.
Target maybe ATH.
That's around 1:4 RR.

UsoilAlways follow Risk and Position Management❇️❇️
For more information like this follow me in Tradingview @Jagadeesh11616125
Happy trading

Wipro breaks out !After a few bearish days, many stocks broke out fro. found bases wipro breaks out of a superb triangle pattern and looks promising
to go upwards.
it is at its bottom and very good chance for a long term trade or even investment based purely on technical analysis
stop loss below the triangles support
and target1:3!!
Keep It Simple

Britannia traps the BEARS !Britannia has formed a beautiful bear trap and gives a perfect entry opportunity on above average volume taking support from the base of its triangle pattern.
Target can be taken as the height of the triangle.
Stop loss below the bear candle
Psychology behind the bear trap:On the break of the support, many people would short the market in hopes of it falling lower but as buying pressure took control, all these sellers are trapped on the bull side and have to cover their loss and additional buying will contribute to the upward push of price

RateGain Triangle FormationRategain in forming a very very big triangle and is likely to give excellent returns post breakout. The triangle formation is clearly visible in the chart. Trade only on breakout for targets of previous high. Rategain is a big proxy play to the hotel industry and should be kept on radar.


$TOMOBTC$TOMOBTC looking for the doge kind of accumulation brreakout within the end of the year once break the resistance lines which is there for years then its gonna moon shot some serious fireworks expected if btc doesnt spoils the party .Remember the more time price action tests the support / resistance the less strong it becomes and more likely it breaks it.....$TOMOBTC to the mooon?!

WHIRLPOOLWHIRLPOOL is forming a decending triangle and is about to give breakout. Keep it under radar
