short GBPJPY, if came below 155Current market position is very near to all time high of approximately 4-5 year, and forming a M shaped chart pattern, but we have to wait till market closed below 155, because it will reconfirm the downward trend, also RSI will indicate downtrend.
Good trading day.
Trend

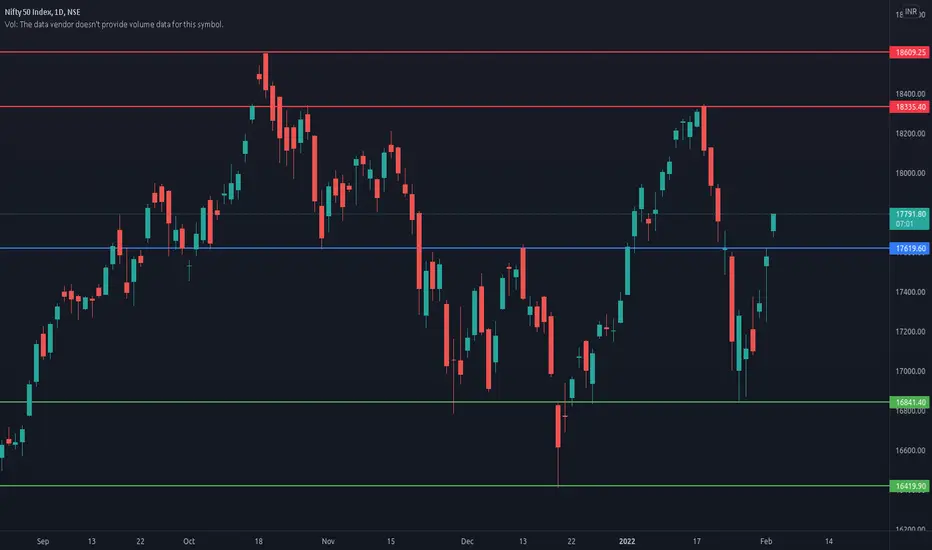
NIFTY -- UNDERSTANDING TREND - 11/02/2022NIFTY What next ? So its small Effort to understand what will be trend likely in next week and this month ..
Daily Chart triangle formation seen nifty trading at 17374 at closing today If you see upside triangle line ..breakout of this line will be upside nifty move towards 17600 and 17800 Level, if nifty fall downside triangle line which is 17100 level ..this work as crucial trend-line support and if this support break then 16800 16500 this level can seen .. 16400 was last support where nifty can bottom out if more fall due to global negative sentiments .
>> RSI SEEN at mid range ..RSI is bellow WMA at present.
** THIS IDEA IS FOR EDUCATIONAL PURPOSE ...!

BANKNIFTY DIRECTION FIGUREBanknifty has been bullish inverse head & shoulder if it can breakout near few days or next week now you can see a continue rally and if should retest on breakout they move on higher high

Long position in NiftyHello Friends
Today Nifty fall as expected yesterday prediction.
Tomorrow we expecting gap up or flat opening, if nifty want to follow trend line channel.
If nifty still break trend line channel, then we go for put option because it indicate sideways or downward trend.
Happy learning and happy trading...


Long position for Nifty 3rd Feb Expiry, important resistanceHello Friends,
Budget day was not going as per our expectations but it's part of our field. so accept it and move on.
Now we expected FII investment from tomorrow onward in Indian market because there are nothing negative in budget for FII's.
Tomorrow may be nifty gives you big moves if FII's increase there investment after analysis budget. DII's continuously increase there investment and they hold market vary well.
Nifty Expected hit 18000 level by 3rd Feb 2022.
Tomorrow 17700 is strong resistance for nifty.
Have a great and safe trading.

itc buyNSE:ITC
its price channel pattern and given breakout with good volume and crossing rsi 60 gives good hope for long
Note: I'm not a Sebi registered guy, Consult ur analyst before investing

NIFTY --TREND REVERSAL DOJINIFTY on Daily Chart trend reversal doji candle seen at todays closing.. Trend reversal doji heikin ashi candle ..found when trend set either bullish or bearish ..and traders indecisive about current trend. last few days nifty corrected around 1000-1200 points from high 18400 now at 17100 bottom was made around 16800 that trend was confirm bearish but last 1-2 session traders are indecisive about trend so volatility seen. that is doji candle formation at support level before trend reversal which is seen in form of heikin ashi doji candle formation on daily chart at todays closing.
this doji candle suggest trend reversal from bearish to bullish ahead may be budget rally is ahead in few days.
wave pattern also indicate same.
NIFTY FROM CURRENT LEVEL 17100 uptrend can see target 18400 short term (1 month).
*** THIS IDEA FOR EDUCATIONAL PURPOSE .!

Nifty Trend Prediction for Budget Day 2022Hi Friends,
This is my first post, I believe you like it.
The probability of long is much higher than short as per chart and world indices, share your views in the comment section.
Have a great trade in the coming week.

Homework from lesson about the tradable patterns - 27-01-22EUR/USD - Monthly
Hi everyone, this content is about what I'm learning from the market and is not investment advice. For study purposes only.
In the lesson we learned about tradable and non-tradable pattern and market structure. This review is for practicing the concepts and learning from my studies over time.
My direction for this pair in long term view based in my analisys: A DOWN MARKET.

[b]Happy Republic Day To All Traders.[/b]
Happy Republic Day To All Traders.
Feel free to share your feedback and queries.
If you want to know about your stock please mention in comment.

niftytarget is small. do u know why?
because trend abi b down.
jaise he pullback hoke upside break deta tab humein confirm hoi jayega ki trend is change. so be patience

magic of wavesthere is possibilities that price may move upside and form zigzag (c) and get all target NSE:HDFCBANK
please write comment and your view

canara bankshort term positional trade.
risk your manage and risk reward ratio. i m looking for buy. s/r mentioneg in video thanks

Breakout in weak marketStock is showing strength and has given breakout in a weak market. Can retest the breakout levels and can be added for positional trading

#EGLD/USDT | 4HR | TREND REVERSALMACD and RSI are showing signs of FALLING WEDGE REVERSAL.
*just an idea do your research before investing.

HINDUSTAN CONSTRUCTION COWait And Watch ??
Look for Low risk, High reward, and High Probability setups-
Things to Remember while Trading with the Trend
1. Know what the trend is.
2. The best trades are made in the direction of the trend.
3. Assume that the main trendline or moving average will hold.
4. The longer the moving average is, the better it defines the trend.
5. Wait for the pullback.
6. Don’t chase the market.
7. Don’t fight the market.
8. Even in the strongest trends there should be some retracement.
9. The closer the market is to the trendline, the better the risk/reward ratio is.
10. Use ADX to determine the strength of the trend.
11. Higher the level of ADX , the stronger the trend, below 20 consider the market to be choppy
12. Hold trades longer in a strong trend.
13. Wait for confirmation of a trendline breaking before reversing position.
14. Know where the Support levels are.
15. Place stops outside the Support levels.
Thank You..

Deccan Cement AnalysisHey there, hope you are doing well.
Here's my analysis, for safe buying only above 661. I will be bullish when any candle sustains above the Green Line.
If it break 606.15 then, more down fall can be expected.
I am not a SEBI advisor, am only a trader.
Hope you like this.
Thank you and stay safe.

BUY hdfc life above 675 !!!!!! Target : 900
stoploss : 650
GO really long after crossing 675
you can invest but be careful and have some advisory !

#Niftybank Intraday Support and Resistance Levels - 13/01/2022This channel provides Nifty and Bank Nifty analysis and provides swing trades for equity.
The channel is also a provider of technical knowledge on technical analysis .
This is merely a recommendation channel, so please do your own analysis as I am not a SEBI registered analyst.
Please support the channel by liking, sharing and subscribing.
Regards
Expiry Jackport... for banknifty
Rising Bull 💯
#risingbull #trader #ashishgendle #india #nse #bse #stock #markets #stockmarkets #trading #investment #nifty #banknifty #bank

HCCWait And Watch ??
Look for Low risk, High reward, and High Probability setups-
Things to Remember while Trading with the Trend
1. Know what the trend is.
2. The best trades are made in the direction of the trend.
3. Assume that the main trendline or moving average will hold.
4. The longer the moving average is, the better it defines the trend.
5. Wait for the pullback.
6. Don’t chase the market.
7. Don’t fight the market.
8. Even in the strongest trends there should be some retracement.
9. The closer the market is to the trendline, the better the risk/reward ratio is.
10. Use ADX to determine the strength of the trend.
11. Higher the level of ADX , the stronger the trend, below 20 consider the market to be choppy
12. Hold trades longer in a strong trend.
13. Wait for confirmation of a trendline breaking before reversing position.
14. Know where the Support levels are.
15. Place stops outside the Support levels.
Thank You..

Double Breakdown | Triangle & Trend line | Dmartseems down sides for dmart from here
break triangle pattern down side also
crossed long rend line from April 2021
