Bitcoin and Major Cryptocurrency Trends1. Bitcoin (BTC) Trends
Price Volatility: Bitcoin remains highly volatile, with rapid short-term swings influenced by macroeconomic events, regulation, and institutional adoption.
Institutional Adoption: Increasing interest from hedge funds, banks, and corporate treasuries drives long-term bullish sentiment.
Store of Value Narrative: Often called “digital gold,” Bitcoin is increasingly seen as a hedge against inflation, especially in uncertain economic periods.
On-chain Activity: Metrics like active addresses, transaction volume, and miner activity influence price trends and market sentiment.
Regulatory Impact: Changes in government regulations, especially in the U.S., Europe, and Asia, significantly affect price movements.
Correlation with Traditional Markets: Bitcoin sometimes moves in correlation with tech stocks and risk-on assets, but also shows periods of decoupling.
2. Ethereum (ETH) Trends
Smart Contract Growth: Ethereum dominates DeFi, NFTs, and dApp development, driving demand for ETH.
Transition to Proof-of-Stake (PoS): Ethereum’s shift from PoW to PoS reduces energy consumption and may improve scalability, impacting price sentiment.
DeFi & Layer-2 Solutions: Ethereum layer-2 networks like Arbitrum and Optimism enhance transaction speed and lower fees, increasing network adoption.
EIP Upgrades: Ethereum Improvement Proposals (EIPs), especially those reducing supply (like EIP-1559), impact ETH scarcity and valuation.
3. Binance Coin (BNB) Trends
Exchange Utility: BNB remains strongly linked to Binance exchange growth, offering discounted trading fees and token burns.
Expansion in Binance Smart Chain (BSC): Growth of BSC ecosystem and DeFi projects boosts BNB demand.
4. Cardano (ADA) Trends
Focus on Scalability & Sustainability: Cardano emphasizes peer-reviewed research and energy-efficient PoS validation.
Smart Contract Ecosystem: Adoption of smart contracts and DeFi projects on Cardano gradually increases network utility.
5. Solana (SOL) Trends
High-Speed Transactions: Solana offers high throughput and low fees, making it attractive for NFTs and DeFi projects.
Network Stability Concerns: Occasional network outages affect confidence but do not entirely diminish adoption.
6. Ripple (XRP) Trends
Banking & Payment Use Case: XRP remains focused on cross-border payments and partnerships with financial institutions.
Regulatory Developments: Legal outcomes, especially in the U.S., heavily influence XRP price and adoption.
7. Stablecoins Trends
USD-Pegged Coins (USDT, USDC): Stablecoins facilitate crypto trading, DeFi lending, and hedging against volatility.
Regulatory Scrutiny: Central banks and governments are increasingly monitoring stablecoin issuance and reserves.
8. General Cryptocurrency Trends
DeFi Expansion: Decentralized finance continues to grow, creating new yield opportunities and borrowing/lending mechanisms.
NFT Market Evolution: NFTs are diversifying beyond art into gaming, music, and real-world asset representation.
Institutional & Retail Interest: Adoption grows across both retail and institutional investors, boosting market liquidity.
Regulatory Focus: Global authorities are increasingly framing cryptocurrency regulation, impacting taxation, exchanges, and investor protection.
Layer-2 & Scaling Solutions: Technologies like Lightning Network (Bitcoin) and Ethereum L2s reduce transaction costs and improve scalability.
AI and Blockchain Integration: Emerging trend where AI analytics and blockchain-based data management intersect, creating innovative investment and utility models.
Trend Analysis

Elliott Wave Analysis XAUUSD – January 29, 2026
1. Momentum
Weekly timeframe (W1)
– Weekly momentum is currently increasing.
– With the present strength on the weekly chart, there is a high probability that the uptrend will continue into next week.
→ Medium- to long-term bias remains bullish.
Daily timeframe (D1)
– Daily momentum is still “compressed” and overlapping.
– This condition shows that bullish pressure is still present and the uptrend remains intact.
H4 timeframe
– H4 momentum is rising but has already entered the overbought zone.
– This signals a high probability that we will soon see a corrective pullback or reversal on H4.
2. Wave Structure
Weekly Wave Structure (W1)
– On the weekly chart, we can clearly see the extension of wave 5.
– This phase represents a transition period driven by crowd psychology.
– Although the long-term trend remains bullish, the main issue at this stage is extreme volatility:
– A single H4 candle can fluctuate 400–500 pips,
– Making real trading execution significantly more difficult.
→ During this phase, observation should be the priority.
– The next major risk comes from the fact that crowd sentiment is becoming extreme.
– When the crowd returns to equilibrium, counter-trend moves tend to be sudden and very aggressive.
– On the other hand, weekly momentum still needs at least another week to reach extreme overbought conditions and potentially reverse.
→ Therefore, the overall bullish trend is still expected to continue.
Daily Wave Structure (D1)
– On the daily chart, the blue 5-wave structure remains valid and continues to unfold.
– The current blue wave 5 is expanding strongly.
– With D1 momentum still compressed, the bullish move may continue,
but at the same time, the risk of a daily momentum reversal is increasing.
H4 Wave Structure
– When price is in an extended wave, one of the main weaknesses of Elliott Wave theory becomes clear:
– Accurate wave labeling is extremely difficult during strong extensions.
→ Therefore, at this stage, H4 wave labeling should be treated as relative and for observation only.
– To refine our bias, we must rely on:
– The depth of price corrections,
– The time spent correcting,
– And the behavior of momentum.
– Observing H4 momentum, the bullish momentum rollover in the overbought zone suggests that the upward move is losing strength.
→ This increases the probability of sideways movement or a corrective decline on H4.
– However, when we look at RSI:
– The current overbought zone is stronger than previous ones,
– This indicates that the bullish force required to form new highs is still present,
– At least until a new high is formed with bearish divergence.
3. Trading Strategy
– Under current conditions, the most appropriate strategy remains:
👉 Wait for momentum reversals on H1 and H4 to BUY in line with the dominant uptrend.
– For now, patience is required while waiting for H4 momentum to return to the oversold zone.
– Once that occurs, we will shift focus to H1 to:
– Identify wave structures,
– Confirm momentum behavior,
– And define suitable price targets for BUY entries.
Why wait for H4 oversold conditions to BUY instead of SELL?
– Because the current uptrend is still very strong.
– Corrective moves at this stage may:
– Move sideways, or
– Decline unpredictably, making downside targets unclear.
→ Selling in this environment carries high uncertainty and elevated risk.
👉 Waiting for H4 to reach oversold conditions allows:
– A clearer trend structure to form on H1,
– And provides opportunities to enter BUY positions aligned with the higher-timeframe trend, with better risk control.

Energy Sector Breakouts: A Comprehensive Analysis1. Definition of Breakouts
Breakout Explained:
A breakout occurs when the price of an energy sector stock or index moves above a defined resistance level or below a defined support level with increased volume.
Types of Breakouts:
Bullish Breakout: Price moves above resistance, signaling potential upward momentum.
Bearish Breakout: Price falls below support, signaling potential downward momentum.
Key Elements:
Resistance and support levels
Trading volume confirmation
Price consolidation preceding the breakout
2. Importance of Energy Sector Breakouts
Market Indicator:
Breakouts indicate a shift in supply-demand dynamics, reflecting investor sentiment in the energy markets.
Profit Potential:
Traders can capitalize on strong momentum after breakouts, particularly in volatile energy stocks.
Risk Management:
Identifying breakouts early allows for setting stop-loss levels and avoiding false moves.
Sector Leadership:
Certain energy stocks often lead sector breakouts, influencing indices like the Nifty Energy Index or S&P Energy Sector ETF (XLE).
3. Technical Analysis of Energy Sector Breakouts
Chart Patterns:
Triangles: Ascending triangles often precede bullish breakouts; descending triangles signal bearish potential.
Head and Shoulders: Breakout below the neckline signals a potential decline.
Flags and Pennants: Continuation patterns often indicate that the breakout will follow the existing trend.
Support and Resistance Levels:
Resistance: Previous highs where selling pressure is strong.
Support: Previous lows where buying pressure appears.
Breakout occurs when price decisively crosses these levels.
Volume Analysis:
High trading volume during a breakout confirms legitimacy.
Low volume breakouts often result in false signals, leading to reversals.
Indicators:
Moving Averages: Crossovers (e.g., 50-day MA crossing above 200-day MA) can reinforce breakout signals.
Relative Strength Index (RSI): Values above 70 can indicate overbought conditions; below 30 indicates oversold, helpful to gauge breakout sustainability.
MACD (Moving Average Convergence Divergence): Bullish or bearish crossovers can complement breakout analysis.
4. Fundamental Drivers of Energy Sector Breakouts
Oil and Gas Prices:
Fluctuations in crude oil and natural gas prices heavily influence energy stocks. Rising prices often trigger bullish breakouts.
Energy Demand and Supply:
Seasonal demand changes (e.g., winter heating, summer cooling) can affect utilities and energy producers.
Geopolitical tensions or supply disruptions (OPEC decisions, sanctions) can spark breakouts.
Policy and Regulation:
Renewable energy incentives, carbon pricing, and subsidies can drive sector valuations and breakout trends.
Deregulation or privatization in power and utilities can lead to bullish momentum.
Corporate Earnings:
Strong quarterly results, production reports, or new project announcements often catalyze breakouts.
5. Market Sentiment and Energy Sector Breakouts
Investor Confidence:
Optimism about economic growth, industrial activity, and energy demand can lead to bullish breakouts.
Fear and Panic Selling:
Bearish breakouts are often driven by negative news, profit warnings, or declining energy prices.
Global Events:
Wars, conflicts, or global policy decisions (like climate agreements) can influence breakout trends.
6. Breakout Strategies for Traders
Entry Points:
Enter near the breakout above resistance or below support after volume confirmation.
Avoid premature entries during consolidation phases.
Stop-Loss Placement:
Place stop-loss just below the breakout point for bullish trades or above for bearish trades.
Helps minimize losses in case of false breakouts.
Target Setting:
Measure the height of the prior consolidation range and project it from the breakout point to estimate potential targets.
Risk Management:
Trade smaller positions in volatile energy stocks.
Combine technical breakout signals with macro and fundamental analysis.
7. Examples of Energy Sector Breakouts
Oil & Gas Companies:
Bullish breakout after crude oil prices surge due to geopolitical tensions.
Bearish breakout during oversupply or production increases.
Renewable Energy:
Stocks break out on government subsidy announcements or major solar/wind project approvals.
Utilities:
Breakouts often occur around regulatory changes, tariff revisions, or quarterly performance updates.
8. Common Challenges in Energy Sector Breakouts
False Breakouts:
Price briefly moves past resistance/support but returns, trapping traders.
Avoid by confirming with volume and technical indicators.
Volatility:
Energy markets are prone to high volatility due to global oil prices, weather events, and geopolitical risks.
News Sensitivity:
Sudden policy changes, sanctions, or natural disasters can invalidate technical setups.
9. Sector-Specific Considerations
Oil & Gas:
Highly correlated with crude oil futures.
Watch OPEC meetings, inventory reports, and geopolitical news.
Renewable Energy:
Sensitive to government policies, subsidies, and technological advancements.
Breakouts often occur with announcements of new projects or partnerships.
Power & Utilities:
Influenced by regulatory frameworks, tariffs, and infrastructure investments.
Breakouts may be slower but more sustainable due to stable demand.
10. Tools and Resources for Identifying Breakouts
Technical Platforms:
TradingView, MetaTrader, and NSE/BSE charting platforms.
Market News Feeds:
Bloomberg, Reuters, and industry-specific news portals.
Government & Policy Reports:
Energy Ministry releases, OPEC reports, renewable energy agencies.
Algorithmic Alerts:
Use automated tools to get breakout alerts based on predefined technical conditions.
11. Conclusion
Energy sector breakouts offer significant trading and investment opportunities, but they require careful analysis.
A successful approach combines technical patterns, volume confirmation, fundamental drivers, and market sentiment.
Traders must be vigilant about false breakouts, high volatility, and sector-specific nuances.
Long-term investors can benefit by linking breakouts with macroeconomic trends and structural shifts in energy demand.
The energy sector remains dynamic, and breakouts often precede strong trends, making them an essential tool for market participants.
✅ Key Takeaways:
Breakouts signal shifts in momentum; confirmation by volume is critical.
Technical patterns, support/resistance, and indicators provide actionable insights.
Fundamental factors (oil prices, demand, policy) often drive sector breakouts.
False breakouts are common; risk management and stop-losses are essential.
Energy sector breakouts are highly sensitive to global events and sentiment.

Tata Steel Ltd The chart exhibits a Cup and Handle pattern on Tata Steel’s daily timeframe.
1. Pattern structure:
Cup: Formed from Nov to early Jan, with a rounded decline and recovery, creating the “U” shape.
Handle: A tighter consolidation from mid‑Jan to Feb, retracing ~10–15% of the cup’s advance, which is typical for a healthy handle.
2. Breakout:
The price has pierced the handle’s resistance (≈₹178) with decent volume (26 M shares), confirming the bullish signal.
The breakout candle is relatively strong, suggesting momentum behind the move.
3. Volume analysis:
Volume spikes during the cup’s formation and at the breakout, indicating institutional interest.
Handle volume is lower, showing reduced selling pressure and consolidation.
4. Target calculation:
Measured move: The depth of the cup (≈₹26.05) is projected upward from the breakout point, giving a target of ₹212 (13.93% upside).
Intermediate target: +₹9.32 (4.99%) to ₹197, often hit first in a gradual climb.
5. Support & resistance:
Immediate support now lies at the handle’s base (≈₹168–172).
Strong resistance is the previous high near ₹212.
6. Trading considerations:
Entry: Confirm close above ₹178 with volume > average; enter long.
Stop‑loss: Place below the handle’s low (≈₹168) to limit risk.
Position sizing: Allocate based on risk tolerance and the ~13% target upside.

GOLD (XAU/USD) – Bullish Continuation Toward Higher Highs🔍 Technical Analysis (H1):
Market Structure:
Gold remains in a strong bullish structure with clear higher highs & higher lows ✔️, firmly respecting the ascending trendline 📈.
Breakout & Momentum:
Multiple clean breakouts above previous resistance zones confirm strong buying pressure 💪. Each breakout is followed by healthy pullbacks, showing controlled bullish momentum.
POI → Pivot Support:
Previous POI zones have successfully flipped into support 🔄, and price is currently holding above the Pivot Point zone, which strengthens bullish continuation bias 🟢.
Current Price Action:
Price is consolidating above the pivot area, suggesting a brief pause before the next impulsive move higher ⏳➡️⬆️.
🎯 Upside Targets:
Target 1: 5,300 🎯
Target 2: 5,330 🎯🎯
Extended Target: 5,360+ 🚀 (if bullish momentum accelerates)
🛡️ Invalidation / Support to Watch:
Bullish bias remains valid as long as price holds above the Pivot Point zone. A break below may trigger a deeper pullback, not trend reversal ⚠️.
📌 Conclusion:
Overall trend is bullish, structure is healthy, and price action favors a continuation toward the marked target zone after minor consolidation 📦➡️🚀.
✨ Trade with the trend & manage risk wisely! 💼📊

Technical vs. Fundamental AnalysisIntroduction
In the world of investing and trading, understanding the value and timing of financial instruments is crucial. Investors and traders often rely on two primary methods to guide their decisions: technical analysis and fundamental analysis. While both aim to inform decisions about buying, holding, or selling securities, they differ fundamentally in approach, methodology, and application. Understanding the strengths, limitations, and appropriate use cases of each is vital for anyone participating in financial markets.
1. Fundamental Analysis
Fundamental analysis focuses on evaluating a security’s intrinsic value. It attempts to determine whether a stock, bond, or other asset is overvalued, undervalued, or fairly priced based on the underlying economic and financial factors.
1.1 Core Principles
At its core, fundamental analysis is about understanding the “health” of a company or asset. Analysts examine various factors, including:
Financial Statements: Income statements, balance sheets, and cash flow statements are analyzed to assess profitability, liquidity, solvency, and efficiency. Key metrics include earnings per share (EPS), price-to-earnings (P/E) ratio, debt-to-equity ratio, and return on equity (ROE).
Industry Conditions: The sector in which a company operates affects its potential. Market share, competitive advantages, regulatory environment, and industry growth trends are critical considerations.
Macroeconomic Factors: Interest rates, inflation, GDP growth, and fiscal policies can significantly influence asset prices.
Management Quality: Leadership decisions, corporate governance, and strategic vision often determine long-term success.
1.2 Methods
There are two primary approaches to fundamental analysis:
Top-Down Approach: Analysts first study macroeconomic conditions, then industry trends, and finally specific companies.
Bottom-Up Approach: Focuses on analyzing individual companies, often ignoring broader economic conditions, to identify investment opportunities.
1.3 Example
Suppose an investor evaluates Company X, a technology firm. By analyzing its revenue growth, profit margins, R&D spending, and competitive position, the investor determines the intrinsic value of the stock to be $150. If the current market price is $120, the stock may be considered undervalued, presenting a potential buying opportunity.
1.4 Advantages of Fundamental Analysis
Long-Term Perspective: Helps investors identify securities that may generate sustainable returns over years.
Value Identification: Can reveal undervalued or overvalued assets relative to intrinsic value.
Economic Insight: Offers a comprehensive understanding of industry and macroeconomic impacts on investments.
1.5 Limitations of Fundamental Analysis
Time-Consuming: Requires deep research, data collection, and analysis.
Subjectivity: Estimating intrinsic value involves assumptions that may differ among analysts.
Less Effective for Short-Term Trading: Market prices may diverge from fundamental values for extended periods.
2. Technical Analysis
Technical analysis, on the other hand, focuses on price movements and trading patterns rather than the underlying business. It assumes that all relevant information is already reflected in the asset’s price, and that historical patterns tend to repeat over time.
2.1 Core Principles
Technical analysis is based on three key assumptions:
Market Action Discounts Everything: Prices reflect all available information, including fundamentals, market sentiment, and news.
Prices Move in Trends: Once established, trends are more likely to continue than reverse, at least until proven otherwise.
History Tends to Repeat Itself: Human psychology leads to recurring price patterns.
2.2 Tools and Techniques
Technical analysts use charts, patterns, and indicators to forecast price movements:
Charts: Line charts, bar charts, and candlestick charts visualize price action over different time frames.
Indicators: Moving averages, relative strength index (RSI), MACD, Bollinger Bands, and Fibonacci retracement levels help identify trends and momentum.
Patterns: Head-and-shoulders, double tops/bottoms, triangles, and flags signal potential reversals or continuations.
Volume Analysis: Helps confirm trends or warn of potential reversals.
2.3 Example
A trader observes that Stock Y has formed a “double bottom” pattern on its daily chart, signaling a potential upward reversal. Using this information, the trader may enter a long position, anticipating a price increase based on historical pattern behavior rather than the company’s earnings or fundamentals.
2.4 Advantages of Technical Analysis
Timing and Short-Term Opportunities: Helps traders make decisions based on market trends and entry/exit points.
Quantitative Approach: Uses measurable price data and mathematical indicators.
Market Sentiment Insight: Captures emotions and behaviors that drive short-term price movements.
2.5 Limitations of Technical Analysis
Does Not Measure Intrinsic Value: Focuses purely on price action without regard to a company’s financial health.
False Signals: Patterns and indicators can fail, leading to losses.
Short-Term Focus: Often unsuitable for long-term investment strategies.
3. Fundamental vs. Technical Analysis: Key Differences
Feature Fundamental Analysis Technical Analysis
Focus Intrinsic value of the asset Price movements and trends
Time Horizon Long-term Short- to medium-term
Basis Financial statements, economic indicators, industry trends Price charts, volume, technical indicators
Assumption Market prices eventually reflect true value History tends to repeat; price trends continue
Tools Ratios, financial models, macroeconomic data Charts, trend lines, moving averages, oscillators
Decision Making Buy undervalued, sell overvalued Buy when patterns signal upward trend, sell on reversal signals
Use Case Investment (long-term) Trading (short-term or swing trading)
4. Integrating Both Approaches
Many successful investors and traders combine both fundamental and technical analysis:
Long-Term Investors: Use fundamental analysis to identify undervalued stocks, then apply technical analysis to optimize entry points.
Swing Traders: May rely primarily on technical analysis but consider fundamental news (earnings, economic data) to anticipate volatility.
Portfolio Management: Combining both can improve risk management and timing of trades.
Example of Integration
Consider a tech company showing strong earnings growth (fundamental analysis). A technical analyst may wait for a price breakout above a resistance level before entering a trade. By combining both approaches, the investor aligns value with optimal timing.
5. Market Psychology and Behavioral Insights
Fundamental Analysis: Relies on rational evaluation of financial health, assuming markets are logical over the long term.
Technical Analysis: Captures human psychology, fear, and greed, which often dominate short-term market behavior.
This difference reflects the broader tension between value investing and trend trading. Technical analysis often thrives in volatile, sentiment-driven markets, whereas fundamental analysis provides a grounded assessment during stable, growth-oriented periods.
6. Conclusion
Both fundamental and technical analysis offer valuable insights, but they serve different purposes. Fundamental analysis is ideal for long-term investors seeking intrinsic value, focusing on company performance, industry trends, and economic conditions. Technical analysis suits short-term traders aiming to exploit market trends and price patterns, focusing on timing and market sentiment.
While some purists favor one approach over the other, the most successful market participants often blend the two. Fundamental analysis provides the “why” behind an investment, while technical analysis provides the “when.” By understanding the strengths and limitations of each method, investors and traders can make more informed, strategic, and disciplined financial decisions.
In today’s dynamic financial markets, a holistic approach that considers both fundamentals and technical signals can enhance profitability, reduce risk, and provide a robust framework for navigating complexity. Knowledge of both allows market participants to adapt to changing conditions, combine long-term insight with short-term strategy, and ultimately make more confident decisions in the face of uncertainty.

Intraday Trading vs. Swing TradingIntroduction
Trading styles define how a trader interacts with the market—time horizon, risk appetite, capital usage, psychology, and even lifestyle. Among all styles, intraday trading and swing trading are the two most popular for active traders, especially in equity, derivatives, forex, and crypto markets.
While both aim to profit from price movements, they differ sharply in time frame, strategy, stress level, and skill requirements. Choosing the right one is less about returns and more about who you are as a trader.
1. Intraday Trading: Overview
Intraday trading involves buying and selling financial instruments within the same trading day. All positions are squared off before the market closes, eliminating overnight risk.
Key Characteristics
Holding period: Minutes to hours
Positions: Open and closed within the same day
Leverage: High (especially in derivatives)
Frequency: Multiple trades per day
Objective: Capture small price movements
Instruments Commonly Traded
Index futures & options (Nifty, Bank Nifty)
Highly liquid stocks
Forex pairs
Cryptocurrencies (24×7 markets)
2. Swing Trading: Overview
Swing trading aims to capture medium-term price “swings” over several days to weeks. Traders hold positions overnight and sometimes through volatile sessions.
Key Characteristics
Holding period: 2 days to several weeks
Positions: Carried overnight
Leverage: Low to moderate
Frequency: Few trades per month
Objective: Capture trend segments
Instruments Commonly Traded
Stocks (cash market)
Futures (with hedging)
ETFs
Crypto & commodities
3. Time Frame and Market Engagement
Intraday Trading
Requires constant screen time
Most active during:
Market open (first 60–90 minutes)
Major news events
High-volume periods
Traders must react instantly to price action
Swing Trading
Less screen dependency
Analysis typically done:
After market hours
On weekends
Execution may take only a few minutes per day
Bottom line:
Intraday trading is time-intensive. Swing trading is time-efficient.
4. Risk Profile and Volatility Exposure
Intraday Trading Risks
Sudden spikes and fake breakouts
Slippage during high volatility
Overtrading
Emotional decision-making
Brokerage & transaction costs
However, intraday traders avoid:
Overnight gap risk
Unexpected global events while holding positions
Swing Trading Risks
Overnight gaps due to:
Earnings announcements
Global cues
Geopolitical events
Wider stop losses
Longer drawdown periods
Risk difference:
Intraday risk is intense but short-lived.
Swing trading risk is slower but persistent.
5. Capital Requirements and Cost Structure
Intraday Trading
Lower capital due to leverage
Higher costs because of:
Frequent trades
Brokerage, STT, exchange fees
Profitability depends heavily on cost control
Swing Trading
Higher capital preferred
Lower transaction costs
Better reward-to-risk ratios over time
Important insight:
Many intraday traders are profitable before costs but lose after expenses. Swing traders are less affected by this trap.
6. Strategy and Technical Approach
Intraday Trading Strategies
Scalping
VWAP trading
Opening range breakout
Momentum trading
Option gamma plays
Indicators used:
VWAP
RSI (short period)
EMA (5, 9, 20)
Volume profile
Order flow
Swing Trading Strategies
Trend following
Pullback entries
Breakout retests
Mean reversion
Sector rotation
Indicators used:
Daily & weekly moving averages
MACD
RSI (14-period)
Support & resistance
Fibonacci retracements
7. Psychological Demands
Intraday Trading Psychology
High stress
Quick decision-making
Requires emotional detachment
Prone to revenge trading
Mental fatigue is common
Swing Trading Psychology
Requires patience
Comfort with open P&L swings
Discipline to hold winners
Less emotional noise
Reality check:
Most traders fail in intraday trading due to psychological overload, not lack of strategy.
8. Lifestyle Compatibility
Intraday Trading Suits:
Full-time traders
People who enjoy fast decision cycles
Those who thrive under pressure
Traders with disciplined routines
Swing Trading Suits:
Working professionals
Business owners
Part-time traders
People who value flexibility
9. Profit Potential and Consistency
Intraday Trading
Potential for daily income
Compounding possible
High variance in results
Small mistakes can erase weeks of gains
Swing Trading
Slower but steadier growth
Larger profits per trade
Easier to maintain consistency
Better for long-term capital growth
Key truth:
Consistency is easier in swing trading than intraday trading.
10. Which One Should You Choose?
Ask yourself these questions:
Can I sit in front of the screen for hours daily?
Can I handle rapid losses without emotional reactions?
Do I prefer fast action or structured planning?
Is trading my primary income source?
Choose Intraday Trading if:
You can give full-time attention
You have strict discipline
You enjoy short-term action
You accept higher stress
Choose Swing Trading if:
You want work-life balance
You prefer analytical planning
You are building capital steadily
You want lower psychological pressure
Conclusion
Intraday trading and swing trading are not “better” or “worse”—they are different tools for different personalities.
Intraday trading rewards speed, focus, and emotional control
Swing trading rewards patience, structure, and consistency
Most successful traders eventually migrate toward swing trading as their capital and experience grow, while a small elite excels in intraday trading through strict discipline and process-driven execution.
The best approach is not choosing the most exciting style—but the one you can execute flawlessly, repeatedly, and calmly.

XAUUSD – Bullish trend, focus on Buy pullbacks to 5,700Market Context (M30)
Gold continues to trade in a strong bullish continuation after a clean impulsive leg higher. The recent consolidation above former resistance shows acceptance at higher prices, not exhaustion. This behavior suggests the market is rebalancing liquidity before the next expansion leg.
On the macro side, USD remains under pressure, while safe-haven demand stays firm. Even though bond yields are relatively stable, capital flows continue to favor gold, keeping the upside bias intact.
➡️ Intraday bias: Bullish – trade with the trend, not against it.
Structure & Price Action
• Market structure remains bullish with Higher Highs – Higher Lows
• Previous resistance has flipped into demand and is being respected
• No bearish CHoCH or structural breakdown confirmed
• Current pullbacks are corrective moves within an active uptrend
Key takeaway:
👉 As long as price holds above key demand, pullbacks are opportunities for continuation.
Trading Plan – MMF Style
Primary Scenario – Buy the Pullback
Patience is key. Avoid chasing price into extensions.
• BUY Zone 1: 5,502 – 5,480
(Minor demand + short-term rebalancing zone)
• BUY Zone 2: 5,425 – 5,400
(Trendline support + deeper liquidity zone)
➡️ Only execute BUYs after clear bullish reaction and structure confirmation.
➡️ No FOMO at highs.
Upside Targets
• TP1: 5,601
• TP2: 5,705 (upper Fibonacci extension / expansion target)
Alternative Scenario
If price holds above 5,601 without a meaningful pullback, wait for a break & retest to join the next continuation leg.
Invalidation
A confirmed M30 close below 5,400 would weaken the bullish structure and require reassessment.
Summary
Gold remains in a controlled bullish expansion supported by both structure and macro flow. The edge lies in discipline — buying pullbacks into demand while the trend stays intact, not predicting tops.
➡️ As long as structure holds, higher prices remain the path of least resistance.

SILVER SPOT LONG TERM VIEW SILVER POSSIBLE MOVES
WAVE 3 118.00, 120,00 124,00 DOWN MOVE TO WAVE 4
126,00 ABOVE SUSTAIN OR CLOSE INVALIDATION DIRECT WAVE 5 POSSIBLE
WAVE 4 80.00, 68.00, 60.00, 55.00 UP MOVE TO WAVE 5
50.80 BELOW SUSTAIN OR CLOSE WAVE 4 INVALIDATION
WAVE 5 143.00, 180.00
WAVE X 220.00, 280.00, 298.00
View is for study purpose only , we are not recommend any trade or investment
Always do your own analysis

MARUTI 1 Month View 📌 Current Market Snapshot (Daily)
Current approximate price:
📍 ~₹14,480–₹14,900 range (varying slightly between NSE/BSE live feeds).
Daily trading range:
• Low: ~₹14,350
• High: ~₹14,870**
52-Week Range:
• Low: ~₹11,059
• High: ~₹17,370 +
📈 1-Month Key Levels (Support & Resistance)
🔁 Resistance Levels (Upside)
R1: ~₹15,300–₹15,400 — immediate supply / pivot resistance on the 1-month timeframe.
R2: ~₹15,730–₹15,800 — next resistance zone (near shorter moving averages).
R3: ~₹16,150–₹16,170 — higher resistance and lower trading range top.
Near term major resistance: Above ~₹16,650–₹16,830 could signal a breakout continuation to higher 1-month highs.
🔽 Support Levels (Downside)
S1: ~₹14,440–₹14,480 — immediate downside support cluster.
S2: ~₹14,000 — psychological and lower short-term support.
S3: ~₹13,570–₹13,600 — deeper support if weak momentum continues.
🔄 Pivot Reference
Pivot (central reference): ~₹14,867–₹14,900 area — if price closes above this regularly, short-term bias could tilt up; below it suggests bearish control in the 1-month context.
📊 1-Month Price Behavior & Interpretation
✔ The stock has pulled back significantly from recent peak levels near ₹16.8k–₹17.3k seen earlier in January/December.
✔ Currently trading below most short-term moving averages (20 DMA / 50 DMA) — indicating short-term bearish pressure.
✔ Near-term price action will focus on whether ₹14.4k support holds; breach below that could expose deeper pullbacks toward ₹14.0k–₹13.6k.

GOLD SPOT LONG TERM VIEW GOLD POSSIBLE MOVES
WAVE 3 5602, 5700, 5850, 6110,
DOWN MOVE TO WAVE 4
6370 ABOVE SUSTAIN OR CLOSE WAVE 3 INVALIDATION DIRECT WAVE 5 POSSIBLE
WAVE 4 4600, 4435, 4090, UP MOVE TO WAVE 5
3731 BELOW SUSTAIN OR CLOSE WAVE 4 INVALIDATION
WAVE 5 8200, 8700
WAVE X 9200, 10400, 11400
View is for study purpose only , we are not recommend any trade or investment
Always do your own analysis

ULTRACEMCO 1 Day View 📊 Current Price (approx)
• ULTRACEMCO is trading around ₹12,620–₹12,770 on NSE in today’s session based on multiple live price feeds.
📈 Daily Support & Resistance Levels – NSE (Pivot-based)
📌 Daily Pivot & Range (classic pivot levels):
Resistance 3 (R3): ~ ₹13,101
Resistance 2 (R2): ~ ₹12,963
Resistance 1 (R1): ~ ₹12,776
Pivot Point (PP): ~ ₹12,638
Support 1 (S1): ~ ₹12,451
Support 2 (S2): ~ ₹12,313
Support 3 (S3): ~ ₹12,126
👉 Key intraday reference:
• If price holds above Pivot ~₹12,638, bulls may target the R1–R3 zone.
• A break below S1/S2 could open downside to ₹12,313–₹12,126 S3.
🔁 Alternate Daily Support / Resistance (Pivot Speed)
• R1: ~ ₹12,521
• R2: ~ ₹12,673
• R3: ~ ₹12,792
• Support 1: ~ ₹12,250
(Different pivot provider with slightly variation — good as corroborative levels)
📊 Short-Term Support & Resistance (Alternative)
• Daily Support (Munafasutra): ~ ₹12,264–₹12,265
• Daily Resistance: ~ ₹12,499–₹12,500
(These can be useful for tighter intraday stops)
📌 What This Means for 1D Trading
Bullish above:
• ₹12,638 Pivot — key to stay above for bullish bias today.
• Above ₹12,776–₹12,963 — adds confidence for breakout toward ₹13,101 R3.
Bearish below:
• Below ₹12,451 S1 — risk to ₹12,313–₹12,126 S3.
• Sustained close below Pivot may signal short-term pressure.

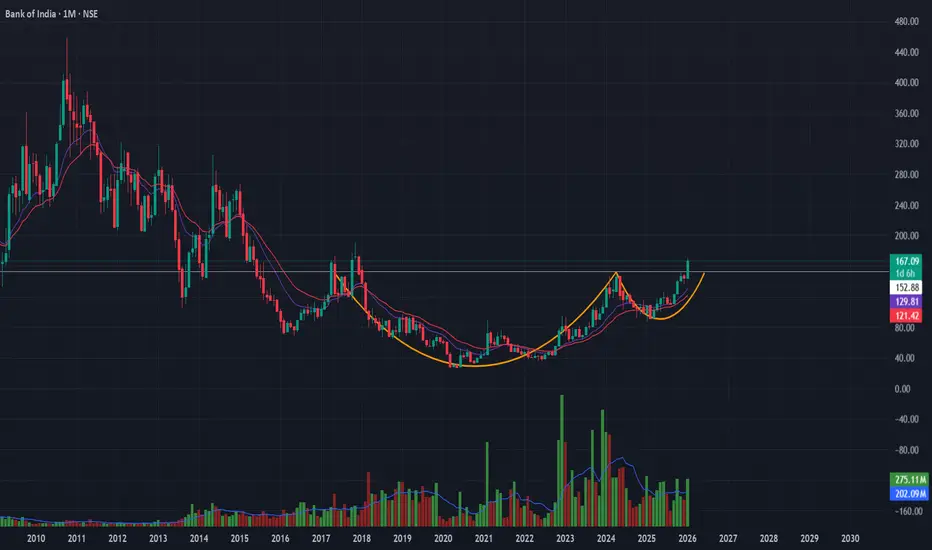
Bank of India | Cup & Handle Breakout SetupStructure:
Long-term Cup & Handle pattern nearing completion on monthly timeframe, indicating accumulation after a prolonged base.
Confirmation Signals:
-Volume expanding on rallies
-RSI above 50 and rising
-OBV trending higher → accumulation visible
-Price holding above short-term EMAs
Trade Plan:
-Buy: Sustained breakout above ₹151
-Targets: ₹199 → ₹268
-Stop-loss: ₹134 (ATR-based, structure-valid)
-Risk–Reward: ~1:5
USD/JPY Intraday Short – Liquidity Sweep & Shift in Market STRFollowing a period of distribution near the 153.750 level, price has shown a clear rejection of recent highs, likely sweeping buy-side liquidity (BSL) before breaking lower.

#XAU/USD Sell Trade Scenario.Here’s an up-to-date XAU/USD Sell trade outlook (technical + fundamental) to help you assess whether positioning for a Downside makes sense right now.
Thank You......

IRFC 1 Day View 📊 Daily Pivot Levels (1-Day TF)
Pivot (daily equilibrium): ~ ₹115.3 – bias above this = short-term bullish; below = bearish.
📈 Resistance Levels (Upside)
R1: ~ ₹117.0–₹117.1 — first daily resistance.
R2: ~ ₹119.9–₹120.0 — secondary resistance zone.
R3: ~ ₹121.6–₹122.0+ — stronger upside barrier.
📉 Support Levels (Downside)
S1: ~ ₹112.5–₹112.6 — first support around recent lows.
S2: ~ ₹110.8–₹111.0 — next support zone below.
S3: ~ ₹107.9–₹108.0 — deeper support zone from pivot analysis.
🔁 Technical Bias Notes (Daily Timeframe)
Current daily RSI and momentum indicators show bearish to neutral bias, with price often trading below short-term moving averages — sellers have slight edge unless price clears key resistances.
Stochastic and oscillators have shown oversold pressures at times, so short-term bounce near support zones (₹110–₹112) is possible if momentum shifts.

GIFTNIFTY IntraSwing Levels for 29th JAN 2026GIFTNIFTY IntraSwing Levels for 29th JAN 2026
🚀Follow & Compare NIFTY spot Post for Taking Trade
💥Level Interpretation / description:
L#1: If the candle crossed & stays above the “Buy Gen”, it is treated / considered as Bullish bias.
L#2: Possibility / Probability of REVERSAL near RLB#1 & UBTgt
L#3: If the candle stays above “Sell Gen” but below “Buy Gen”, it is treated / considered as Sidewise. Aggressive Traders can take Long position near “Sell Gen” either retesting or crossed from Below & vice-versa i.e. can take Short position near “Buy Gen” either retesting or crossed downward from Above.
L#4: If the candle crossed & stays below the “Sell Gen”, it is treated / considered a Bearish bias.
L#5: Possibility / Probability of REVERSAL near RLS#1 & USTgt
HZB (Buy side) & HZS (Sell side) => Hurdle Zone,
*** Specialty of “HZB#1, HZB#2 HZS#1 & HZS#2” is Sidewise (behaviour in Nature)
Rest Plotted and Mentioned on Chart
Color code Used:
Green =. Positive bias.
Red =. Negative bias.
RED in Between Green means Trend Finder / Momentum Change
/ CYCLE Change and Vice Versa.
Notice One thing: HOW LEVELS are Working.
Use any Momentum Indicator / Oscillator or as you "USED to" to Take entry.
━━━━━━━━━━━━━━━━━━━━━━━━━━━━━━━━━━━━━━━━━━━
⚠️ DISCLAIMER:
The information, views, and ideas shared here are purely for educational and informational purposes only. They are not intended as investment advice or a recommendation to buy, sell, or hold any financial instruments. I am not a SEBI-registered financial adviser.
Trading and investing in the stock market involves risk, and you should do your own research and analysis. You are solely responsible for any decisions made based on this research.
"As HARD EARNED MONEY IS YOUR's, So DECISION SHOULD HAVE TO BE YOUR's".
━━━━━━━━━━━━━━━━━━━━━━━━━━━━━━━━━
❇️ Follow notification about periodical View
💥 Do Comment for Stock WEEKLY Level Analysis.🚀
📊 Do you agree with this view?
✈️ HIT THE PLANE ICON if this technical observation resonates with you. It will Motivate me.
━━━━━━━━━━━━━━━━━━━━━━━━━━━━━━━━━
💡 If You LOOKING any CHART & want for Level and ANALYZE?
Share your desired stock names in the comments below! I will try to analyze the chart Levels, patterns and share my technical view (so far my Knowledge).
If Viewers think It can identify meaningful setups. Looking forward to hearing from all of you — let's keep this discussion going and help each other make better trading decisions.

Nifty Realty - An Ignored HIDDEN GEM at solid Risk RewardThis is a ratio chart of Nifty Realty compared to NSE 500
A classic cup formation is being seen on multi year level where nifty realty is in a rising channel formation making higher lows for past 2-3 times since covid
Right now index has taken support again at channel low and reversal looks likely
A series of higher lows, increasing volumes, rising channel and a cup formation all together indicate good solid bullishness on real estate stocks outperforming cnx 500.

NIFTY TREND UPDATIONIn Nifty options trading, a significant increase in Put Open Interest (OI) is a double-edged sword that requires careful technical confirmation. From the perspective of "Smart Money" (option writers), rising Put OI generally builds a floor of Support, as institutional sellers are betting the index will stay above that level to collect premiums. However, your observation is correct: if Nifty is trading near a resistance zone or a trendline, an increase in Put OI alone does not automatically reflect positive strength.
If the index breaks below its established trendlines despite the rising Put OI, it often triggers a "Long Unwinding" or a "Short Buildup" scenario. In this case, Put sellers who were providing support are forced to cover their positions to limit losses, which creates a cascade of selling pressure, leading to a sharp fall. Conversely, if Nifty holds above resistance while Put OI climbs, it confirms that the "floor" is moving higher, potentially leading to a breakout. Without a clear move above resistance, however, the heavy Put OI might simply indicate aggressive hedging or a range-bound market rather than true bullish momentum. Always look for price action to lead the way; OI only tells you where the bets are placed, not which side will eventually win.

VEDL - Multi year breakoutThis a 3M time frame chart. Simple, clean and elegant. Please note this a very broad time frame chart so this cannot be a swing trade or short term trade, the minimum time of investment should be 6M.
We can target a return in the range of 60%-100%

NIFTY KEY LEVELS FOR 29.01.2026NIFTY KEY LEVELS FOR 29.01.2026
Timeframe: 3 Minutes
If the candle stays above the pivot point, it is considered a bullish bias; if it remains below, it indicates a bearish bias. Price may reverse near Resistance 1 or Support 1. If it moves further, the next potential reversal zone is near Resistance 2 or Support 2. If these levels are also broken, we can expect the trend.
When a support or resistance level is broken, it often reverses its role; a broken resistance becomes the new support, and a broken support becomes the new resistance.
If the range(R2-S2) is narrow, the market may become volatile or trend strongly. If the range is wide, the market is more likely to remain sideways
please like and share my idea if you find it helpful
📢 Disclaimer
I am not a SEBI-registered financial adviser.
The information, views, and ideas shared here are purely for educational and informational purposes only. They are not intended as investment advice or a recommendation to buy, sell, or hold any financial instruments.
Please consult with your SEBI-registered financial advisor before making any trading or investment decisions.
Trading and investing in the stock market involves risk, and you should do your own research and analysis. You are solely responsible for any decisions made based on this research.

Nifty50 analysis(29/1/2026).CPR: narrow + ascending cpr: trending day.
FII: 480.26 bought
DII: 3,360.59 bought.
Highest OI: 25500and25300 put oi and 25300 and 25200 call oi.
P.C.R: 0.8 mild bullish.
Resistance:25500.
Support : 25150
conclusion:
My pov:
1.the first price resistance is 25450 if it crossed then bulish.
2.until 24900 is crossed below down only bullish pov.
3.today trending day so plan accordingly.
What IF:
1.if price breaks 24900 and closed in day candle then overall trend continues.
2.bullishness continues if it crossed 25450.
psychology fact:
embrace uncertainty, become skilled don't wait, go for it.
note:
8moving average ling is blue colour.
20moving average line is green colour
50moving average line is red colour.
200moving average line is black colour.
cpr is for trend analysis.
MA line is for support and resistance.
Disclaimer:
Iam not Sebi registered so i started this as a hobby, please do your own analysis, any profit/loss you gained is not my concern. I can be wrong please do not take it seriously thank you.

BDL Trading Inside a Clear Downward ChannelBDL is moving within a well-defined downward channel, respecting both resistance at the top and support at the bottom.
The price has once again reacted strongly from the lower trendline, showing that buyers are actively defending this zone. This repeated bounce confirms that the structure is still intact and the stock remains in consolidation rather than a breakdown phase.
As long as the lower channel support holds, we can expect volatile moves within the range. A clear breakout above the upper trendline could signal a trend shift, while rejection near resistance may continue the sideways movement.
