MRPL 1 Day Time Frame 📈 MRPL Latest Intraday Snapshot (1‑Day Time Frame)
Last traded / Current Price: ₹155.40 on NSE (latest price update for the day)
Price Change: Up ~₹1.11 (+0.72%) from previous close
Today’s Open: ₹155.00
Day’s Low: ₹152.60
Day’s High: ₹158.75
Previous Close: ₹154.29
📊 Intraday Movement (1‑Day Range)
The stock opened slightly above the prior close and has been trading between ₹152.60 and ₹158.75 so far today, showing typical intraday volatility for MRPL.
📌 Summary (1‑Day Time‑Frame View):
✔ Price is trending slightly higher intraday.
✔ Intraday range indicates momentum above recent lows.
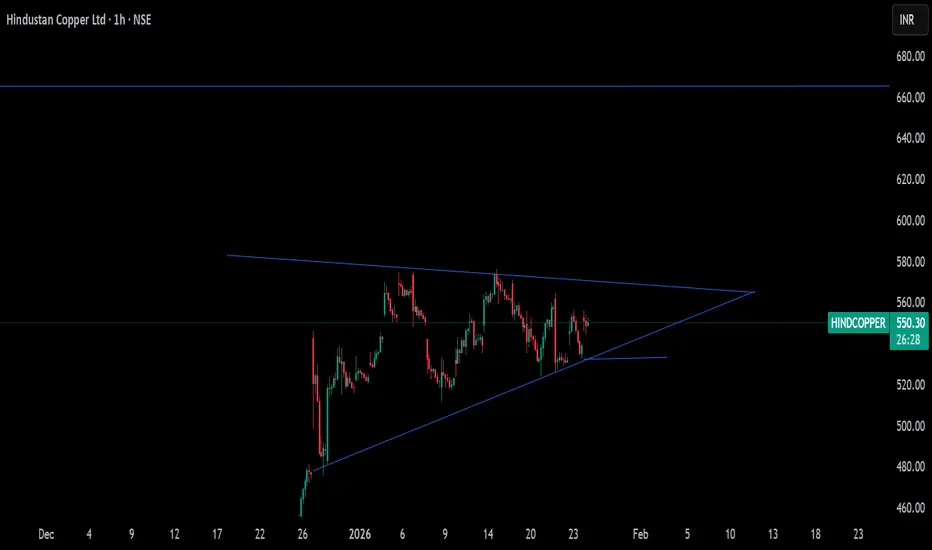
Trend Analysis

HindCopper to test ATH!!Nifty Metals are in a cyclical bull run. HindCopper has taken a perfect support in a bullish channel. One can plan a long position with an SL below the channel, targetting ATH levels of 670.
Paytm In this chart we clearly see that on B wave triangle correction is over. Now in upcoming days we can see major fall. Because B wave is over and we all know is the B wave is over then we may see sharp C wave in 5 waves ..
Disclaimer:- Invest at your own risk,, i am not register with Sebi.. This chart is according to my technical analysis which i learnt from past years

USDJPY – A Global Repricing Phase, Not a Random MoveWhen I look at USDJPY, this move doesn’t feel random to me. It looks like part of a broader global adjustment phase rather than something driven by this pair alone.
Price Context:
Price spent a long time reacting from a major supply zone before showing a clear structure shift. Since then, the market has been respecting an ascending channel, with higher highs and higher lows.
Why this move makes sense:
As global risk sentiment shifts and interest rate expectations change, currencies often move together. That’s why similar moves are visible across multiple FX pairs, this is a broad-based repricing, not a pair-specific reaction.
Current Structure:
The recent pullback into demand and trend support looks like a healthy retracement, not a breakdown. As long as this structure holds, the broader trend remains intact.
Disclaimer: This analysis is for educational purposes only and does not constitute financial advice. Trading involves risk.

GBPUSD – Support Holding, Watching Reaction From RangeGBP/USD has reacted from a well-defined support zone, an area where buyers have stepped in multiple times before. Price is currently trading between clear support and resistance, indicating a short-term range environment.
As long as this support holds, upside reactions toward the resistance zone remain possible. A clean break below support, however, would weaken this structure and change the short-term bias.
This is a reaction-based zone, not a prediction. Let price confirm the next move.
Disclaimer: This analysis is for educational purposes only and does not constitute financial advice. Trading involves risk. Please manage risk responsibly.

NIFTY- Intraday Levels - 28th Jan 2026Budget date is coming closer !! Watch for volatility.
If NIFTY sustain above 25112/36 above this bullish then 25250/266 then around 25288/296 then 25310/332/340 or 25354/70 strong level above this wait
If NIFTY sustain below 25978/58 below this bearish then around 25902/874 then strong level below this more bearish then 25490/453 below this wait
Consider some buffer points in above levels.
Please do your due diligence before trading or investment.
**Disclaimer -
I am not a SEBI registered analyst or advisor. I does not represent or endorse the accuracy or reliability of any information, conversation, or content. Stock trading is inherently risky and the users agree to assume complete and full responsibility for the outcomes of all trading decisions that they make, including but not limited to loss of capital. None of these communications should be construed as an offer to buy or sell securities, nor advice to do so. The users understands and acknowledges that there is a very high risk involved in trading securities. By using this information, the user agrees that use of this information is entirely at their own risk.
Thank you.

WeWork > Positional TradeDecent Results
CMP 562
SL CLB 525
Expected Tgt's 600/620/650 Probably More
For more insights & trade ideas,
📲 Visit my profile and hit Follow
Warm regards,
Naresh G
SEBI Registered Research Analyst
💬 Comment below if you want me to analyse any stock for you 🔍

KARURVYSYA Bank is Buy for 11% upside possibility in 30-40 days.KARURVYSYA Bank is Buy for 11% upside possibility in 30-40 days.
LTP - 263
SL - 254
Target - 290+
Happy investing.

4H Rejection Block & Return to EquilibriumGold (XAUUSD) has rallied aggressively but is now showing signs of exhaustion as it taps into the supply zone around the 5080-5100 level. We are seeing a rejection on the 4H timeframe, suggesting a potential shift in momentum.

JK Tyre new high in a weak marketEvaluating Tyre companies for sometime now and JK and CEAT looks good with the RM basket coming down. Net of Rupee devaluation the impact looks positive. JK Tyre is forming what is akin to a C&H pattern, though its not your case of classic C&H ( took more than 65 weeks to form) . Seeing the auto sales number + lower RM basket, this looks like a case of possible upside.

AXISBANK 40% upside possibility in 1-1.5 YearsAXISBANK 40% upside possibility in 1-1.5 Years
Fundamentals - Company has delivered good profit growth of 72.2% CAGR over last 5 years - Best among all Private banks.
Technical - Stock breaking from ATH backed with excellent Results.
LTP - 1325
Targets - 1850+
Timeframe - 1-1.5 Years.
Happy Investing.

APTPACK 1 Week View 📊 Short-Term (1-Week) Price Snapshot
Recent trading range (indicative): ~₹98 – ₹105+.
Current / recent price levels are near ₹100–103 on BSE.
Over the last week, price has shown small fluctuations around this zone.
Note: Actual real-time intra-week chart data isn’t available here, so these bands are inferred from resistance/support indicators and quoted prices.
📈 Key Technical Levels (Short-Term)
🔹 Resistance Levels
Resistance zones are price points where selling pressure could emerge:
R1: ~₹106.00
R2: ~₹110.85
R3: ~₹113.70
These are common pivot-based resistance bandings seen on short-term technical references.
👉 A close above these areas with volume could indicate bullish momentum.
🔻 Support Levels
Support marks areas where buyers might defend price:
S1: ~₹98.30
S2: ~₹95.45
S3: ~₹90.60
These are derived from short-term support pivots around the ₹100 region.
👉 Breaks below these levels on strong volume could signal further weakness.
📉 Short-Term Trend Cues
Moving Averages (Short Window): 20-day EMA/SMA are around ~₹101–102, near current price — indicating consolidation in the near term.
Volatility: Given relatively modest moves week-to-week, the stock seems range-bound unless it breaks key resistances (~106+) or supports (~98−).
🧠 What This Means for 1-Week Trading
Bullish Scenario:
Price holds above ₹100–101 (near short EMA/SMA cross)
Break above ₹106 could open room for short squeeze toward ₹110–113 range
Bearish Scenario:
Weakness under ₹98 might see a slide toward ₹95–90 support cluster
Risk increases on lower delivery/volume and lack of strong buying
Neutral/Range:
With price stuck near pivot zone and short moving averages overlapping, this looks like a range-bound stock for the week until significant catalyst or volume confirms breakouts.

Elliott Wave Analysis – XAUUSD | 27/01/2026
1. Momentum
Daily (D1)
– D1 momentum is currently compressing. This indicates that bullish pressure is still present; however, momentum has weakened, so a potential reversal risk exists.
→ The broader trend remains bullish, but strong corrective moves should be treated with caution.
H4
– H4 momentum is currently in the oversold zone.
→ This suggests that H4 is likely preparing to form a base and initiate a bullish reversal in the near term.
H1
– H1 momentum is currently declining.
→ In the short term, H1 may continue to correct for several more H1 candles before completing the pullback.
2. Wave Structure
Daily (D1) Wave Structure
– On the daily timeframe, price remains within a 5-wave structure (1–2–3–4–5) marked in blue.
– At this stage, blue wave 5 is extending, making it very difficult to precisely identify the termination point.
– In Elliott Wave theory, extensions reflect extreme bullish sentiment.
– When market psychology normalizes, the corrective move that follows is often sharp and aggressive.
→ Therefore, the current phase of XAUUSD requires a high level of caution.
H4 Wave Structure
– The corrective structure on H4 is expanding and developing multiple internal sub-structures.
→ As a result, accurate wave identification is not feasible until the structure is fully completed.
– For now, we rely on two key principles to define observation zones:
– Waves of the same degree often show similarities in time and price length.
– Waves within a structure typically maintain Fibonacci relationships with one another.
– Based on these principles, I am temporarily labeling a 1–2–3–4–5 structure in yellow on the H4 timeframe for monitoring purposes.
– Up to this point, the H4 correction remains consistent with the internal corrective waves within yellow wave 3.
H4 Scenario Monitoring
– If H4 momentum reverses upward and price breaks above the previous high, the market is likely still within yellow wave 3.
– Conversely, if the upcoming H4 rally fails to produce a new high, the probability increases that price is transitioning into yellow wave 4.
H1 Wave Structure
– On the H1 timeframe, an ABC structure has formed, and price is currently in a corrective rebound.
– However, at the present moment:
– H1 momentum has already turned bearish
– Price has failed to create a new high
→ Therefore, no immediate entry is warranted. We should wait for:
– H1 momentum to decline into the oversold zone
– At that point, a Buy setup can be considered based on:
– The ABC corrective structure on H1
– Alignment with the anticipated bullish reversal in H4 momentum
3. Target Zone
– A Fibonacci confluence zone from multiple waves is located around the 4957 price area.
→ This zone is considered the potential termination area for the current H1 correction.
– Regarding profit targets:
– We will continue monitoring subsequent momentum reversals on H1 and H4
– Once bullish momentum is confirmed, trade management will be handled in phases.
4. Trading Plan
– Buy Setup Zone: 4958 – 4955
– Stop Loss: 4937
– Take Profit Levels:
– TP1: 4978
– TP2: 5021
– TP3: 5060

Three White Soldiers Pattern Gold Buy Projection 27.01.26🔍 Technical Breakdown
Market Structure:
Overall structure remains bullish. Price already broke the neckline and a successful retest is completed, confirming continuation bias.
Retracement Zone:
Price has completed a 50% Fibonacci retracement, which is a high-probability buy zone in an uptrend.
Candlestick Confirmation:
Formation of Three White Soldiers indicates strong bullish momentum returning after the pullback.
📍 Key Levels
Entry for Buy:
Near 5065 – 5070 (Support + Retest zone)
Support Levels:
Support: ~5070
Support S1: ~5050
Targets / Resistance:
R1 / Target Zone: 5095 – 5105
Further upside possible if R1 breaks with volume
🎯 Trade Idea (Projection)
Bias: BUY on dips
Logic:
✔ Break & retest confirmed
✔ 50% retracement respected
✔ Bullish candle pattern
✔ Strong rejection from support
⚠️ Risk Note
If price sustains below 5050, bullish projection may fail and consolidation / deeper correction is possible.

ALLDIGI 1 Month View📊 Current Price Context (Recent)
Last close around ₹770–₹800 range on NSE.
📈 Key 1-Month Support & Resistance Levels
Classic Pivot Levels (short-term focus)
(These are useful for intraday to swing trades within ~1 month)
R3 (Strong Resistance): ~₹785–₹846
R2: ~₹781–₹830
R1: ~₹777–₹803
Pivot: ~₹773–₹776
S1: ~₹769–₹748
S2: ~₹765–₹722
S3 (Strong Support): ~₹761–₹722
(Ranges reflect slightly different calculations from multiple sources)
In simple terms:
Near-term resistance: ₹780–₹845
Turnaround pivot zone: ₹770–₹775
Support zone: ₹722–₹770
📉 Moving Averages (Short-to-Medium Term)
Shorter and medium SMAs/EMAs tend to act as dynamic support/resistance over a month:
20-day MA: ~₹817–₹840 (above current price) — potential resistance zone.
50-day MA: ~₹838–₹842 — also overhead resistance.
100–200 day averages: significantly higher — longer-term trend resistance points.
This suggests the stock is trading below key moving averages, which can signal a bearish or consolidating phase short-term.
📊 Oscillators & Momentum Metres
RSI near neutral to slightly oversold/flat levels recently.
Some technical sources report mixed signals (neutral to bearish).
🧠 Short-Term Technical Take
Bullish scenario:
• Break above ₹785–₹803 and then ₹820–₹845 could open space toward February highs.
Bearish scenario:
• Failure at resistance and break below ₹760–₹748 may accelerate downward movement.
Neutral/consolidation:
• Likely continuation of rangekeeping between ₹722–₹845 until clearer directional momentum appears.

GIFTNIFTY Feb 2026 Fut Roll-Over Levels For 27th JAN 2026GIFTNIFTY Feb 2026 Fut Roll-Over Levels For 27th JAN 2026
🚀Follow & Compare NIFTY spot Post for Taking Trade
===============================================
💥Level Interpretation / description:
L#1: If the candle crossed & stays above the “Buy Gen”, it is treated / considered as Bullish bias.
L#2: Possibility / Probability of REVERSAL near RLB#1 & UBTgt
L#3: If the candle stays above “Sell Gen” but below “Buy Gen”, it is treated / considered as Sidewise. Aggressive Traders can take Long position near “Sell Gen” either retesting or crossed from Below & vice-versa i.e. can take Short position near “Buy Gen” either retesting or crossed downward from Above.
L#4: If the candle crossed & stays below the “Sell Gen”, it is treated / considered a Bearish bias.
L#5: Possibility / Probability of REVERSAL near RLS#1 & USTgt
HZB (Buy side) & HZS (Sell side) => Hurdle Zone,
*** Specialty of “HZB#1, HZB#2 HZS#1 & HZS#2” is Sidewise (behaviour in Nature)
Rest Plotted and Mentioned on Chart
Color code Used:
Green =. Positive bias.
Red =. Negative bias.
RED in Between Green means Trend Finder / Momentum Change
/ CYCLE Change and Vice Versa.
Notice One thing: HOW LEVELS are Working.
Use any Momentum Indicator / Oscillator or as you "USED to" to Take entry.
━━━━━━━━━━━━━━━━━━━━━━━━━━━━━━━━━━━━━━━━━━━
⚠️ DISCLAIMER:
The information, views, and ideas shared here are purely for educational and informational purposes only. They are not intended as investment advice or a recommendation to buy, sell, or hold any financial instruments. I am not a SEBI-registered financial adviser.
Trading and investing in the stock market involves risk, and you should do your own research and analysis. You are solely responsible for any decisions made based on this research.
"As HARD EARNED MONEY IS YOUR's, So DECISION SHOULD HAVE TO BE YOUR's".
━━━━━━━━━━━━━━━━━━━━━━━━━━━━━━━━━
❇️ Follow notification about periodical View
💥 Do Comment for Stock WEEKLY Level Analysis.🚀
📊 Do you agree with this view?
✈️ HIT THE PLANE ICON if this technical observation resonates with you. It will Motivate me.
━━━━━━━━━━━━━━━━━━━━━━━━━━━━━━━━━
💡 If You LOOKING any CHART & want for Level and ANALYZE?
Share your desired stock names in the comments below! I will try to analyze the chart Levels, patterns and share my technical view (so far my Knowledge).
If Viewers think It can identify meaningful setups. Looking forward to hearing from all of you — let's keep this discussion going and help each other make better trading decisions.


banknifty pattern forming in expanding triyangle then down trend is completedtrend line patttern in support go to resistance trend line move in banknifty

BAJFINANCE: Nearing Reversal / Trend Finding Zone.BAJFINANCE Level Analysis: Intraswing for 27th+ JAN 2026
Aggressive traders can enter at this Level @ 925 - +28. Best Buy zone @ 915 - 921
__________&&&&&&_______
💥Level Interpretation / description:
L#1: If the candle crossed & stays above the “Buy Gen”, it is treated / considered as Bullish bias.
L#2: Possibility / Probability of REVERSAL near RLB#1 & UBTgt
L#3: If the candle stays above “Sell Gen” but below “Buy Gen”, it is treated / considered as Sidewise. Aggressive Traders can take Long position near “Sell Gen” either retesting or crossed from Below & vice-versa i.e. can take Short position near “Buy Gen” either retesting or crossed downward from Above.
L#4: If the candle crossed & stays below the “Sell Gen”, it is treated / considered a Bearish bias.
L#5: Possibility / Probability of REVERSAL near RLS#1 & USTgt
HZB (Buy side) & HZS (Sell side) => Hurdle Zone,
*** Specialty of “HZB#1, HZB#2 HZS#1 & HZS#2” is Sidewise (behaviour in Nature)
Rest Plotted and Mentioned on Chart
Color code Used:
Green =. Positive bias.
Red =. Negative bias.
RED in Between Green means Trend Finder / Momentum Change
/ CYCLE Change and Vice Versa.
Notice One thing: HOW LEVELS are Working.
Use any Momentum Indicator / Oscillator or as you "USED to" to Take entry.
━━━━━━━━━━━━━━━━━━━━━━━━━━━━━━━━━━━━━━━━━━━
⚠️ DISCLAIMER:
The information, views, and ideas shared here are purely for educational and informational purposes only. They are not intended as investment advice or a recommendation to buy, sell, or hold any financial instruments. I am not a SEBI-registered financial adviser.
Trading and investing in the stock market involves risk, and you should do your own research and analysis. You are solely responsible for any decisions made based on this research.
"As HARD EARNED MONEY IS YOUR's, So DECISION SHOULD HAVE TO BE YOUR's".
━━━━━━━━━━━━━━━━━━━━━━━━━━━━━━━━━
❇️ Follow notification about periodical View
💥 Do Comment for Stock WEEKLY Level Analysis.🚀
📊 Do you agree with this view?
✈️ HIT THE PLANE ICON if this technical observation resonates with you. It will Motivate me.
━━━━━━━━━━━━━━━━━━━━━━━━━━━━━━━━━
💡 If You LOOKING any CHART & want for Level and ANALYZE?
Share your desired stock names in the comments below! I will try to analyze the chart Levels, patterns and share my technical view (so far my Knowledge).
If Viewers think It can identify meaningful setups. Looking forward to hearing from all of you — let's keep this discussion going and help each other make better trading decisions.

Zero Hero Trade with LIMITED ExposureNIFTY
27th JAN expiry
25250 CE
CMP 25
buy 1 lot now
Add 1 more near or below 15
SL 0
Tgt 2x to 4x
PLEASE CONTROL YOUR GREED & GET IN WITH LIMITED EXPOSURE

Sensex/Gold Ratio Predicts the Cycle Bottom?The correlation coefficient between the Sensex index ( BSE:SENSEX ) and the MCX Gold Index ( FX_IDC:XAUINR ) is -0.077, suggesting that during market corrections, capital flows from risk assets (equity NSE:NIFTY ) to a safer haven, such as gold ( NSE:GOLDBEES ) .
Thus, this chart depicts the relative strength between these two asset classes. Since 1991, the chart has been swaying between 5 and 14 levels. The 14-level potential ends the dominance of equity over gold, starting a bear run. The 5-level potential ends the dominance of gold over equity, starting a bull run.
In the last 2 years, Gold has yielded 135% returns, whereas Sensex has given only 15% upside. With the current market correction, the ratio stands at 5.9, suggesting that we may have some more pain in the near term, but the bottom is not far.
I believe the index will complete its 10% correction from all time high before forming a bottom.

XAUUSD – Bullish continuation, ATH expansion activeGold continues to trade within a strong bullish channel, maintaining its ATH expansion structure. The recent pullback is corrective in nature and shows clear signs of liquidity absorption rather than distribution. On the macro side, sustained USD weakness, safe-haven flows, and a still-cautious Fed outlook keep gold supported at elevated levels.
➡️ This environment favors trend continuation, not top-picking.
Structure & Price Action
H1 structure remains bullish with Higher Highs and Higher Lows intact.
The recent drop has respected key demand zones and the ascending trendline.
No bearish CHoCH confirmed → downside moves remain corrective.
Price is rebalancing after an impulsive leg, preparing for the next expansion.
Key takeaway:
👉 Pullbacks are opportunities to position with the trend, not signs of reversal.
Trading Plan – MMF Style
Primary Scenario – BUY the Pullback
Focus on patience and structure confirmation.
BUY Zone 1: 5,045 – 5,020
(Rebalance area + intraday demand)
BUY Zone 2: 4,985 – 4,960
(Trendline confluence + deeper liquidity)
➡️ Only execute BUYs after bullish reaction (rejection wicks / structure hold).
➡️ Avoid chasing price at highs.
Upside Targets (ATH Extension):
TP1: 5,106
TP2: 5,198 (upper extension zone)
Alternative Scenario
If price holds firmly above 5,106 without a meaningful pullback, wait for a break & retest to join continuation BUYs.
Invalidation
A confirmed H1 close below 4,960 would weaken the bullish structure and require a reassessment.
Summary
Gold remains in a controlled ATH expansion phase. As long as structure and demand zones hold, the path of least resistance stays to the upside. The MMF approach remains unchanged: buy pullbacks, follow structure, and let the trend do the work.

Nifty50 analysis(27/1/2026)Expiry.CPR: wide + descending cpr: consolidation day.
FII: -4,113.38 Sold
DII: 4,102.56 bought.
Highest OI: 25000 both PE and CE
Resistance: In 4hour candle the resistance lies 20ma and 200ma.
Support : recent low 24900.
conclusion:
My pov:
1.market can be choppy today because of high oi on both side and cpr indicates wide cpr. check both 4hour and daily candle for 200ma line.
2.any timeframe once the 200ma is crossed price can retest 200ma or can be fake breakout. also take support from there. bigger timeframe it hard to break 200ma line support.
3.today if price broke below 24900 in a day candle trend continues.
psychology fact:
A lazy mind creates a miserable future; a hardworking mind creates destiny.
note:
8moving average ling is blue colour.
20moving average line is green colour
50moving average line is red colour.
200moving average line is black colour.
cpr is for trend analysis.
MA line is for support and resistance.
Disclaimer:
Iam not Sebi registered so i started this as a hobby, please do your own analysis, any profit/loss you gained is not my concern. I can be wrong please do not take it seriously thank you.
