CALLED IT - Bitcoin $107K TO $66K (-40% DROP) 🚨 CALLED IT - $107K TO $66K (-40% DROP)
Remember my warning on October 18, 2025?
When everyone was screaming "TO THE MOON" at $107K, I showed you the bearish divergence and said:
"$104K breakdown could trigger a crash to $73K and $49K."
👉 RESULT: Bitcoin dropped from $107K → $66,700
That's -40% Correction, EXACTLY as predicted.
🔰PROFIT BOOKED:
→ Short from $107K to $66,700
→ $40,000+ per CRYPTOCAP:BTC move captured
→ Those who followed saved their portfolio from -40% destruction
🔰 WHAT THE CHART SHOWED:
✓ Weekly bearish divergence confirmed
✓ $104K support trendline broken
✓ Support 1 ($73K) - SMASHED
✓ Now testing $66K-$68K zone
✓ Support 2 ($48K) still possible if this breaks
🔰 THE LESSON:
This is WHY I always tell you: Never blindly follow moonboys.
Everyone wants to hear "$200K coming" but nobody wants to hear "protect your capital."
Retracements happen in EVERY market. Even in bull runs.
Am I bullish long-term? YES.
Do I ignore warning signs? NEVER.
🔰 If you followed this analysis, you either:
Saved your portfolio from -40% crash
Made massive profit on the short
Bought the dip at better prices
This is the power of REAL technical analysis, not hopium.
👉 Share this with someone who needs to see it.
More updates coming. Stay connected.
Trend Analysis

Patanjali looking at good positionRectangle is the boundary any side breakout will give a good momentum in that direction

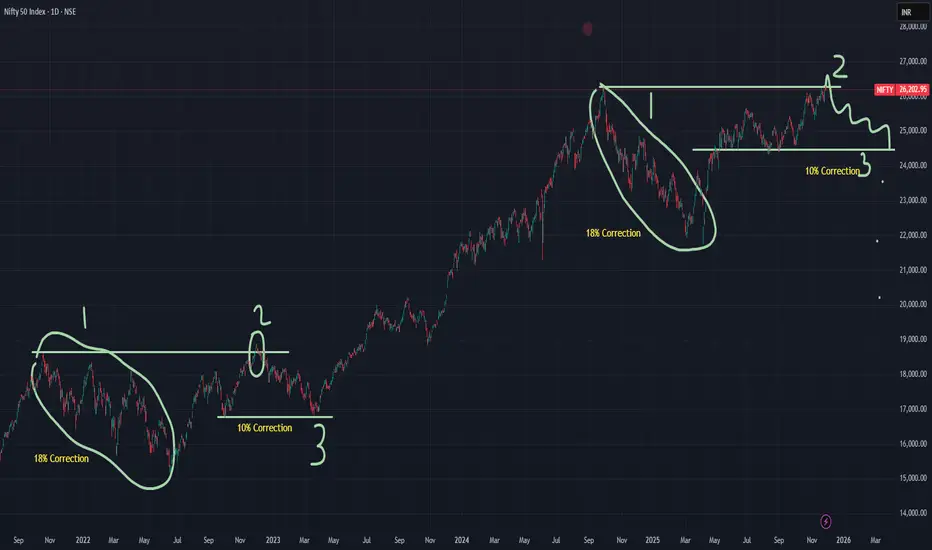
Nifty is showing a repeat pattern. Nobody can predict the direction of nifty. But we can observe the past pattern to help us take informed decision.
Nifty has touched a life time high, now if soon the high is not sustained then 10% correction is expected.
Please consult your financial advisor before investing.
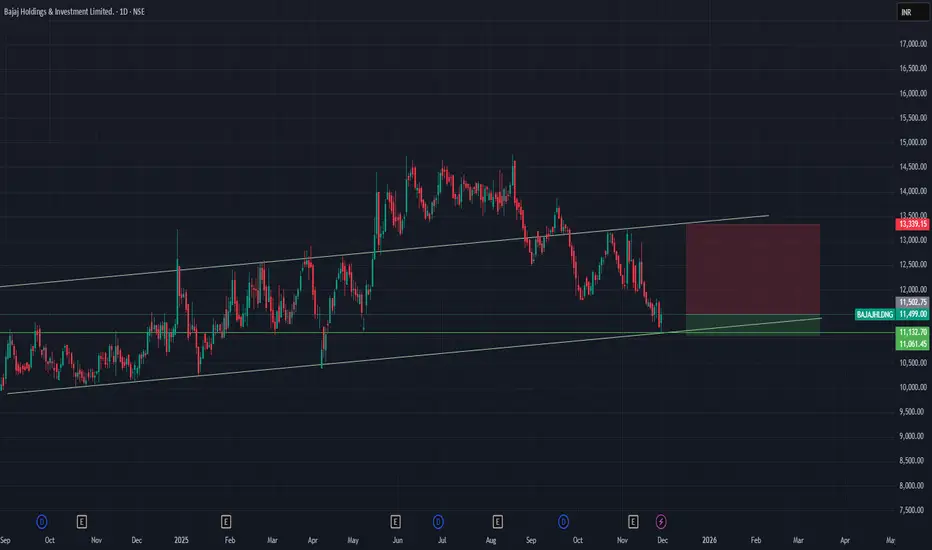
Bajaj Holding INvesting ready for 15% upsideBajaj Holding is ready for 15% upside. with small stop loss.
- RSI is 41
- On Support line
Please consult your financial advisor before investing.
NIFTY Spot Level Analysis for 05th Feb 2026+NIFTY Intra-Swing Level Analysis for 05th Feb 2026
🚀Follow & Compare NIFTY spot Post for Taking Trade
👇🏼Screenshot of NIFTY Spot All-day(04th FEB 2026) in 5 min TF.
━━━━━━━━━₹₹₹₹₹₹₹₹₹₹₹₹━━━━━━━━
💥Level Interpretation / description:
L#1: If the candle crossed & stays above the “Buy Gen”, it is treated / considered as Bullish bias.
L#2: Possibility / Probability of REVERSAL near RLB#1 & UBTgt
L#3: If the candle stays above “Sell Gen” but below “Buy Gen”, it is treated / considered as Sidewise. Aggressive Traders can take Long position near “Sell Gen” either retesting or crossed from Below & vice-versa i.e. can take Short position near “Buy Gen” either retesting or crossed downward from Above.
L#4: If the candle crossed & stays below the “Sell Gen”, it is treated / considered a Bearish bias.
L#5: Possibility / Probability of REVERSAL near RLS#1 & USTgt
HZB (Buy side) & HZS (Sell side) => Hurdle Zone,
*** Specialty of “HZB#1, HZB#2 HZS#1 & HZS#2” is Sidewise (behaviour in Nature)
Rest Plotted and Mentioned on Chart
Color code Used:
Green =. Positive bias.
Red =. Negative bias.
RED in Between Green means Trend Finder / Momentum Change
/ CYCLE Change and Vice Versa.
Notice One thing: HOW LEVELS are Working.
Use any Momentum Indicator / Oscillator or as you "USED to" to Take entry.
━━━━━━━━━━━━━━━━━━━━━━━━━━━━━━━━━━━━━━━━━━━
⚠️ DISCLAIMER:
The information, views, and ideas shared here are purely for educational and informational purposes only. They are not intended as investment advice or a recommendation to buy, sell, or hold any financial instruments. I am not a SEBI-registered financial adviser.
Trading and investing in the stock market involves risk, and you should do your own research and analysis. You are solely responsible for any decisions made based on this research.
"As HARD EARNED MONEY IS YOUR's, So DECISION SHOULD HAVE TO BE YOUR's".
━━━━━━━━━━━━━━━━━━━━━━━━━━━━━━━━━
❇️ Follow notification about periodical View
💥 Do Comment for Stock WEEKLY Level Analysis.🚀
📊 Do you agree with this view?
✈️ HIT THE PLANE ICON if this technical observation resonates with you. It will Motivate me.
━━━━━━━━━━━━━━━━━━━━━━━━━━━━━━━━━
💡 If You LOOKING any CHART & want for Level and ANALYZE?
Share your desired stock names in the comments below! I will try to analyze the chart Levels, patterns and share my technical view (so far my Knowledge).
If Viewers think It can identify meaningful setups. Looking forward to hearing from all of you — let's keep this discussion going and help each other make better trading decisions.

ABINFRA – Trade AlertCMP: 20.99
Breakout Context: Trendline + consolidation breakout confirmed today with strong volume, adding conviction.
- Target: 26.64 (+26.9%)
- Stop Loss: 19.30 (-8.0%)
- Risk/Reward Ratio: ~1 : 3.4
🔑 Key Notes
- Strong volume breakout suggests genuine momentum; monitor for retests.
- Healthy retest zone: 20.41 – 20.50 (as long as price holds above stop loss).
- Trail stop loss upward as price advances to secure gains.

BTCUSD (1H) – Bearish Continuation | Trendline Breakdown IdeaMarket Structure
Bitcoin remains in a clear descending channel on the 1H timeframe. Price has consistently respected the downward sloping trendline, confirming a strong bearish structure with lower highs and lower lows.
Technical Confluence
Trendline Resistance (Red): Multiple rejections validate seller dominance.
Auto Pitchfork: Price is trading below the median line, indicating continuation toward the lower parallel.
Dynamic Support (Green): The recent breakdown below channel support signals bearish continuation rather than a reversal.
Balance of Power (BoP): Reading around -0.38 reflects sustained selling pressure with no bullish divergence.
Price Action
A brief consolidation failed to hold, followed by a strong bearish impulse that broke key intraday support. The current move suggests momentum-driven continuation, not exhaustion.
Trade Idea
Bias: Bearish
Sell Zone: Pullback toward broken support / descending trendline
Targets:
First target: Previous minor low
Extended target: Lower pitchfork boundary / demand zone
Invalidation: Sustained close above the descending trendline
Conclusion
As long as BTC remains below the descending trendline and pitchfork median, the path of least resistance is downward. Any retracement into resistance is likely to be a selling opportunity unless market structure shifts.
Always manage risk and wait for confirmation.

EVEREADY | Trade SetupCurrent Market Price (CMP): 345.40
Breakout Context:
A trendline plus consolidation breakout has been confirmed today with strong volume, adding conviction to the move.
Target: 440 (approx. +27.4% from CMP)
Stop Loss: 316 (risk of about -8.5% from CMP)
Key Notes
- Breakouts accompanied by volume often indicate genuine momentum, but be prepared for possible retests of the breakout zone.
- If price dips toward 341.00–340.50 but holds above the stop loss, consider it a healthy retest.
- Trail your stop loss upward as price advances toward the target to secure gains and reduce risk.

Bull markets don’t start with excitement. They start with doubtIn December 2020, #Bitcoin crossed $20,000.
No hype.
No celebration.
Most people said, “It’s a trap.”
Four months later,
CRYPTOCAP:BTC was trading near $64,000.
📌 Bull markets don’t start with excitement. They start with doubt.
📌 Bear markets don’t start with panic.
They start with confidence like CZ and Michael Saylor have.
At the top, everyone feels smart.
Dips feel like gifts.
Bad news gets ignored.
Then price stops going up.
Hope turns into patience.
Patience turns into denial.
By the time panic arrives,
the bear market is already old.
📉 Tops feel safe.
📈 Bottoms feel scary.
That’s the other(present) side of the story.

FLAIR industries moving towards 194 cmp 301When you see this type of chart pattern mostly stock make one more dip to get liquidity near last bottom levels if it fails then bleeding will occurs but if it sustain you might see it will reverse and move towards 357 levels from there and if it breaks that it will be non stop rally. Also remember that it will likely to take 1+ year to form base.

Bearishness comingBelow 70, a downside of 64.5 is possible with selling pressure intact..
Sell - below 70
SL - 71.78
Target - 64.7

Bearish Rejection From Supply, Targets Below
Market Structure
Price previously made a blow-off top (sharp impulsive high, marked by the red arrow), followed by a strong bearish reversal, breaking short-term structure.
The subsequent bounce formed a lower high, confirming a bearish market structure shift on the intraday timeframe.
Key Zones
Gray zone (≈ 4,880–4,950): Former demand → now supply / resistance.
Price retested this area and rejected, which is classic bearish continuation behavior.
Blue zone (≈ 4,520–4,600): Major support / demand zone from the prior swing low.
Trade Idea Logic (as drawn)
Entry: Short on rejection from the gray supply zone after weak bullish retracement.
1st Target: Around 4,714 — interim support / liquidity pool.
2nd Target: The blue support zone — completion of the bearish leg and likely reaction area.
Price Action Clues
Retracement into resistance was corrective (overlapping candles), not impulsive → favors sellers.
Failure to reclaim the gray zone = sellers still in control.
Momentum points downward, aligning with the projected path.
Invalidation
A clean 45-min close and hold above the gray supply zone would weaken the bearish bias and suggest deeper consolidation or reversal.

Bearish continuation for BTCUSD📍 Primary Plan — Short the Pullback
✅ Entry Zone (Sell)
69,800 – 70,800
Reason:
Previous breakdown area
Intraday supply
Likely retest zone after bounce
🛑 Stop Loss
Above 71,300
Why:
Above last lower-high cluster
Above pullback structure
If price gets here → bearish idea weakens
🎯 Targets
Target Level Logic
T1 68,000 intraday support
T2 66,500 recent sweep zone
T3 65,000 next liquidity pocket
T4 60,000 Final stoppage
Scale out — don’t hold full size to last target.
🚀 Alternate Plan — Breakout Long (Only If Structure Shifts)
Right now this is counter-trend — so only trade if confirmed.
✅ Breakout Confirmation (Must Have)
15m candle close + hold above 71,000–71,200
Not just a wick — a body close + small pullback hold.
📍 Long Entry Zone
On retest of 71,000–71,200 after breakout
🛑 Stop Loss (Long)
Below 70,200
🎯 Long Targets
Target Level
T1 72,300
T2 73,100
T3 74,200
⚠️ Quick Reality Check (Important)
Right now:
Momentum = bearish
Structure = lower highs / lower lows
Best edge = short pullbacks, not blind longs
Breakout longs only after reclaim — no anticipation trades here 😄

Sharda Cropchem (D): Aggressive Bullish (Earnings-Led Re-rating)(Timeframe: Daily | Scale: Linear)
The stock has confirmed a major breakout from a 7-month consolidation ("The Box"). This is a high-quality breakout because it is supported by a fundamental turnaround (earnings explosion) and record volumes.
🚀 1. The Fundamental Catalyst (The "Why")
The technical explosion is fully justified by the numbers:
> Q3 Earnings Blowout: The 366% profit jump re-rated the stock overnight. The market is adjusting the price to reflect this new earnings reality.
> Dividend Yield: The interim dividend of ₹6 (Record Date: Feb 6) adds a "Carry" incentive for buyers to hold.
> Volume Significance: The "Huge Volume" is institutional accumulation. Funds are likely re-entering the stock after the strong guidance.
📈 2. The Chart Structure (Rectangle Breakout)
> The Box: The ₹760 – ₹1,160 trading range, the stock spent 7 months coiling in this zone.
> The Breakout: Today's close at ₹1,162.70 is the first valid daily close above this multi-year barrier. A breakout from such a deep base usually has long legs.
📊 3. Volume & Indicators
> RSI: RSI is rising in all timeframes. In "Blue Sky" breakouts (New ATH), RSI can stay above 70 (Overbought) for extended periods. Do not treat it as a sell signal yet.
> EMAs: The Positive Crossover (PCO) across all timeframes confirms the trend is in the strongest possible state ("Markup Phase").
🎯 4. Future Scenarios & Key Levels
The stock is now in "Price Discovery."
🐂 Bullish Targets (The Upgraded View):
- Target 1: ₹1,327
- Target 2: ₹1,560.
🛡️ Support (The "Must Hold"):
- Immediate Support: ₹1,119 – ₹1,150 . The breakout zone.
- Refinement: If the stock dips to ₹1,120 , it is a "screaming buy" opportunity. The sideways support of ₹760 is now too far away to be relevant for this momentum leg.
Conclusion
This is a Grade A+ Setup.
> Refinement: The combination of Record Earnings + New ATH + Volume is the "Holy Trinity" of trading setups.
> Strategy: Watchout for the price action in the coming days & hold for ₹1,327 .

$ETH is currently broken down 2,000CRYPTOCAP:ETH is currently trading around 1,987, slowly moving deeper into the yellow macro demand zone.
In 2022–2023, Ethereum spent months consolidating inside this same zone before any meaningful trend emerged
Again in March 2025, price broke below $2,000, entered this region, and consolidated for weeks
That consolidation ended with a strong reclaim on May 5, which ignited the next upside leg to ATH ( $4,956)
Now we’re back at the exact same area:
$2,000 is lost again
Price is accepting below it
Downside opens toward 1,800 → 1,650 → 1,500
🔼 If the zone holds
Sideways accumulation first
A clean reclaim above $2,000 would once again act as the short term bullish trigger

Why Bitcoin’s Stability Is a Warning, Not StrengthBitcoin’s inability to participate in the recent “debasement trade” is not a sign of hidden strength — it’s a sign of waning relevance in the current macro cycle.
While gold and silver surged during the final euphoric phase, Bitcoin’s stagnation near $82,000 suggests that capital actively chose hard assets over digital ones, not that Bitcoin avoided speculative excess. In other words, investors didn’t “miss” Bitcoin — they rejected it.
Rather than having “less froth to shed,” Bitcoin may simply lack incremental demand. The market has already priced in its scarcity narrative, ETFs, and institutional adoption. Without a new catalyst, stability becomes distribution, not consolidation.
The idea that liquidity exiting metals will rotate into crypto assumes that Bitcoin is viewed as a safe alternative store of value. Current flows argue the opposite: in periods of uncertainty, capital is choosing tangible, historically defensive assets, not high-volatility digital instruments.
Bitcoin’s scarcity also cuts both ways. Unlike gold and silver, Bitcoin has no industrial or sovereign demand floor. If speculative demand dries up, there is nothing to absorb sell pressure. Scarcity without utility can amplify downside, not protect against it.
If the Warsh nomination triggers prolonged global liquidity tightening, Bitcoin is likely to suffer more than metals, not less. Cryptocurrencies remain among the most liquidity-sensitive risk assets. Tightening doesn’t just pressure them — it starves them.
Bottom line
Bitcoin’s calm may not be coiled strength. It may be complacency before repricing.
In this view, metals already flushed excess and proved their role. Bitcoin still has to.


BTC Price going down According to current uncertainty in the world market. In my opinion now BTC is going down and testing the support level. #btc

NIFTY- Intraday Levels - 6th Feb 2026If NIFTY sustain above 25676/87/707 then 25742/83 then above this bullish above this wait more levels marked on chart
If NIFTY sustain below 25604/596 then 25968/54 below this bearish below this wait more levels marked on chart
Consider some buffer points in above levels.
Please do your due diligence before trading or investment.
**Disclaimer -
I am not a SEBI registered analyst or advisor. I do not represent or endorse the accuracy or reliability of any information, conversation, or content. Stock trading is inherently risky and the users agree to assume complete and full responsibility for the outcomes of all trading decisions that they make, including but not limited to loss of capital. None of these communications should be construed as an offer to buy or sell securities, nor advice to do so. The users understands and acknowledges that there is a very high risk involved in trading securities. By using this information, the user agrees that use of this information is entirely at their own risk.
Thank you.

Bearish Order Block Rejection & Demand SweepThe chart depicts a clear bearish structure following a significant drop from record highs near $5,600. After a period of aggressive selling, the price has formed a descending channel, characterized by lower highs and lower lows.

Double bottom created in Dmart 1) On support dmart have formed double bottom pattern
2) falling wedge pattern makes more confirmation that buyers are taking control now
3) In negative market stock didn't breakdown
4) In short term stock may reach 4300 levels with strict sl R:R is good

What is Multi confluence Strategy making ?In this video I am showcasing how to create multiple confluences and decrease the no of frequency of trades you get to filter out A+ setups .
I am using charts older than 3 months to showcase the same
