BTC 1D UpdateUpdate Jan 26, 2026: BTC rebounds +1.35% to $87,798 after weekend low at $86K, defending wedge support (yellow lines). Upside push testing $88K resistance, but down arrow signals potential rejection targeting $85K/$84K. Volume thin—watch for breakout above $90K or bearish flush.
Trend Analysis

Colgate cmp 2166.30 by Weekly Chart viewColgate cmp 2166.30 by Weekly Chart view
- Support Zone 1910 to 2050 Price Band
- Resistance Zone 2200 to 2350 Price Band
- Stock was making Lower High Lower Lows since last week of Sept 25
- Stock seems attempting uptrend from Support Zone over the last 2 weeks
- Volumes seemingly seen increasing over past few weeks by demand base buying
- Stock Price seems coming out of Bearish Falling Price Channel taking a Bullish momentum

Bitcoin Bybit chart analysis JENUARY 22Hello
It's a Bitcoin Guide.
If you "follow"
You can receive real-time movement paths and comment notifications on major sections.
If my analysis was helpful,
Please click the booster button at the bottom.
This is a 30-minute Bitcoin chart.
Nasdaq indicators will be released shortly at 10:30 AM and 12:00 PM.
*The blue finger path indicates a short-to-long switching or a long-position waiting strategy. (Two-Way Neutral Strategy)
1. Short position entry point at $90,870.1 above / Stop loss if the orange resistance line is broken.
2. Long position switch at $90,170.2 / Stop loss if the green support line is broken.
3. Long position switch at $92,456 / Stop loss if the red resistance line is broken.
4. Long position switch at $91,612.7 / Stop loss if the green support line is broken.
If the price falls directly without touching the blue finger at the top (90.8K),
Pink finger at the bottom (1st section), $89,335.7.
Long position waiting strategy / Stop loss is the same if the green support line is broken.
If the price falls below that point, it could fall up to two times, so be cautious of Nasdaq fluctuations.
Up to this point, I ask that you use my analysis for reference only.
I hope you operate safely, with a focus on principled trading and stop-loss orders.
Thank you.

BTC Confirms Bearish Structure After Neckline RejectionBTC Confirms Bearish Structure After Neckline Rejection
#Bitcoin has rejected the 94k–98k neckline resistance, confirming a bearish market structure.
➡️ Resistance: 94k–98k
➡️ Supports: 80k → 75k → 70k
Structure shows a confirmed Head & Shoulders Pattern Failed, Followed by a bear flag breakdown, trend remains decisively bearish.
Outlook:
Below 90k, downside continuation is favored.
Measured move points to 75k–70k (~22% downside).
Bullish bias only returns on a strong reclaim and acceptance above 92k.
Until then: sell the rallies, respect the trend.
Not financial advice. DYOR.

Crypto Altseason UpdateIt is going to come after btc completes its macro target 74k but till then alts gonna bleed hard. be careful in alts.

Formation of new waveJKL has completed the correction. Now This is the starting of new WAVE stopcoss just below the swing low. TGT minimum 1:3

DABUR: Bearish Head & Shoulders Pattern in the Making?Market Insights by Ayushi Shrivastava | NISM-Certified Research Analyst
The daily chart of DABUR is flashing an important technical warning signal.
As of January 26, 2026, a classic Head and Shoulders pattern appears to be forming, with price now hovering around ₹519 — right near a critical support zone.
This is a zone where the market usually makes a decision:
hold and bounce… or break and accelerate lower.
🔍 Technical Structure Breakdown
The chart clearly shows a three-peak formation:
• Left Shoulder: Formed during mid-2025
• Head: A much higher peak near ₹570–₹580 in late 2025
• Right Shoulder: Currently consolidating in the ₹520–₹540 zone
This symmetry strengthens the probability of a classical Head & Shoulders setup.
📌 Key Observations
• Neckline / Trendline Support:
An ascending green trendline is acting as the neckline of this pattern.
• Price Action:
DABUR is down -0.41% today with volume around 12.33M,
hovering just above this neckline — a classic pressure zone.
• Volatility Clue:
A previous measured move on the chart shows a historical fall of
-28.24% (-189.95 points), highlighting how sharp moves can get
once structure breaks.
🎯 Potential Outlook
If DABUR breaks and sustains below the ascending neckline,
it could trigger a bearish continuation move.
📍 Immediate support to watch: ₹500–₹510
(This zone previously acted as a strong base near the Left Shoulder.)
A clean breakdown below this area could open the door for
a deeper corrective phase.
🤔 Final Thought
Right now, DABUR is sitting at a make-or-break zone.
• Hold above neckline → possible range continuation or bounce
• Break below neckline → pattern confirmation + downside momentum
Markets don’t move on opinions.
They move on structure, levels, and participation.
What’s your view?
Is DABUR headed for a breakdown…
or will this trendline once again act as strong support? 👇
— Ayushi Shrivastava
NISM-Certified Research Analyst
⚠️ Disclaimer:
This analysis is for educational and informational purposes only and does not constitute financial, investment, or trading advice.
Stock market investments are subject to market risks. Past performance is not indicative of future results.
Please consult your financial advisor before taking any trading or investment decisions.

ABSLAMC – Price at a Critical Support Inside a Falling ChannelThe stock has been moving within a clear falling channel, showing a controlled downtrend over time.
Every attempt to move higher has faced rejection near the upper trendline, keeping the overall structure weak.
Recently, price bounced from the lower channel and moved up, but once again got rejected near resistance and is now back near an important support zone.
This level is crucial because buyers have previously reacted from this area.
👉 If the support holds and price stabilizes, a short-term bounce toward the upper channel is possible.
👉 If this support breaks decisively, it could open the door for further downside continuation within the trend.
For now, this is a key decision zone — watching how price behaves here will give the next directional clue.

Part 1 Candle Stick Pattern Call Options Explained
A Call Option gives the buyer the right to buy the underlying asset at a specified strike price before or at expiry.
Example:
Stock price: ₹100
Call strike price: ₹105
Expiry: 1 month
Premium paid: ₹3
If the stock rises to ₹115:
Intrinsic value = ₹10
Profit = ₹10 − ₹3 = ₹7
If the stock stays below ₹105:
Option expires worthless
Maximum loss = premium paid (₹3)
Use Cases:
Bullish market view
Leverage with limited downside
Substitute for stock ownership

DCM Shriram Approaches Long-Term Support – Reaction Zone AheadDCM Shriram continues to trade within a well-defined long-term rising channel, respecting higher highs and higher lows over time. Each major rally has been followed by a healthy pullback toward the lower trendline, where buyers have consistently stepped in to defend the trend.
The current move is another structural retracement, not a random sell-off. Price has now returned to the channel’s base — a zone that has previously acted as strong demand and launched multiple upside swings.
This area becomes a crucial reaction zone:
• If price holds and stabilizes here, it keeps the broader uptrend intact and opens room for another move toward the upper boundary of the channel.
• A decisive breakdown below the channel would signal weakening structure and potential trend shift.
Volume behavior also supports a corrective phase, with stronger participation during rallies and lighter activity during pullbacks — typical of healthy trending markets.
For now, patience is key. Let the market show its hand at this support instead of predicting the next move.
Structure will always speak louder than short-term noise.

Tata Seel Long towards new horizonVery strong commodity market will be bullish for Tata Steel
Buy @CMP 187
tgt 208,229,254
stoploss 168

NIFTY Update Last Support 24500NSE:NIFTY
previously i posted nifty analysis but that became trap
nifty is stand near to support clusters.
there are no pullback in current down trend so pullback can also possibly and that pullback become breakout rally but this is possibility. pullback also continue the down rally that also possibility.
last support is 24500
this is not a any types of advice.
this is a just chart analysis and that can be wrong.
do your own research.

PAYTM KARO ONE97 COMMUNICATIONS NSE:PAYTM
Paytm karo varna stock ko niche karo 😅😅
Paytm take strong resistance from his major resistance and also do classical pattern consolidation after breaking down that is double confirmation for trend direction.
now, 1000 is major support
this is not a any types of advice.
this is just chart analysis
do your own research

Eternal Zomato shows strong weakness NSE:ETERNAL
Zomato Near to end his up trend
major support is break near 300 and retested that level and gave another strong down move in daliy time frame. that retest also brakes another support with volume and big move.
chart picture explain all things.
next major support is gap is 230 and that whole zone till 200.
this is not any types of advice.
this is just chart analysis.
do your own research

$TVC:SILVER MOON MISSION:2025-29 is History Repeating Again? TP?🚀 Silver Feature Analysis 2026 – 2029: The Historical Repeat 🚀
TVC:SILVER has recently hit its All-Time High (ATH) three times in history with massive rallies. My analysis is based on the duration and percentage returns of these specific periods:
1️⃣ 1980: (1 Aug 1979 to 29 Jan 1980) – A 6-month rally with returns OVER 511% ($6.5 to $48). 📈
2️⃣ 2011: (1 Oct 2008 to 22 Apr 2011) – A 2y 6m 21 days rally with returns OVER 451% ($8.4 to $47.91). 📈
3️⃣ 2021: (2 Mar 2020 to 10 Feb 2021) – An 11m 8 days rally from $11.63 to $30.09. 📈
🔍 The Current Assumption 🔍
The ongoing rally started on 3 Feb 2025 and is continuing to the present day. Based on price action, silver has been manipulated many times (like in 1980, 2011, and 2021), and I expect this to happen again in the upcoming years of 2028-2029. ⚠️
🎯 Near-Term Goal: This rally is projected to go up to $119 – $129.88. 🔄 The Reversal: After hitting those levels, I anticipate a small reversal back to the $102 – $105 per ounce range. 📉 ⚡ The Final Leg: In Sep 2026 to Nov 2026, we could see a continuation, eventually reaching levels of $179 – $185 in the year 2028-2029 as silver repeats its historic data! 🚀🔥
📑 Key Support & Resistance Levels 📑
Based on the cycles, here are the critical levels to watch:
Year Support Resistance
1979-80 $6.5 $48
2008-11 $8 $47.91
2020-21 $11.63 $30.09
2025-28 $30.97 🟢 $129 - $169 🔴
2025-29 $79 - $86 🟢 $110 - $119 🔴
📊 Technical Snapshot (Current Stats) 📊
🟢 Trend: BULLISH (MTF Trend) 💪 ADX: 44.3 (Strong Trend Energy) 🔥 RSI: 94.5 (Extreme Momentum - Use Caution) ✅ Trade Mode: 🟢 LONG ONLY TILL RESISTANCE 🟢 🎯 Target Projection: Rally expected till the $129.44 level.
💡 Conclusion 💡
History is repeating! 🔁 After the accumulation that started on 03 Feb 2025, silver is on a path to mirror its 1980 and 2011 performance. Watch the $129 level closely for the first major milestone. 🏁💎
⚠️ RISK WARNING & DISCLAIMER ⚠️
This analysis is for educational and informational purposes only. Trading precious metals involves high risk. The projections mentioned (such as the $129 and $185 targets) are based on historical fractal data and current technical indicators, but market conditions can change due to global economic factors. Always do your own research (DYOR) and consult with a financial advisor before making any investment decisions. Past performance is not indicative of future results. 🛑

USDCHF trading above Decisive zoneThe USDCHF is currently at a critical "decision zone" after a period of significant volatility. Following a sharp decline earlier this week, price action is now signaling a potential shift in momentum.
1. Key Support Validation
The pair successfully tested a major support zone near 0.7870 – 0.7880. This area is historically significant (acting as a base for major rallies in late 2025) and has once again triggered a strong "buy the dip" response. The rejection at these lows suggests that the bears are losing steam at these psychological levels.
2. Rising Channel Formation
On the lower timeframes (15m), we are observing a Junior Ascending Channel.
The Structure: Price is carving out higher highs and higher lows, respecting the lower trendline of this corrective channel.
The Sentiment: This indicates a steady accumulation by bulls, though it remains a "corrective" move within a larger bearish trend.
3. The "Decision Zone" Strategy
The pair is currently approaching a confluence of resistance. For a sustained reversal, traders should watch the following:
Bullish Breakout: A clean break and hold above the 0.7920 resistance zone would confirm the recovery and target 0.7960.
Bearish Continuation: If the price fails at the upper boundary of the rising channel, we could see a "Bear Flag" play out, leading to a retest of the recent 0.7878 lows.

NASDAQ bullish bias on HTF and ITFThe price is currently reacting to THE DAILY FAIR VALUE GAP , which is a good confluence for bullish and long clarity, as the dollar continues to freefall , we can consider the relative strength between the index and the currency to support our long idea.
The closest target would be the recents 4 hour highs.
Wait until 9:30 openin for any manipulation to frame our trade.
Invalidation :- closing below the (dfvg)

NIFTY - At crucial levelsNIFTY :
Double top breakdown done on weekly (very strong resistance around 26300 levels (yellow))
Currently clinging on to trendline support
Breaking this could add more pain

NZDJPY at very important junctureIf this pair holds this zone then target will be 93.40
but if it breaks below then target will be 92.10
Lets see how it unfolds on monday.

Intraday Institutiona TradingWhat Is an Option?
An option is a derivative contract whose value is derived from an underlying asset such as a stock, index, commodity, or currency.
Each option contract gives:
The buyer the right (not obligation)
The seller (writer) the obligation
to transact the underlying asset at a fixed price (strike price) on or before a specified date (expiry).
Key Types of Options
Call Option
Put Option

USDINR at Key Resistance – Break or Rejection?USDINR is currently trading near the upper boundary of a well-defined rising channel — a zone where price has historically faced strong rejection and profit booking.
This rally has been structural, not random. Price has respected the channel multiple times, creating higher highs and higher lows, showing steady demand for dollars over the rupee. However, every strong trend eventually meets a decision zone — and this upper band is one of them.
What makes this level more important is the timing.
The Union Budget is approaching — an event that directly impacts fiscal deficit, foreign flows, inflation expectations, and overall confidence in the Indian economy. Historically, such macro events act as catalysts, increasing volatility in USDINR and often triggering major reactions from key technical levels.
At this stage, USDINR is not about prediction — it’s about reaction.
• A sustained move and acceptance above this resistance zone could signal continuation of the bullish structure with momentum.
• A sharp rejection from here would indicate profit booking and a possible pullback toward the channel support.
In trending markets, price usually respects structure first — news simply accelerates the move.
Right now, structure is stretched, and sentiment is waiting for a trigger.
This zone will decide whether USDINR expands higher or breathes before the next leg.
Patience and price behavior near resistance will reveal the real story.

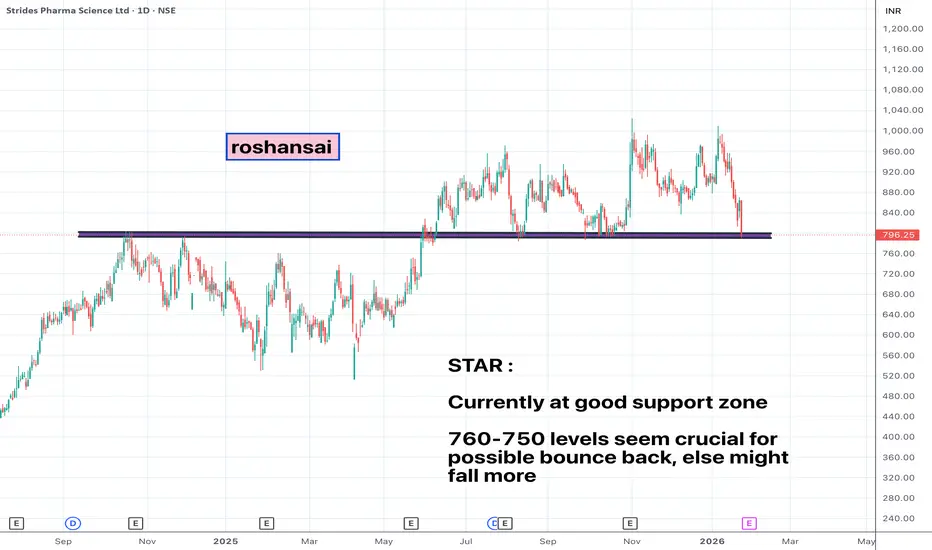
STAR - Support ZoneSTAR :
Currently at good support zone
760-750 levels seem crucial for possible bounce back, else might fall more
Intraday Institutiona Trading Introduction to Option Trading
Option trading is a sophisticated financial strategy that allows investors and traders to buy or sell the right—but not the obligation—to trade an underlying asset at a predetermined price within a specific time period. Unlike traditional stock trading, where profits depend primarily on price movement direction, option trading enables participants to profit from price movement, volatility, time decay, and even stagnation.
Options are widely used across global financial markets, including equities, indices, commodities, currencies, and cryptocurrencies. They serve multiple purposes: hedging risk, generating income, speculation, and portfolio optimization.
While option trading can offer high reward potential, it also carries complexity and risk. A deep understanding of its mechanics is essential before participating actively.
