INDIAN BOND MARKET IS SET FOR CRASH - HEADED TO 16%With rae cuts by RBI in last 1 year, seems like a eyewash, reality will soon catch up. RBI will be forced to increase interest rates with Bond market slated to crash and yield spikinng to insane 16% or more levels
Trend Analysis

BUY TODAY SELL TOMORROW for 5% DON’T HAVE TIME TO MANAGE YOUR TRADES?
- Take BTST trades at 3:25 pm every day
- Try to exit by taking 4-7% profit of each trade
- SL can also be maintained as closing below the low of the breakout candle
Now, why do I prefer BTST over swing trades? The primary reason is that I have observed that 90% of the stocks give most of the movement in just 1-2 days and the rest of the time they either consolidate or fall
Trendline Breakout in APLAPOLLO
BUY TODAY SELL TOMORROW for 5%

Candle Patterns in Technical AnalysisCandle patterns are formations created by Japanese candlesticks on a chart, indicating market sentiment and potential price movements. Here are some common ones:
Bullish Patterns- Hammer: Indicates potential reversal from bearish to bullish.
- Bullish Engulfing: Indicates reversal from bearish to bullish.
- Morning Star: Indicates reversal from bearish to bullish.
Bearish Patterns- Shooting Star: Indicates potential reversal from bullish to bearish.
- Bearish Engulfing: Indicates reversal from bullish to bearish.
- Evening Star: Indicates reversal from bullish to bearish.
Indecision Patterns- Doji: Indicates indecision in market.
- Spinning Top: Indicates indecision.

Chart Patterns in Technical AnalysisChart patterns are formations created by price movements on a chart, helping traders predict future price movements. Here are some common ones:
Reversal Patterns- Head and Shoulders: Indicates a reversal from bullish to bearish.
- Inverse Head and Shoulders: Indicates a reversal from bearish to bullish.
- Double Top: Bearish reversal pattern.
- Double Bottom: Bullish reversal pattern.
Continuation Patterns- Triangle: Can be bullish or bearish, indicates continuation.
- Pennant: Indicates continuation of trend.
- Flag: Indicates continuation of trend.
Other Patterns- Cup and Handle: Bullish pattern indicating continuation.
- Wedge: Can indicate reversal or continuation.

NIFTY Analysis for 28th JAN 2026: IntraSwing Spot levelsNIFTY Analysis for 28th JAN 2026: IntraSwing Spot levels
👇🏼Screenshot of NIFTY Spot All-day(27th Jan 2026) in 3 min TF
💥💥HARMONIC BEARISH BUTTERFLY in Progress.💥💥
🚀Follow GIFTNIFTY Post for NF levels
^^^^^^^_______^^^^^^^
💥Level Interpretation / description:
L#1: If the candle crossed & stays above the “Buy Gen”, it is treated / considered as Bullish bias.
L#2: Possibility / Probability of REVERSAL near RLB#1 & UBTgt
L#3: If the candle stays above “Sell Gen” but below “Buy Gen”, it is treated / considered as Sidewise. Aggressive Traders can take Long position near “Sell Gen” either retesting or crossed from Below & vice-versa i.e. can take Short position near “Buy Gen” either retesting or crossed downward from Above.
L#4: If the candle crossed & stays below the “Sell Gen”, it is treated / considered a Bearish bias.
L#5: Possibility / Probability of REVERSAL near RLS#1 & USTgt
HZB (Buy side) & HZS (Sell side) => Hurdle Zone,
*** Specialty of “HZB#1, HZB#2 HZS#1 & HZS#2” is Sidewise (behaviour in Nature)
Rest Plotted and Mentioned on Chart
Color code Used:
Green =. Positive bias.
Red =. Negative bias.
RED in Between Green means Trend Finder / Momentum Change
/ CYCLE Change and Vice Versa.
Notice One thing: HOW LEVELS are Working.
Use any Momentum Indicator / Oscillator or as you "USED to" to Take entry.
━━━━━━━━━━━━━━━━━━━━━━━━━━━━━━━━━━━━━━━━━━━
⚠️ DISCLAIMER:
The information, views, and ideas shared here are purely for educational and informational purposes only. They are not intended as investment advice or a recommendation to buy, sell, or hold any financial instruments. I am not a SEBI-registered financial adviser.
Trading and investing in the stock market involves risk, and you should do your own research and analysis. You are solely responsible for any decisions made based on this research.
"As HARD EARNED MONEY IS YOUR's, So DECISION SHOULD HAVE TO BE YOUR's".
━━━━━━━━━━━━━━━━━━━━━━━━━━━━━━━━━
❇️ Follow notification about periodical View
💥 Do Comment for Stock WEEKLY Level Analysis.🚀
📊 Do you agree with this view?
✈️ HIT THE PLANE ICON if this technical observation resonates with you. It will Motivate me.
━━━━━━━━━━━━━━━━━━━━━━━━━━━━━━━━━
💡 If You LOOKING any CHART & want for Level and ANALYZE?
Share your desired stock names in the comments below! I will try to analyze the chart Levels, patterns and share my technical view (so far my Knowledge).
If Viewers think It can identify meaningful setups. Looking forward to hearing from all of you — let's keep this discussion going and help each other make better trading decisions.

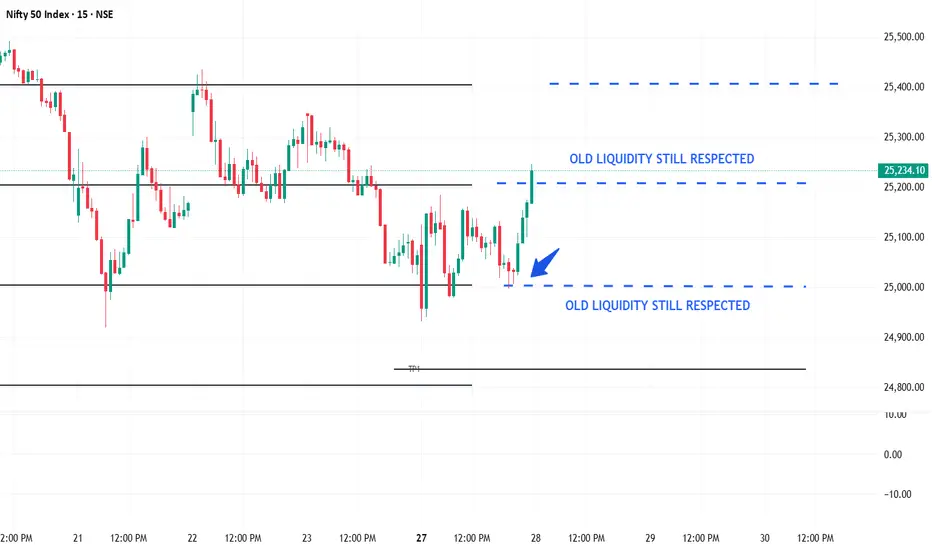
NIFTY“Yesterday marked liquidity zones, today price reacted perfectly again.
Old liquidity continues to act as strong support/resistance.
No indicators, pure price action & patience
HDFCBANK Lead the Pre-Budget Rally - Lead Turnover Stock HDFCBANK Lead Turnover Stock Level analysis for 28th JAN 2026
Lead the Pre-Budget Rally.
👇🏼Screenshot: All-day (27th Jan 2026) in 5 min TF..
💥Level Interpretation / description:
L#1: If the candle crossed & stays above the “Buy Gen”, it is treated / considered as Bullish bias.
L#2: Possibility / Probability of REVERSAL near RLB#1 & UBTgt
L#3: If the candle stays above “Sell Gen” but below “Buy Gen”, it is treated / considered as Sidewise. Aggressive Traders can take Long position near “Sell Gen” either retesting or crossed from Below & vice-versa i.e. can take Short position near “Buy Gen” either retesting or crossed downward from Above.
L#4: If the candle crossed & stays below the “Sell Gen”, it is treated / considered a Bearish bias.
L#5: Possibility / Probability of REVERSAL near RLS#1 & USTgt
HZB (Buy side) & HZS (Sell side) => Hurdle Zone,
*** Specialty of “HZB#1, HZB#2 HZS#1 & HZS#2” is Sidewise (behaviour in Nature)
Rest Plotted and Mentioned on Chart
Color code Used:
Green =. Positive bias.
Red =. Negative bias.
RED in Between Green means Trend Finder / Momentum Change
/ CYCLE Change and Vice Versa.
Notice One thing: HOW LEVELS are Working.
Use any Momentum Indicator / Oscillator or as you "USED to" to Take entry.
━━━━━━━━━━━━━━━━━━━━━━━━━━━━━━━━━━━━━━━━━━━
⚠️ DISCLAIMER:
The information, views, and ideas shared here are purely for educational and informational purposes only. They are not intended as investment advice or a recommendation to buy, sell, or hold any financial instruments. I am not a SEBI-registered financial adviser.
Trading and investing in the stock market involves risk, and you should do your own research and analysis. You are solely responsible for any decisions made based on this research.
"As HARD EARNED MONEY IS YOUR's, So DECISION SHOULD HAVE TO BE YOUR's".
━━━━━━━━━━━━━━━━━━━━━━━━━━━━━━━━━
❇️ Follow notification about periodical View
💥 Do Comment for Stock WEEKLY Level Analysis.🚀
📊 Do you agree with this view?
✈️ HIT THE PLANE ICON if this technical observation resonates with you. It will Motivate me.
━━━━━━━━━━━━━━━━━━━━━━━━━━━━━━━━━
💡 If You LOOKING any CHART & want for Level and ANALYZE?
Share your desired stock names in the comments below! I will try to analyze the chart Levels, patterns and share my technical view (so far my Knowledge).
If Viewers think It can identify meaningful setups. Looking forward to hearing from all of you — let's keep this discussion going and help each other make better trading decisions.

XAUUSD trying to fill gapWe are seeing XAUUSD approach a significant area of interest. The zone between $4,930 and $4,946 (highlighted on the chart) is currently acting as a magnet for price.
There is a notable Gap just above this zone that trying to be filled. How the price reacts at the $4,930-$4,946 floor will dictate the trend for the coming days.
Primary Target: $5,070 (on a bounce from gap zone or from decider zone)
Secondary Target: $4,835 (on a breakdown below decider zone)
Use SL small to capture big move with better R:R

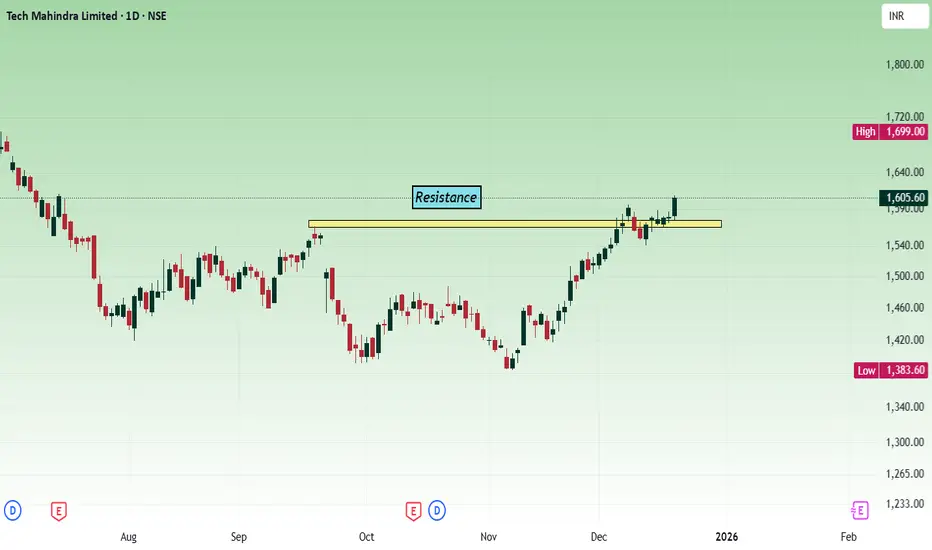
TechM - Multi time frame analysisThe price has broken the resistance at the 1560 - 1580 zone, unable to sustain, fall back and once again took support. Today's movement shows bullish strength.
As per the daily chart, the price has broken the trend line. Strong weekly close will confirm the bullish movement.
Buy above the 1595 - 1602 zone with the stop loss of 1580 for the targets 1616, 1630, 1648 and 1662. This analysis is for the short term.
Price should show bullish strength at the 1580 - 1600 zone. Watch how the price is showing the strength before taking any trade.
ADANIENSOL at key decision zone.ADANIENSOL is currently trading at a high-stakes "Make or Break" level on the 15-minute timeframe. After a sharp intraday decline of over 10% today, the price has plummeted directly into a Decisive Historical Zone (₹792 – ₹807).
The stock is under pressure today following reports that the US SEC is seeking to serve summons to group executives regarding a civil securities case.
The company also reported Q3 results yesterday, showing a record EBITDA of ₹2,210 crore (up 21%), though net profit saw a slight decline due to a one-time tax adjustment from the previous year.
Intraday volatility has surged to over 8%, with a massive 21% jump in Open Interest (OI), suggesting aggressive new positions are being built at these levels.
Look for a reversal from this zone. If the price breaks upside with strong volume from 807, the initial target is ₹865.
Safe Entry: For extra confirmation, wait for a sustain above ₹833 to ensure the immediate selling pressure has cooled for target 888
if the stock fails to hold the ₹791 level on a 15-min closing basis, target: ₹762 (next major psychological support).
I am not sebi registered financial advisor.

Part 1 Intrday Institutional Trading Role of Institutions & Smart Money in Options
Institutions dominate the option markets.
They control the market using:
Delta hedging
Gamma scalping
Liquidity creation
Option selling walls
Volume absorption
Understanding their footprints helps predict:
Support zones
Resistance zones
Directional bias
Volatility behavior

PNB right now inside a demand zonePNB is currently sitting at a critical juncture on the 15-minute timeframe. After a sharp correction from the ₹135 levels, the price has landed directly into a Decisive Demand Zone (₹119.50 – ₹120.60). Historically, this zone has acted as a strong "springboard" for the stock, attracting buyers and halting previous declines.
Price is currently testing the lower boundary of this zone. A reversal or a breakdown here will likely dictate the trend for the final week of January.
Bullish Case (Buy): If price sustains above the zone and breaks with a spike in volume, then target: ₹124
Bearish Case (Sell): If price closes decisively below ₹119.30 on the 15-min candle, then target: ₹116
This analysis is for educational purposes only. Please consult your financial advisor before trading.

Part 5 Advance Option Trading How Option Trading Works – Step-by-Step
You choose a strike price based on your directional view.
You decide whether to buy the option or sell it, depending on your risk appetite.
If you expect strong movement, you typically buy.
If you expect sideways movement, you typically sell.
When market moves in your direction, premium increases.
When market moves against you, premium decreases.
Premium also falls automatically due to theta decay, especially near expiry.
Option chain helps identify support and resistance based on OI built-up.
Volume profile shows where big institutions executed trades.
Market structure tells you whether to buy CE, PE, or sell options.

Bitcoin Bybit chart analysis JENUARY 26
Hello
It's a Bitcoin Guide.
If you "follow"
You can receive real-time movement paths and comment notifications on major sections.
If my analysis was helpful,
Please click the booster button at the bottom.
This is a Bitcoin 30-minute chart.
There are no Nasdaq indicators released.
*If the red finger moves,
this is a long position strategy.
1. Confirm the first touch of the purple finger at the top
-> Red finger: $87,538.8, long position entry point
/ Stop-loss price if the green support line is broken
2. $89,210.1, long position first target -> Top: second target
If the strategy is successful, 88.6K is the long position re-entry point.
If the top falls immediately without touching the first point,
Long hold at the second point / Stop-loss price if the green support line is broken
From the green support line breakout, the bottom point / sideways market. Below that, the most important support line remains at $85,238.3.
Please note that if this point is broken, a prolonged correction is possible.
Up to this point, I ask that you use my analysis for reference only.
I hope you operate safely, with a focus on principled trading and stop-loss orders.
Thank you.

Gold 5200/1h ChartGold moving in channel from last 10 days. I believe breaking the 5110 level will put gold to new high of 5200. Although I don't see this happing today. Failing to do so might trigger a profit booking as it has already moved 15% from previous high (+last 7 days green candle closing).
Be vigilant with SL, and don't go all in.

$RIVER Turned $1K Into $52K In 41 Days But Here’s Why I’m Not BuCRYPTOCAP:RIVER Turned $1K Into $52K In 41 Days But Here’s Why I’m Not Buying
CRYPTOCAP:RIVER Pumped 5,221% In 41 Days. From $1.616 (Dec 17) → $86 (Yesterday)
What Caused This Pump?
🔹 Arthur Hayes + Justin Sun ($8M) Backed It
🔹 $12M Funding Round With Big Investors
🔹 Sui Network Partnership
🔹 Listed On Binance, OKX, Bybit, Coinone
🔹 Only 20% Tokens In Circulation
🔹 One Whale Bought 50% Supply At $4
⚠️ My Warning:
👉 Don’t Try To Catch This Knife Now
👉 Strong Support Is At $8–$12 - High Chance Price Revisits $10–$15
👉 Fresh Longs At ATH = Very Risky
Key Risks:
🔴 Whale Controls 50% Supply: Dump Risk Anytime
🔴 Pump Driven By Leverage, Not Organic Demand
🔴 80% Tokens Still Locked
Conclusion:
Wait For A Proper Pullback
Don’t Become Exit Liquidity
DYOR
My Take:
Good Project, Very Risky Price Right Now
Wait For Cooldown Or Proper Structure
FOMO Is Not A Strategy

It seems silver is going to loose its shine soonSilver (XAGUSD) prices are near all time high, hovering near the VAH logarithmically on monthly chart. Highly cautious period next one or two months. Keep watching !!

MAJOR INDEX OUTLOOK | NASDAQ (US100) Market Structure Update Global indices are currently approaching critical decision zones, and NASDAQ (US100) is showing a
notable shift in short-term market sentiment.
After a prolonged corrective phase, the H1 time frame now confirms a bullish structural transition —
price is forming Higher Highs and Higher Lows, indicating that buyers are gaining short-term control.
However, the index is now testing a major resistance zone near 26,000 — a psychological level combined
with historical supply pressure.
This is a decisive area.
Key Technical Levels
🔺 Major Resistance:
26,000 (Psychological Level)
26,150 (Recent Swing High)
🔻 Immediate Support:
25,750
🔻 Structural Support:
25,600
Scenario 1: Bullish Breakout Continuation
A strong H1 candle close above 26,050 could trigger continuation momentum.
Upside Targets:
➡️ 26,200
➡️ 26,350
A breakout followed by a clean retest of 26,000 as support would offer higher-probability confirmation.
Scenario 2: Bearish Rejection
If price fails to sustain above 26,000–26,050 and prints rejection wicks or bearish confirmation,
a corrective pullback may follow.
Downside Targets:
➡️ 25,750
➡️ 25,600
Lower-high confirmation on M15 would strengthen the rejection case.
Market Note
NASDAQ is highly volatile during impulsive phases. Entering directly into resistance without
confirmation increases risk exposure significantly.
Disciplined execution and controlled position sizing remain essential.
Current Bias: Short-Term Bullish (Caution at 26,000 Resistance)
The reaction around 26,000 will likely determine the next 150–300 point directional move.
#NASDAQ #US100 #IndexTrading #MarketStructure #ForexAnalysis #TechnicalAnalysis #MustProfitFX
Disclaimer: This content is for educational purposes only. Trading involves significant risk.

Part 4 Technical Analysis VS. Institutional Option TradingOption Trading in Trending vs. Range-Bound Markets
1. Trending Market
Buyers → High reward
Sellers → Increased risk
Look for:
Market structure break
Volume surge
Imbalance zones
Clearing of option OI levels
2. Range-Bound Market
Sellers → Consistent profits
Buyers → Theta decay damage
Indicators:
High HVN
OI build-up on both sides
Low IV environment

NAUKRI - Shorting opportunity?!!!Naukri - Info edge is consistently making highs and lower highs and lows and lower lows
Its been forming a channel pattern...which is perfectly visible...
Targets and sl levels as mentioned @ chart!!!
This bearish view goes nullified on making the higher high(sl level)
Let's wait and watch!!!
Just my view...not a tip nor advice!!!!
Thank you!!!

Part 3 Technical Analysis VS. Institutional Option TradingHow Option Pricing Works
Option pricing is influenced by market structure, volatility, liquidity, and hedging flows.
Three components determine premium:
Intrinsic Value
For Call Option:
Max(Spot price – Strike price, 0)
For Put Option:
Max(Strike price – Spot price, 0)
Time Value
Extra value based on:
Time left to expiry
Volatility
Market expectations
Demand & supply
As expiry approaches:
Time value decays → Premium decreases
This is called theta decay.
Implied Volatility (IV)
IV measures the market’s expectation of future movement.
High IV → High premiums
Low IV → Low premiums
Events that cause IV spikes:
Budget announcements
RBI policy decisions
Elections
Global news
Understanding IV is essential for timing entry, especially for option sellers.

Will DALBHARAT give 20% returns? cmp 2105Stock Update - *Dalmia Bharat cmp 2108*
Stock has corrected around 22% from its recent high and taken support near the 1932 - 1995 on weekly demand zone.
In the latest quarter, Dalmia Bharat reported a significant improvement in Q3 earnings compared to the previous quarter.(QoQ)
Technically, a key support zone is holding and price action from here suggests a potential bullish turn. Major upside resistance placed at 2400
*8% to 20% Upside Potential*

CONCOR 1 Day Time Frame 📊 CONCOR — 1‑Day Time Frame Key Levels (Indicative)
Current Price (recent session)
• ~₹478–₹480 (down intraday) — trading near session lows.
🔁 Pivot & Classic Levels (from standard technical calculation)
These are typical pivot/SR levels used by traders for one‑day setups:
Pivot Point: ~₹520
➡️ The central reference level where bias may shift.
If price trades above this level intraday → bullish bias; below → bearish bias.
Resistance Levels:
• R1: ~₹524
• R2: ~₹527
• R3: ~₹531
➡️ Levels where selling pressure may emerge if price rallies.
Support Levels:
• S1: ~₹516
• S2: ~₹513
• S3: ~₹509
➡️ Key intraday levels where buyers may step in on pullbacks.
📉 Today’s Range & Observations
Day’s High: ~₹497–₹498
Day’s Low: ~₹477–₹478
➡️ CONCOR is trading nearer its session low, showing short‑term selling pressure.
52‑Week Context:
• 52‑week low ~₹472–₹478
• 52‑week high ~₹652 (prior broader trend)
📌 How Traders Use These Levels (1 Day Time Frame)
Bullish Scenarios (intraday):
✔ If price breaks above Pivot (~₹520) with volume → potential move toward R1 ~₹524 and beyond.
✔ Strength above R1/R2 indicates buyers stepping in.
Bearish Scenarios (intraday):
✔ Price staying below pivot and failing at R1/R2 → continuation lower.
✔ Breakdown below S1 (~₹516) and S2/S3 amplifies downside pressure.
