NIFTY COMPARE WITH YESTERDAY IDEA IMAGE Yesterday marked the same key levels (25,400 / 25,200 / 25,000)
Today NIFTY respected perfectly — rejection from 25,200 and moved down.
Now price is holding near 25,000 support zone — break = more downside, hold = bounce chance.
Levels stay same, only price reacts. Trade the reaction,
Disclaimer: We are not SEBI registered. This is for educational purpose only.
Trend Analysis

PART 4 TECHNNICAL VS. INSTITUTIONALTime Decay (Theta)
Theta represents how much value option will lose per day even if price doesn’t move.
Sellers LOVE Theta
Buyers FEAR Theta
Near expiry:
A ₹200 premium may fall to ₹20 even with little change in spot.
This is how sellers make money consistently.

PNBHOUSING at crucial level of 860PNBHOUSING has retraced to a decisive level on the 15-minute timeframe. We are currently seeing a battle at the 860 mark, which has historically acted as a significant pivot point.
🔍 The Game Plan:
The Bearish Case: If the price fails to hold 860 and trades decisively below it, we may see a revisit to the historical support zone around 835–840. A breach there could open the doors toward the 822–825 level.
The Bullish Case: If the stock manages to sustain above 860, it signals a potential trend reversal. In this scenario, the immediate target I’m watching is the 900 psychological barrier.
OR
Stocks goes to support around 840 and then rebounce to 880+
💡 Key Execution Signal: Volume is King
Don't jump the gun. Wait for confirmation:
Long Entry: Price breaks upside and stays above 860 with a surge in volume.
Short Entry: Price breaks down below the support levels with heavy selling volume.

Smallcaps Break down in Five wavesNifty Smallcap 100 broke the falling trend channel on the way down but more than that the recent fall is now a five wave decline that might not be over. A five wave decline means that the larger trend has changed to bearish. It means that we are in a sell on rise market. A five wave decline once complete will also see a bigger retracement but the trend will remain down. Identifying a five wave decline is therefore important. Here we have it.

PREMIERENE at Deciding zone of around 760PREMIERENE has just entered a critical Supply Zone (753 – 769) on the 15-minute chart. Historically, this area has been a "brick wall" where the stock faces heavy selling pressure.
How to Play the "Deciding Zone":
🚀 THE BULL CASE (BUY):
Trigger: Watch for a clean breakout above 769.45.
Confirmation: We need a strong Volume Spike to prove the "big players" are buying the breakout.
Target: 798
📉 THE BEAR CASE (SELL):
Trigger: If the price touches the zone (or the 753 level) and retreats/rejects with high selling volume.
Confirmation: A failure to hold the zone confirms that supply is still in control.
Target: 728
The Golden Rule: Let the market reveal its hand first. No volume, no trade.

PART 3 TECHNNICAL VS. INSTITUTIONALWhy Traders Use Options
Options allow traders to benefit from multiple market views:
Directional trading (up or down)
Non-directional trading (markets stay range-bound)
Volatility trading (IV expansion/contraction)
Hedging (protect portfolios)
Income generation (selling options)

ABLBL | Bullish Divergence Opportunity | Chart Study🔻 Primary Trend
Stock is trading inside a well-defined falling channel (lower highs & lower lows).
Price is currently near the lower channel support, which is a key reaction zone.
🔁 Bullish RSI Divergence
Price: Made a lower low
RSI (14): Formed a higher low
This bullish divergence suggests selling pressure is weakening.
RSI has bounced from oversold zone (~30) and is curling upward.
📉 MACD Observation
MACD remains below zero but:
Histogram selling pressure is reducing
Momentum loss on the downside → early reversal signal (not confirmed yet)
📍 Support Zone
Strong horizontal + channel support around ₹103–105
Multiple reactions from this zone increase its reliability
🎯 Bullish Opportunity Logic (Study only)
Setup favors a technical pullback / relief bounce
Best confirmation would be:
Price holding above support
RSI crossing 40–45
MACD flattening or bullish crossover
📝 Note
This chart is shared purely for educational and technical study purposes.
It is not a recommendation or trading advice. Please do your own analysis.

NIFTY (analysis)NIFTY - Market View
Nifty is back near its recent swing low. The index has broken earlier swing lows and is clearly forming a lower high–lower low (LH–LL) structure on both higher and lower timeframes. This shows that the trend is still weak for now.
Currently, Nifty is trading near the trendline support and also close to the 0.618 Fibonacci retracement (golden ratio). This zone can act as an important decision area.
If price consolidates here and volatility cools off, there is a probability of a short-term reversal or bounce.
However, if Nifty fails to hold this zone, the next support is likely around 24,580–24,770, which is a deeper Fibonacci retracement area, below that 24330.
At this stage, the market is clearly in wait-and-watch mode.
Aggressively buying small and mid-cap stocks on the first bounce may not work in such conditions.
Let the index stabilise first.
Patience is key.
Follow price, not emotions.
✅ If you like my analysis, please follow me here as a token of appreciation :) in.tradingview.com/u/SatpalS/
📌 For learning and educational purposes only, not a recommendation. Please consult your financial advisor before investing.

PART 2 TECHNNICAL VS. INSTITUTIONALA. Strike Price
The strike price is the predetermined price at which the buyer can buy (CE) or sell (PE) the underlying.
Example:
Nifty Spot = 22,000
You buy Nifty 22,100 CE, meaning you can buy Nifty at 22,100.
B. Premium
Premium is the price you pay (buyer) or receive (seller) to enter the contract. Option prices change based on demand, volatility, time, and underlying movement.
C. Expiry
Options do not last forever. Every option expires:
Weekly (Most popular in Nifty/Bank Nifty)
Monthly
Quarterly (some stocks)
Yearly (LEAPS) in some markets
At expiry, the option will either:
Become In the Money (ITM) → It has intrinsic value.
Become Out of the Money (OTM) → It becomes worthless.

BAJAJCON - This Is What 100 Charts Have Taught MeThis idea is special to me — it marks my 100th idea shared on TradingView.
Over time, charts have taught me one simple truth: price respects structure more than opinions.
BAJAJCON is trading within a well-defined rising channel, a structure that has been respected across multiple market cycles. Each pullback into demand has been followed by recovery, showing controlled participation rather than emotional moves.
The recent move is not random strength. It’s a reaction from the lower trendline, followed by acceptance toward the upper boundary — exactly how healthy trends behave.
This chart reflects my journey as well: fewer predictions, more patience; fewer indicators, more clarity.
Whether price pauses here or expands further, the structure remains intact, and that is what matters most.

XAUUSD (H4) – Liam Buying StrategyXAUUSD (H4) – Liam Continuation Plan
Trend remains strong, but price is extended | Buy pullbacks, not highs
Quick summary
Gold continues to trade firmly within a strong bullish structure. Macro pressure on safe-haven demand has eased slightly as US–EU geopolitical and trade tensions cool, while rising oil prices (supported by Saudi Aramco’s demand outlook) keep inflation expectations alive.
Despite the bullish trend, price is currently extended near the upper range, so execution today should focus on buying pullbacks at structure, not chasing breakouts.
Macro context (supportive, but less explosive)
Reduced geopolitical friction between the US and Europe has eased panic-driven flows.
Oil prices pushing higher keeps inflation expectations sticky, limiting downside pressure on gold.
USD remains relatively stable (USD/CAD holding firm), suggesting gold strength is structure-driven rather than pure fear trade.
➡️ Conclusion: trend-friendly environment, but volatility is now more technical than headline-driven.
Technical view (H4 – based on the chart)
Gold is respecting a clean ascending trendline, with impulsive legs followed by shallow pullbacks.
Key levels from the chart:
✅ Upper extension / continuation target: 5000+ zone
✅ Bullish continuation buy zone: 4580 – 4620 (previous breakout + fib support)
✅ Trendline support: dynamic (ascending)
✅ Deeper correction support: 4400 – 4450
Price is currently trading above the 1.618 fib expansion, which increases the probability of short-term consolidation or pullback before continuation.
Trading scenarios (Liam style: trade the level)
1️⃣ BUY scenarios (priority – trend continuation)
A. BUY pullback into structure (preferred setup)
✅ Buy zone: 4580 – 4620
Condition: hold above trendline + bullish reaction on M15–H1
SL: below structure / trendline
TP1: recent high
TP2: 4900
TP3: extension toward 5000+
Logic: This zone aligns with prior resistance turned support and fib retracement — a higher-probability continuation entry than buying highs.
B. BUY deeper dip (only if volatility increases)
✅ Buy zone: 4400 – 4450
Condition: strong rejection / liquidity sweep
TP: 4580 → 4800+
Logic: This is the last clean structural support within the current trend. A dip here would likely be corrective, not trend-ending.
2️⃣ SELL scenario (counter-trend, tactical only)
❌ No swing SELL bias while price holds above the ascending trendline. Shorts only make sense as very short-term scalps at highs with clear lower-TF rejection.
Key notes
Strong trends punish impatience — wait for pullbacks.
Avoid entries mid-leg after impulsive candles.
If price accelerates vertically without retrace, stand aside.
What’s your approach: waiting for the 4580–4620 pullback to join the trend, or staying flat until a deeper correction toward 4450?
— Liam

XAUUSD (Gold) | Bullish vs Bearish SetupS | 23rd Jan'2026XAU/USD – Key Levels (23 Jan 2026)
Resistance:
* R1: 4975–4985 → Near-term supply
* R2: 5000–5015 → Psychological breakout zone
Support:
* Pivot / Demand Zone: 4940–4955 → Intraday balance
* Primary Support: 4920–4940 → Trend bullish above
* Secondary Support: 4880–4900 → Strong swing support
* Trend Invalidation: 4850 → Break weakens bullish trend
Bullish Swing Setup
* Buy on Dip: 4920–4940 | SL: 4900 | Targets: 4975 → 5000 → 5015
* Breakout Buy: Above 4985 | SL: 4955 | Targets: 5000 → 5030 → 5050
Bearish Swing Setup (Corrective)
* Pullback Sell: Below 4920 | SL: 4940 | Targets: 4880 → 4850 → 4820
* Trend Shift Sell: Break below 4850 | SL: 4880 | Targets: 4800 → 4760

Entry Setup 9Before Trade Entry Follow the Step:-(check list)
Step 1:- Identify the Trend
Step 2:- Bullish Trend Wait for Support Price & Reversal Candlestick(Take Buy)
Step 3:- Bearish Trend Wait for Resistance & Reversal Candlestick(Take Sell)
Step 4:- Fibonacci retracement confirm
Step 5:- Wait for Reversal candlestick
My Trading Role:-
1. Don't Lose capital
2. Trade less Earn More
Focus On:-
1. Quality Trades
2. Risk Management
3. Self - Discipline
RISK WARNING:- All trading involves risk. Only risk capital you're prepared to lose. This chart has not given any investment advice, only for educational purposes

PART 1 TECHNNICAL VS. INSTITUTIONAL What Are Options?
Options are financial derivatives—meaning their value is derived from an underlying asset such as stock, index, commodity, etc. They are contracts between two parties: the option buyer and the option seller (writer).
There are two types of options:
Call Option (CE) – Right to buy the asset at a fixed price.
Put Option (PE) – Right to sell the asset at a fixed price.
The key point:
The buyer has a right but no obligation. The seller has an obligation but no rights.

XAUUSD – H2 Technical AnalysisXAUUSD – H2 Technical Outlook: Liquidity Pullback Within a Strong Bullish Structure | Lana ✨
Gold continues to trade within a well-defined bullish structure on the H2 timeframe. The recent surge was impulsive, followed by a healthy retracement that appears to be rebalancing liquidity rather than signaling a trend reversal.
Price action remains constructive as long as the market respects key structural levels and the ascending trendline.
📈 Market Structure & Trend Context
The overall trend remains bullish, with higher highs and higher lows still intact.
Price continues to respect the ascending trendline, which has acted as reliable dynamic support throughout the uptrend.
The recent pullback occurred after an aggressive upside expansion, fitting the classic sequence:
Impulse → Pullback → Continuation
No clear distribution pattern is visible at this stage. As long as structural support holds, the bias remains BUY on pullbacks, not selling strength.
🔍 Key Technical Zones & Value Areas
Primary Buy POC Zone: 4764 – 4770
This area represents a high-volume node (POC) and aligns closely with the rising trendline.
It is a natural zone where price may rebalance before resuming the bullish trend.
Secondary Value Area (VAL–VAH): 4714 – 4718
A deeper liquidity zone that could act as support if sell pressure temporarily increases.
Near-term resistance: 4843
Acceptance above this level strengthens the continuation scenario.
Psychological reaction zone: 4900
Likely to generate short-term hesitation or profit-taking.
Higher-timeframe expansion targets:
5000 (psychological level)
2.618 Fibonacci extension, where major liquidity may be resting.
🎯 Trading Plan – H2 Structure-Based
✅ Primary Scenario: BUY the Pullback
Buy Entry:
👉 4766 – 4770
Lana prefers to engage only if price pulls back into the POC zone and shows bullish confirmation on H1–H2 (trendline hold, strong rejection of lower prices, or bullish follow-through).
Stop Loss:
👉 4756 – 4758
(Placed ~8–10 points below entry, beneath the POC zone and the ascending trendline)
🎯 Take Profit Targets (Scaled Exits)
TP1: 4843
First resistance zone — partial profit-taking recommended.
TP2: 4900
Psychological level with potential short-term reactions.
TP3: 5000
Major psychological milestone and upside expansion target.
TP4 (extension): 5050 – 5080
Area aligned with the 2.618 Fibonacci extension and higher-timeframe liquidity.
The preferred approach is to scale out gradually and protect the position, adjusting risk as price confirms continuation.
🌍 Macro Context (Brief)
According to Goldman Sachs, central banks in emerging markets are expected to continue diversifying reserves away from traditional assets and into gold.
Average annual central bank gold purchases are projected to reach around 60 tons by 2026, reinforcing structural demand for gold.
This ongoing accumulation supports the idea that pullbacks are more likely driven by positioning and profit-taking, rather than a shift in long-term fundamentals.
🧠 Lana’s View
This remains a pullback within a bullish trend, not a bearish reversal.
The focus stays on buying value at key liquidity zones, not chasing price at highs.
Patience, structure, and disciplined execution remain the edge.
✨ Respect the trend, trade the structure, and let price come to your zone.

APLAPOLLO : VCP Breakout with Fundamental ConfirmationInitiated a long position in APLAPOLLO following a high-conviction breakout from a multi-month Volatility Contraction Pattern (VCP). Although the price is currently extended from the 20- and 50-day EMAs, the structural strength of the breakout suggests the beginning of a fresh leg in the uptrend.
From a fundamentals perspective, the company continues to deliver strong and consistent sales and EPS growth, reinforcing its positioning as a proxy for India’s infrastructure-led growth cycle.
To manage the risk associated with being extended from the moving averages, I’ve opted for a wider stop-loss, allowing room for short-term volatility or a potential retest of the breakout zone. This approach gives the trade sufficient breathing space while the moving averages gradually catch up to price.
From a broader market standpoint, the recent ~10% correction in ITC following the government’s cigarette tax announcement has created temporary index-level pressure on the Nifty 50. However, this has triggered a clear sectoral rotation rather than broad-based weakness. Capital is rotating out of regulatory-impacted FMCG names and into high-growth industrial leaders like APL Apollo.
Given its insulation from regulatory shocks and its direct linkage to domestic capex growth, APL Apollo is exhibiting strong relative strength even as the broader market remains range-bound.
Initiated the position with 1% risk.
📢📢📢
If my perspective changes or if I gather additional fundamental data that influences my views, I will provide updates accordingly.
Thank you for following along with this journey, and I remain committed to sharing insights and updates as my trading strategy evolves. As always, please feel free to reach out with any questions or comments.
Other posts related to this particular position and scrip, if any, will be attached underneath. Do check those out too.
Disclaimer : The analysis shared here is for informational purposes only and should not be considered as financial advice. Trading in all markets carries inherent risks, and past performance is not indicative of future results. It’s essential to conduct your own research and assess your risk tolerance before making any investment decisions. The views expressed in this analysis are solely mine. It’s important to note that I am not a SEBI registered analyst, so the analysis provided does not constitute formal investment advice under SEBI regulations.

BTCUSD – Let the Structure DecidePrice is currently trading inside a well-defined rising channel, where both demand and supply are clearly respected.
This is not random volatility — it’s organized price movement.
After a strong impulsive move, Bitcoin has shifted into a controlled consolidation, allowing the market to absorb supply and reset sentiment. Such phases are essential for any sustainable trend.
At this stage, two scenarios matter:
If price holds the lower channel support, it keeps the structure intact and opens the door for a continuation toward the upper trendline.
If support fails decisively, the next logical area lies at the broader horizontal demand zone below, where higher-timeframe buyers previously stepped in.
This is a wait-and-watch zone, where price behavior near support will decide the next leg — not opinions, news, or emotions.

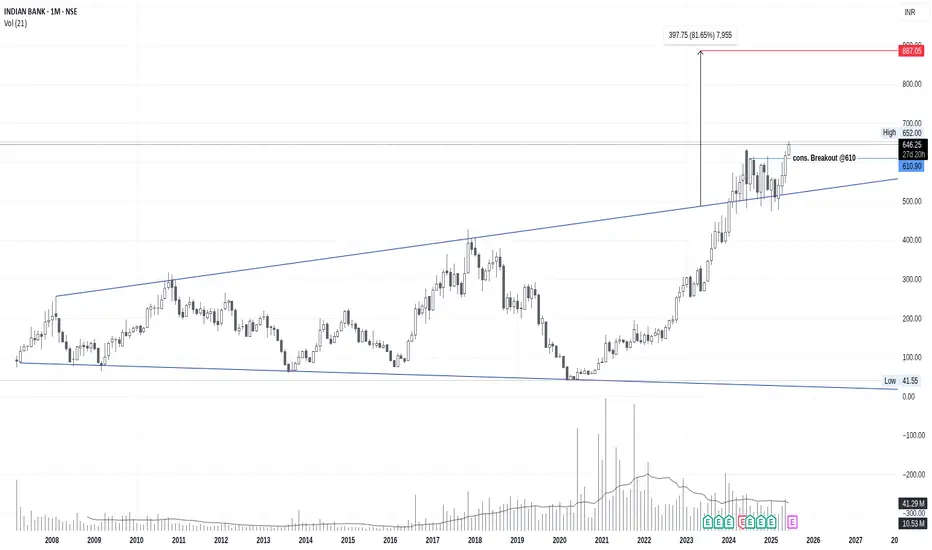
INDIANB : rear Broadening Wedge Pattern Breakout @ ATHIndian Bank stock is showing a very rear Broadening Wedge Pattern Breakout @ ATH good sign to the stock.. and the noted thing is it's happening on monthly chart ...
All data is available in public domain..
CMP : 646
TG : 890
SL : close Below 9 EMA
Stock's selection based on 5 Point Analysis:
1: Idea : Breakout.
2: Support : Volume, Delivery .
3: Technical : 21/55/200-EMA, Super trend up, RS>0 RSI.
4: Fundamental : PE, PAT, Industry & peer PE and sector performance.
5: Timing : Entry Timing on Daily chart.
Disclaimer : It is my personal view as a trader and for educational purpose only. Equity market involves risk .
Please consult your financial adviser before taking any decision.
SILVER - HEALTHY CONSOLIDATION LONGSSilver doing a healthy consolidation - momentum intact.
very strong support for momentum to continue is $90, belov that momentum vill be lost.
small resistance at $93.50
major resistance at $95.50 - $96
above $96 v should likely test 3digits - $100.
above that vill be a price discovery one can trail at ST 1.5 on 75m chart.

INDIANB (Indian Bank)INDIAN BANK is showing a strong and constructive setup.
The stock recently made a fresh all-time high near 894, followed by a healthy pullback, which is a positive sign and often helps in building a stronger base for the next move. Importantly, the pullback was well-controlled, indicating limited selling pressure.
Price has now resumed its upward move and is trading above all key EMAs, reflecting continued strength and bullish momentum. The overall structure remains intact with higher highs and higher lows.
A decisive breakout from the current consolidation zone could open the door for a fresh upside move in the coming sessions.
Keep it in your watchlist.
✅ If you like my analysis, please follow me here as a token of appreciation :) in.tradingview.com/u/SatpalS/
📌 For learning and educational purposes only, not a recommendation. Please consult your financial advisor before investing.

NIFTY – Intraday Structure | Breakout from Bullish ConsolidationOn 5m, 15m and 1H timeframes, NIFTY formed a bearish trendline breakout around 2 PM, followed by a pullback and formation of a bullish intraday consolidation channel.
Price is currently consolidating inside this bullish channel, and a decisive break on either side can define the next intraday move.
🔹 Intraday Plan
Upside Scenario:
Break above bullish channel
Targets:
T1: 25,500
T2: 25,550
T3: 25,650
Stop Loss: 25,300 – 25,280
Downside Scenario:
Break below bullish channel
Targets:
T1: 25,150
T2: 25,000
T3: 24,900 – 24,920
Stop Loss: 25,360 – 25,380
This is a pure intraday range-break setup based on post-breakout bullish consolidation.
⚠️ Disclaimer
I am not a SEBI registered advisor or trader.
This analysis is shared only for educational purposes.
Please consult a registered financial advisor before taking any trading decisions.

HDFCBANK 4HR T/F ANALYSIS----
hdfcbank 4hr t/f analysis----- the top whole structure are bended both side which called structure is elips and it`s also dual direction in cans breakdown of elips into downside so we can measure elips of previous demand can measure body to body measure only green holding volume and interchange into supply so now we have a reversal area in this reversal zone wait for any bullish candle it`s help to confirmation to go with trend ok let`s see---

XRPUSD — Wave 4 Completion in a Fibonacci Confluence ZoneXRP is currently developing a complex Wave 4 correction within a larger impulsive structure.
The internal structure of Wave 4 is unfolding as a W–X–Y correction, where the final leg (Y) is forming as an A–B–C pattern, and the C-wave is nearing completion.
Key Technical Observations
Fibonacci Cluster Confluence
The retracement of Wave 1 → Wave 3 aligns with the 61.8%–78.2% Fibonacci zone, which also matches:
The W–X–Y termination area
A–C extension levels
Higher timeframe liquidity support
This confluence creates a high-probability reaction zone.
Impulse Structure Validation
According to Elliott Wave guidelines:
Wave 4 is allowed to form complex corrections (WXY).
A single liquidity sweep below the WXY low is acceptable.
Sustained price acceptance below the Fibonacci cluster would invalidate the impulsive structure.
Critical Price Level
The $1.50 region is the key decision zone:
Above $1.50 → Wave 4 remains valid, and Wave 5 expansion becomes probable.
Below $1.50 (with strong acceptance) → Impulse failure scenario, signaling a larger corrective cycle.
