Gold Analysis & Trading Strategy | January 21-22✅ 4-Hour Chart (H4) Analysis:
Gold has maintained a strong upward structure since launching from the 4537 area, with both highs and lows continuing to rise, confirming that the overall bullish trend remains intact. After reaching the 4888 area, upside momentum has started to slow, and price has entered a phase of high-level consolidation and technical correction. Although the moving average system (MA5 / MA10 / MA20) remains in a bullish alignment, the market clearly needs to digest the previous rapid advance. As a result, this is no longer an ideal stage to chase longs; a more reasonable approach is to wait for pullbacks before reassessing new trend-following opportunities.
✅ 1-Hour Chart (H1) Analysis:
On the short-term timeframe, price formed a temporary top near 4888 and has since entered a corrective phase, gradually pulling back toward short-term moving averages and the rising trendline. This movement is considered a normal correction within a broader bullish trend. As long as price holds above the 4800–4790 zone, the overall structure remains strong and the pullback can be viewed as a consolidation phase. However, a decisive break below this support area would increase the risk of a deeper correction and require tighter risk management.
🔴 Resistance Levels: 4850–4865 / 4888–4906
🟢 Support Levels: 4820–4800 / 4790–4775 / 4695–4700
✅ Trading Strategy Reference:
🔰 Trend-Following Approach (Primary Strategy)
📍 Wait for price to pull back into the 4820–4800 / 4790 zones
📍 After stabilization signals appear, attempt light, staggered long positions
Condition: The H1 structure remains intact
🔰 Defensive Approach (Risk Control)
📍 If price breaks below 4790 and fails to recover quickly
📍 Decisively reduce exposure or exit positions and wait for new structural confirmation
✅ Trend Summary:
👉 Medium-term trend (H4): Bullish trend remains intact, but price has entered a high-level consolidation phase
👉 Short-term condition (H1): Corrective pullback + cooling momentum
👉 Core strategy: Do not chase highs; focus only on pullback structures
👉 Key defense zone: 4800–4790 — a clear break below requires heightened caution
Trend Analysis

In BNTUSDT.P bulls are almost losing controlBINANCE:BNTUSDT.P
The chart structure appears weak, suggesting that the current pullback could lead to a significant dip. In this scenario, a high‑risk short position may offer better potential than a low‑risk long, which could turn into a trap.
Disclaimer ⚠️: This is not financial advice. Please conduct your own research before making any investment decisions. #Binance #BNTUSDT.P #Bancor #BNT

#NIFTY reversed from 24920 levels - Nextt 25500/25650/25760++As we see today, nifty went down further as predicted near 24960 levels as next downside , it went upto 24920 and recovered sharply.
Tomorrow again buy on dips until 24920 is holded.
On any up move above 25300-25330 , sharp short covering rally possible
next targets are 25500/25650/25760++ in 2-3 sessions only.

NIFTY (22-01-2026)Please note this levels are for intraday trading only.
Soch Samajh ke 🐉
Technical Analysis of Nifty
[This is for educational purposes only

A Completed Impulse Now Gives Way to Correction in VoltasFrom its inception low near ₹2.60 , Voltas has unfolded a clear long-term 5-wave impulsive advance on the monthly timeframe , culminating near ₹1,994.90 . The structure of this move aligns well with classical Elliott Wave principles, suggesting that a larger-degree impulse cycle has likely concluded .
Following this structural completion, price action has transitioned into a corrective phase . The initial decline fits well as Wave W , unfolding in a zigzag structure . This has been followed by a rebound that appears corrective in nature and can be interpreted as the connector Wave X .
If this interpretation holds, the broader correction may continue with one more leg lower in Wave Y , potentially drawing price toward the 50% Fibonacci retracement zone of the entire impulse. Such behavior would be consistent with a higher-degree corrective process , rather than a trend reversal.
Until the corrective structure is fully resolved, any interim rallies are more likely to be corrective in nature and may be viewed as potential selling opportunities , rather than the start of a new impulsive advance.
At this stage, the focus remains on structure and price behavior , as corrective phases tend to be overlapping and time-consuming . The larger trend remains intact, but patience is required before expecting trend resumption.
Disclaimer: This analysis is for educational purposes only and does not constitute investment advice. Please do your own research (DYOR) before making any trading decisions.

Bitcoin Investment strategyTime-Based Accumulation & Distribution Idea
Bitcoin has historically respected long-term time cycles. Rather than focusing on short-term price noise, this idea explores a time-window approach that aligns with structural supply shocks and market psychology.
The concept is simple but powerful:
identify a accumulation phase well before the event, and a distribution window once the cycle matures. These windows are not about exact tops or bottoms, but about positioning within a broader asymmetric opportunity.
This approach assumes volatility, drawdowns, and false signals along the way — but the edge lies in time in the market, not timing the market.
With the next accumulation already on the clock, the question isn’t if the cycle repeats — but how it expresses itself this time.
More insights as we get the next signal

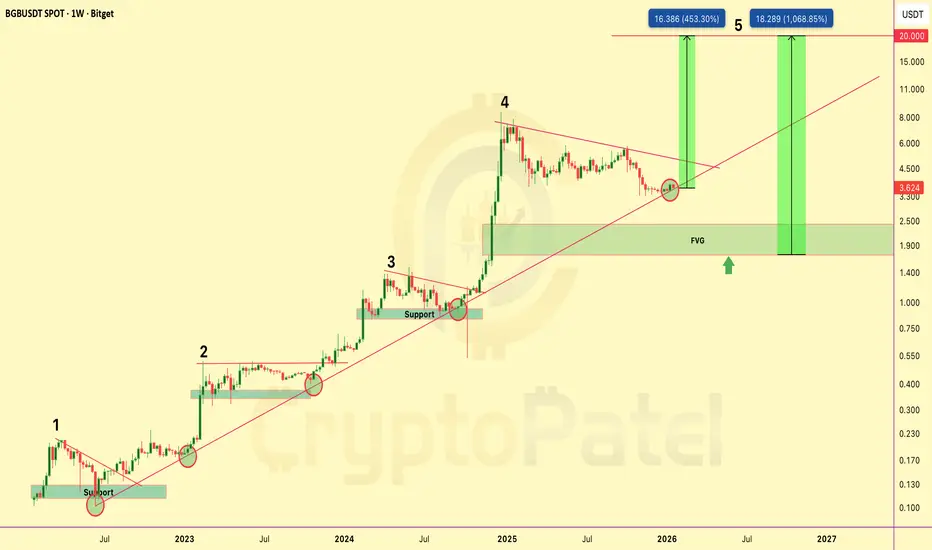
$BGB PRICE PREDICTION | 450%–1000% POTENTIALBGB is trading inside a well-defined long-term rising channel on the weekly timeframe, respecting bullish market structure since 2022.
Price has completed a full accumulation → expansion cycle and is currently undergoing a healthy corrective phase before the next impulsive move.
Technical Structure
Long-term ascending trendline remains intact
Clear 5-wave Elliott structure on HTF
Wave 4 correction following a strong impulsive expansion
Price reacting from dynamic channel support
HTF Fair Value Gap (FVG): $2.40 – $1.70
Bullish structure maintained above $3.40
Upside Targets (Wave 5 Extension)
$10
$15
$20
Alternative Scenario
If price breaks below $3.40 and an HTF candle closes below this level, there is a high probability of a move toward the $2.00 support and HTF FVG zone, which would represent a strong long-term accumulation area rather than trend invalidation.
Bias & Invalidation
As long as BGB/USDT holds above the rising channel support, the macro bullish bias remains intact.
Invalidation: Weekly close below the rising channel.
Technical analysis only. Not financial advice. DYOR.
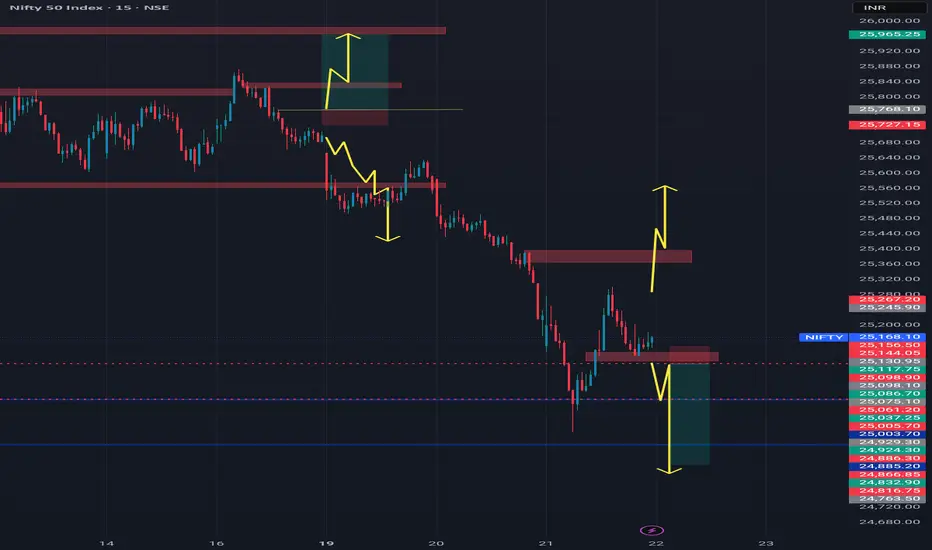
NiftyNifty has attempted multiple recoveries after the fall, consistently taking support near the 25100 level. If the index opens with a gap down below 25100 and forms a strong bearish candle, a further downside move towards 24750 can be expected. A bullish move is likely only after a decisive break above 25400. Until then price action remain sideways within the 25300-25100 range.
Bajaj Finance: When Structure, Liquidity & Catalysts Line UpStructure
The rally from ₹849 to ₹1,102.50 unfolded as a clean 5-wave impulse , clearly establishing the move as directional and non-corrective .
Post the impulse high, price transitioned into a corrective phase , drifting lower within a well-defined descending channel . From an Elliott Wave perspective, the decline fits well into a W–X–Y double zigzag structure, with the current leg likely unfolding as Wave Y — suggesting a mature correction rather than trend damage.
Liquidity
Crucially, Wave Y is now approaching an unfilled gap that aligns closely with the 0.786 Fibonacci retracement of the prior impulse. This convergence marks a potential liquidity zone , where downside momentum may begin to exhaust and responsive buying interest could emerge.
This area warrants close observation for bullish reversal candlestick patterns and/or bullish divergence on RSI , which would strengthen the case for a constructive reaction from this zone.
Catalysts
Adding further context, earnings are scheduled for Feb 3rd , with the Union Budget on Feb 1st — two near-term events that could act as timing catalysts. A positive price response around this liquidity pocket could help transition the structure from corrective to impulsive, setting up a high-quality trade opportunity with a favorable reward-to-risk profile .
Risk Management
Importantly, bullish invalidation lies below ₹849 . As long as this level holds, the impulsive base remains intact, keeping risk clearly defined and asymmetric.
Conclusion
This is a high-context, high-clarity zone where structure is mature, liquidity is in focus, and catalysts are lined up . Upside confirmation from here could unlock a meaningful move, making patience and disciplined observation key.
Disclaimer: This analysis is for educational purposes only and does not constitute investment advice. Please do your own research (DYOR) before making any trading decisions.

$ASTER PRICE PREDICTION | HTF ACCUMULATION | 2400% MACRO POTENT?SEED_WANDERIN_JIMZIP900:ASTER is currently trading inside a high-timeframe accumulation base after a prolonged downtrend.
Price compression near major demand suggests trend exhaustion and a potential volatility expansion ahead.
Market Structure Overview
✅ Prolonged downtrend → exhaustion phase
✅ HTF accumulation forming
✅ Descending trendline pressure building
✅ Volatility compression → expansion setup
SEED_WANDERIN_JIMZIP900:ASTER is already ~78% down from its September 2025 ATH, significantly improving risk–reward for long-term positioning.
Key Accumulation Zones
Zone 1: $0.70 – $0.60 ✅ (Filled – bounce expected)
Zone 2 (Macro flush scenario): $0.45 – $0.35
→ Strong long-term accumulation zone if broader market weakness persists
Upside Targets (CryptoPatel View)
$1.50 → $2.00 → $5.00 → $10.00 → $20.00
Macro extension: $20 – $30 (long-term, high-risk / high-reward)
Invalidation: Loss of HTF demand structure → High-risk hold
Market Talk
As per public disclosures circulating on 2 Nov 2025, CZ was reportedly exposed to SEED_WANDERIN_JIMZIP900:ASTER below ~$0.91, holding approximately 2.09M ASTER.
While not a signal, this adds sentiment confidence to the long-term accumulation narrative.
Long-Term Thesis
This phase appears to be early accumulation, not confirmation.
If HTF demand holds and structure flips bullish, $5–$10 becomes realistic, with $20+ as a full-cycle expansion scenario.
Disclaimer:
This is technical analysis & market discussion only — not financial advice.
Always manage risk and do your own research.

5PAISA for 35% gain in 12-18 Month5Paisa capital will be able to give 35% gain in 1-2 year time Frame , it may go down 10% more down from current level but having potential to give 35% gain soon.

NIFTY Analysis for 22nd JAN 2026: IntraSwing Spot levelsNIFTY Analysis for 22nd JAN 2026: IntraSwing Spot levels
🚀Follow GIFTNIFTY Post for NF levels
👇🏼Screenshot of NIFTY Spot All-day(21st Jan 2026) in 5 min TF.
👇🏼Screenshot of GIFTNIFTY as of now (21st Jan 2026) in 5 min TF.
_____________^^^^^^^^^^^^^^_________________
💥Level Interpretation / description:
L#1: If the candle crossed & stays above the “Buy Gen”, it is treated / considered as Bullish bias.
L#2: Possibility / Probability of REVERSAL near RLB#1 & UBTgt
L#3: If the candle stays above “Sell Gen” but below “Buy Gen”, it is treated / considered as Sidewise. Aggressive Traders can take Long position near “Sell Gen” either retesting or crossed from Below & vice-versa i.e. can take Short position near “Buy Gen” either retesting or crossed downward from Above.
L#4: If the candle crossed & stays below the “Sell Gen”, it is treated / considered a Bearish bias.
L#5: Possibility / Probability of REVERSAL near RLS#1 & USTgt
HZB (Buy side) & HZS (Sell side) => Hurdle Zone,
*** Specialty of “HZB#1, HZB#2 HZS#1 & HZS#2” is Sidewise (behaviour in Nature)
Rest Plotted and Mentioned on Chart
Color code Used:
Green =. Positive bias.
Red =. Negative bias.
RED in Between Green means Trend Finder / Momentum Change
/ CYCLE Change and Vice Versa.
Notice One thing: HOW LEVELS are Working.
Use any Momentum Indicator / Oscillator or as you "USED to" to Take entry.
━━━━━━━━━━━━━━━━━━━━━━━━━━━━━━━━━━━━━━━━━━━
⚠️ DISCLAIMER:
The information, views, and ideas shared here are purely for educational and informational purposes only. They are not intended as investment advice or a recommendation to buy, sell, or hold any financial instruments. I am not a SEBI-registered financial adviser.
Trading and investing in the stock market involves risk, and you should do your own research and analysis. You are solely responsible for any decisions made based on this research.
"As HARD EARNED MONEY IS YOUR's, So DECISION SHOULD HAVE TO BE YOUR's".
━━━━━━━━━━━━━━━━━━━━━━━━━━━━━━━━━
❇️ Follow notification about periodical View
💥 Do Comment for Stock WEEKLY Level Analysis.🚀
📊 Do you agree with this view?
✈️ HIT THE PLANE ICON if this technical observation resonates with you. It will Motivate me.
━━━━━━━━━━━━━━━━━━━━━━━━━━━━━━━━━
💡 If You LOOKING any CHART & want for Level and ANALYZE?
Share your desired stock names in the comments below! I will try to analyze the chart Levels, patterns and share my technical view (so far my Knowledge).
If Viewers think It can identify meaningful setups. Looking forward to hearing from all of you — let's keep this discussion going and help each other make better trading decisions.

Bajaj Finance: Impulse Complete, Correction in ControlBajaj Finance completed a clean five-wave impulsive advance , topping out near ₹1,102.5 , followed by a clear loss of momentum. Since that peak, price action has shifted from trend to overlap , signaling a corrective phase rather than continuation.
Structurally, the decline is unfolding within a descending channel , fitting well with a W–X–Y corrective structure . The internal swings remain choppy and overlapping — classic correction behavior — with price respecting the channel boundaries so far.
During the impulsive rally ( Waves 1–5 ), the 50 DMA acted as dynamic support , confirming strong upside momentum. Post the top, price has slipped below the 50 DMA and is now oscillating around it, indicating momentum fatigue . A sustained hold below the 50 DMA, combined with a rollover in the average , would reinforce the short-term bearish / corrective bias , with the average potentially flipping into dynamic resistance .
From a price projection perspective, the ongoing Wave Y is favoring a move toward key Fibonacci retracement levels . The 0.618 retracement near ₹945 stands out as a high-probability reaction zone , while a deeper flush could extend toward the 0.786 retracement near ₹903 if downside pressure accelerates.
Risk is clearly defined. A sustained break above the upper boundary of the corrective channel would invalidate the W–X–Y interpretation and signal a structural shift back toward strength . Until then, the path of least resistance remains corrective .
Bottom line:
The impulsive phase is done. The market is digesting gains. Structure — not emotion — favors patience and respect for the corrective channel.
Disclaimer:
This analysis is for educational purposes only and does not constitute investment advice. Please do your own research (DYOR) before making any trading decisions.

Coal india Day TF 21 JanCoal india looks coming towards at support level Of 400 and 390 which is also near by its 200 dema.
#coalindia
Being a puc and a monopoly with good divided yield and low. Pe stocks
It has potential to reach 443-459 and at 500 as well in mid to long term.
Stop loss can be placed at 370 levels.

Nifty 1d tf 21 janToday's high can act as a good breakout level and we can see sharp rise on same.
As nifty is oversold, bounce is expected.
It can hit 25600-25700.
Let's wait for a breakout first before a rally.
Any fall is opportunity for nifty etf

Shorts active in BTcAs per priceaction it seems market taking stoploss of small sellers now may go for deep dive it's totally priceaction plz don't trade on my analysis as I am only student of charts 🙏

Bear active in BTCIt may be a opportunity to short for btc as per priceaction but everything is guess only and taking risk consider money management
I am only a learner plz don't trade on my analysis do your learn price action go for practice

EURGBP at decisive zone of 0.87040After building an uptrend in channel, this pair hit a road block and to prove that its really in uptrend, it has to pass this decisive zone with volumes. if fails, it will again come down to 0.86660 and if sustains current trend then 0.87400

Bccl on 1 hr tf 21 janBharat coke on 1 hr, time frame.
Though has broken listing day low and it is not in FNO so we can not short.
Looking for long position here.
Once it breaks the draw line above 40.75 it can give 5-7% move towards 43.
Let's wait and watch.

[SeoVereign] BITCOIN BULLISH Outlook – January 21, 2025The market’s direction is becoming increasingly ambiguous.
As the market fails to present a clear directional bias,
I am likewise experiencing considerable difficulty in reading its flow.
The current market environment is characterized by a significant expansion in volatility, where movements suggesting the completion of a downtrend and a transition to an upward phase are repeatedly followed by sharp retracements that erase the entirety of the advance.
From a short-term perspective, this represents an extremely fatiguing phase; however, from a macro perspective, it corresponds to a textbook consolidation range.
Consolidation is generally perceived as a tedious and painful phase, yet it is crucial to recognize that the longer a consolidation persists, the more powerful the volatility that tends to follow thereafter.
Many market participants become fixated on the minor fluctuations that occur within consolidation ranges, repeatedly engaging in forced and excessive trades, thereby eroding their capital. As a result, when a decisive trend finally emerges, they are placed in the critical situation of being unable to participate in that move.
Accordingly, the most important priority at this stage is not to hastily predict the next move, but to preserve capital through rigorous risk management.
From the perspective of directional analysis, time itself represents the accumulation of evidence.
By way of analogy, when eating with one’s eyes covered, it is difficult to identify the food immediately after placing it in one’s mouth; only through repeated chewing and swallowing does the taste and composition become clear.
The current market is likewise passing through a very prolonged consolidation phase, and the evidence accumulated during this process will ultimately indicate the future direction and magnitude with greater clarity.
In general, when consolidation persists to this extent, the subsequent move tends to be relatively clear.
That said, at the present moment, I am assigning equal probability to both upside and downside scenarios. While it is unusual for directionality to remain unclear after such an extended consolidation, experience suggests that in these conditions, there is often a marginally higher probability of an additional downward extension of the existing trend.
However, within my analytical framework, signals have also been detected that provide sufficient grounds to assert the possibility of an immediate upward move.
In circumstances where indicators conflict in this manner, the optimal approach is to exercise patience and wait for a point at which directionality becomes clearly defined.
Accordingly, I am currently maintaining a strategy centered on short-term trading within the 15-minute timeframe, and I would like to share a newly identified bullish perspective observed within the same timeframe.
At present, the price structure is approaching the completion zone of a 1.902 Deep Crab pattern formed following a downtrend.
While completion of such a pattern does not allow one to definitively conclude a trend reversal, it is nonetheless classified as a region where technical reactions and attempts at short-term structural shifts are highly likely to occur within a broader downtrend.
In other words, it represents an area where selling pressure tends to weaken near the tail end of a decline and where short-term buying responses may emerge.
Such structures typically form in zones where fear among market participants reaches its peak.
Additionally, the Fibonacci retracement zone of 0.5 to 0.618, measured from the recent high-to-low downward impulse, precisely overlaps with the pattern completion area.
Based on these technical factors, the average target zone has been set at 92,500 USDT, and I plan to respond flexibly through the expansion and reduction of long positions.
I will continue to closely monitor market reactions and provide ongoing updates should there be any changes in perspective or additional analytical developments.
This concludes the current idea.

Nifty preparing up for the Budget As we discussed yesterday, NSE:NIFTY did bounce from the day’s low and closed with a small green candle. The price action says it all.
For tomorrow, the index is likely to move towards 25350.
If it reaches this zone and then gives a dip, that will be an opportunity to add longs.
However, if the index gets rejected near 25280, we may end up with a sideways day.
Support is placed at 25074.
As long as this level holds, buying interest should remain active from lower levels.
A gap-up opening would be healthy from here.
But if the market opens gap-down, that should not be chased for buying.
Sector-wise, nothing looks strong at the moment.
However, Cement and Defence are showing some traction, mainly due to budget expectations.
For now, this is all the data I have.
Let more data come from lower levels tomorrow. After that, we can plan a proper bullish buildup in both equity and futures.
Take care. Have a profitable day ahead.
📊 Levels at a glance:
Upside zone: 25350
Rejection zone: 25280
Support: 25074
Bias: Reactive, wait for confirmation
Sector watch: Cement, Defence

XAUUSD Beginning Big Elliot Wave 3based on elliot waves counting on the daily timeframe we are currently in wave 2 pullback.
if we have seen the bottom of wave 2 already, the next wave is going to be the big impulse wave 3, with target marked on the chart below.
TLD: Long

Just a national level tug of war || XAUSDAs of January 21, 2026, gold has smashed through several record highs, recently trading above $4,800 per ounce (and over ₹1,50,000 per 10 grams in India). This "uninterrupted uptrend" is being driven by a rare combination of geopolitical shocks and shifts in the global financial system.
To help you make sense of it, here is a breakdown of the four "pillars" driving today's market:
1. The "Greenland Factor" and Trade Wars
The most immediate cause of the current price surge is a massive diplomatic and trade standoff.
Geopolitical Friction: Tensions have escalated following U.S. President Trump’s pursuit of acquiring Greenland. This has led to a "transatlantic trade conflict" with Europe.
Tariff Threats: The U.S. has announced 10% tariffs on several European countries (like France, Germany, and the UK) starting February 1, with threats to raise them to 25% by June.
Impact: Whenever the world’s biggest economies fight, investors panic and "flight to safety"—which means buying gold.
2. Central Banks are "De-Dollarizing"
For the first time since 1996, gold now accounts for a larger share of global central bank reserves than U.S. Treasuries.
Record Buying: Central banks (led by Poland, China, and India) are buying gold at a historic pace to diversify away from the U.S. dollar.
The "Hedge" Strategy: Central banks view gold as the ultimate insurance policy against currency sanctions or a potential collapse of the fiat currency system.
3. Economic Volatility (Inflation & Interest Rates)
Weakening Dollar: The U.S. dollar has faced significant pressure in early 2026. Because gold is priced in dollars, a weaker dollar makes gold cheaper for international buyers, driving up demand.
Interest Rates: While the Federal Reserve has been hesitant to cut rates aggressively, the market is pricing in "lower for longer" yields. Since gold doesn't pay interest, it becomes much more attractive when bonds and savings accounts offer lower returns.
4. Supply and Demand Imbalance
Limited Mining: New gold discoveries are at a standstill. Mining output is only growing by about 0.3% per year, which isn't enough to keep up with the massive surge in investor demand.
Investment Inflows: Gold ETFs (Exchange Traded Funds) saw record-breaking inflows in late 2025 and early 2026, as even retail investors began treating gold as a primary wealth-protection asset rather than just a side investment.
