Just a national level tug of war || XAUSDAs of January 21, 2026, gold has smashed through several record highs, recently trading above $4,800 per ounce (and over ₹1,50,000 per 10 grams in India). This "uninterrupted uptrend" is being driven by a rare combination of geopolitical shocks and shifts in the global financial system.
To help you make sense of it, here is a breakdown of the four "pillars" driving today's market:
1. The "Greenland Factor" and Trade Wars
The most immediate cause of the current price surge is a massive diplomatic and trade standoff.
Geopolitical Friction: Tensions have escalated following U.S. President Trump’s pursuit of acquiring Greenland. This has led to a "transatlantic trade conflict" with Europe.
Tariff Threats: The U.S. has announced 10% tariffs on several European countries (like France, Germany, and the UK) starting February 1, with threats to raise them to 25% by June.
Impact: Whenever the world’s biggest economies fight, investors panic and "flight to safety"—which means buying gold.
2. Central Banks are "De-Dollarizing"
For the first time since 1996, gold now accounts for a larger share of global central bank reserves than U.S. Treasuries.
Record Buying: Central banks (led by Poland, China, and India) are buying gold at a historic pace to diversify away from the U.S. dollar.
The "Hedge" Strategy: Central banks view gold as the ultimate insurance policy against currency sanctions or a potential collapse of the fiat currency system.
3. Economic Volatility (Inflation & Interest Rates)
Weakening Dollar: The U.S. dollar has faced significant pressure in early 2026. Because gold is priced in dollars, a weaker dollar makes gold cheaper for international buyers, driving up demand.
Interest Rates: While the Federal Reserve has been hesitant to cut rates aggressively, the market is pricing in "lower for longer" yields. Since gold doesn't pay interest, it becomes much more attractive when bonds and savings accounts offer lower returns.
4. Supply and Demand Imbalance
Limited Mining: New gold discoveries are at a standstill. Mining output is only growing by about 0.3% per year, which isn't enough to keep up with the massive surge in investor demand.
Investment Inflows: Gold ETFs (Exchange Traded Funds) saw record-breaking inflows in late 2025 and early 2026, as even retail investors began treating gold as a primary wealth-protection asset rather than just a side investment.
Trend Analysis

THANGAMAYIL: Breakout Retest Holds | Price & Volume SpeakTimeframe: Daily
Stock: THANGAMAYIL
Market: NSE
📦 Base → Breakout
Price spent multiple weeks inside a well-defined consolidation box, indicating balance and accumulation.
On 07 January 2026, price cleanly broke above this range with strong bullish expansion and clear volume participation — confirming buyer initiative.
🔁 Retest With Clear Rejection (21 January 2026)
Price revisited the breakout zone today and formed a bullish rejection candle on the daily timeframe.
Important clarity:
This is not a perfect bullish hammer
It is not a textbook dragonfly doji
However, the lower rejection wick is long and decisive enough to confirm rejection of lower prices
Price acceptance above the breakout zone is what matters — not candle names.
📊 Volume Validates the Move
Breakout → high volume
Retest → even higher volume
This indicates strong absorption of supply and confirms that buyers defended structure aggressively.
🎯 Trade View (Price-Based)
Swing Trade
Stop Loss: Below today’s retest candle low
Positional Trade
Stop Loss: ₹2970 (lower boundary of the earlier consolidation box)
Targets
₹4150 as first objective
Thereafter, trail stops and ride the trend
Suitable for swing and positional traders.
✅ Summary
No indicators.
No news.
No opinions.
Just structure, breakout, retest, rejection, and volume.
📌 Disclaimer
This is not financial advice.
Shared strictly for educational and analysis purposes.
Please manage risk responsibly and trade as per your own plan.
👍 If you found this useful, consider boosting 👍 and following for more clean price–volume setups.
💡 Feel free to suggest stocks or structures you’d like me to analyse next.

Xau USD Bullish Xau USD buying come at 4671 and then boom to 4852 . It's good bet as Usa is Asking for greenland and Max EU countries are selling USA bonds. Then Buying will come more in Safe haven assest like Gold & Silver . Xau USD may touch 5000 in coming week . Keep SL . Trial SL.
Tgt 5000+

NATURALGAS BOOM Naturalgas gas make a high of 444on 21 Jan 26. It's good move. Entry was given near 297 . Keep Trial SL don't make new entry . It's news based Rally.
Tgt 350+

Option TradingRetail and Institutional Option Trading
Retail traders usually focus on buying options, hoping for fast price movement. Institutions, on the other hand, mostly sell options because time decay (Theta) works in their favor.
Key differences:
Retail traders chase momentum and news
Institutions focus on probability, statistics, and data
Retail uses indicators
Institutions use Option Chain, OI, volume, and volatility
Retail looks for big wins
Institutions look for consistent returns
Institutions understand that 90% of options expire worthless, which is why option writing dominates institutional strategies.

Nifty Intraday Analysis for 21st January 2026NSE:NIFTY
Index has resistance near 25400 – 25450 range and if index crosses and sustains above this level then may reach near 25625 – 26675 range.
Nifty has immediate support near 25050 – 25000 range and if this support is broken then index may tank near 24825 – 24775 range.
The downward trend is expected to continue due to the US - Europe conflict on Greenland. Short term uptrend will be confirmed only if the index sustains and closes above 25500 level.

Banknifty Intraday Analysis for 21st January 2026NSE:BANKNIFTY
Index has resistance near 59800 – 59900 range and if index crosses and sustains above this level then may reach near 60300 – 60400 range.
Banknifty has immediate support near 59000 - 58900 range and if this support is broken then index may tank near 58500 - 58400 range.
The downward trend is expected to continue due to the US - Europe conflict on Greenland. Short term uptrend will be confirmed only if the index sustains and closes above 59800 level.

Finnifty Intraday Analysis for 21st January 2026NSE:CNXFINANCE
Index has resistance near 27425 - 27475 range and if index crosses and sustains above this level then may reach near 27700 - 27750 range.
Finnifty has immediate support near 26975 – 26925 range and if this support is broken then index may tank near 26700 – 26650 range.
The downward trend is expected to continue due to the US - Europe conflict on Greenland. Short term uptrend will be confirmed only if the index sustains and closes above 27600 level.

Midnifty Intraday Analysis for 21st January 2026NSE:NIFTY_MID_SELECT
Index has immediate resistance near 13425 – 13450 range and if index crosses and sustains above this level then may reach 13575 – 13600 range.
Midnifty has immediate support near 13175 – 13150 range and if this support is broken then index may tank near 13025 – 13000 range.
The downward trend is expected to continue due to the US - Europe conflict on Greenland. Short term uptrend will be confirmed only if the index sustains and closes above 13500 level.

Banknifty key levels for this year 2026Banknifty key levels for this year 2026.
These levels are derived from past 52 weeks data of Banknifty.
These key levels will act as major support and resistance for the coming weeks.
100% candles are not correct, it can be deceiving, don`t fall into traps.
Line chart might help.
Plot these levels and check yourself.
Have Green New Year (2+0+2+6=1)

XAUUSD/GOLD 30MIN BUY STOP PROJECTION 21.01.26Pattern: Symmetrical Triangle
Bias: Bullish breakout
Zone: Trendline + Fair Value Gap (strong demand area)
🔥 Next Move Expectation
✅ If price breaks and holds above the triangle resistance,
➡️ Strong upside rally is expected (Buy Stop setup).
🎯 Targets
Target 1: 4870
Target 2: 4875
Target 3: 4886 – 4888 (Major Resistance R2 zone)
🛑 Stop Loss
Stoploss: Below 4835 – 4840 support zone
➡️ If this breaks, downside continuation is possible.

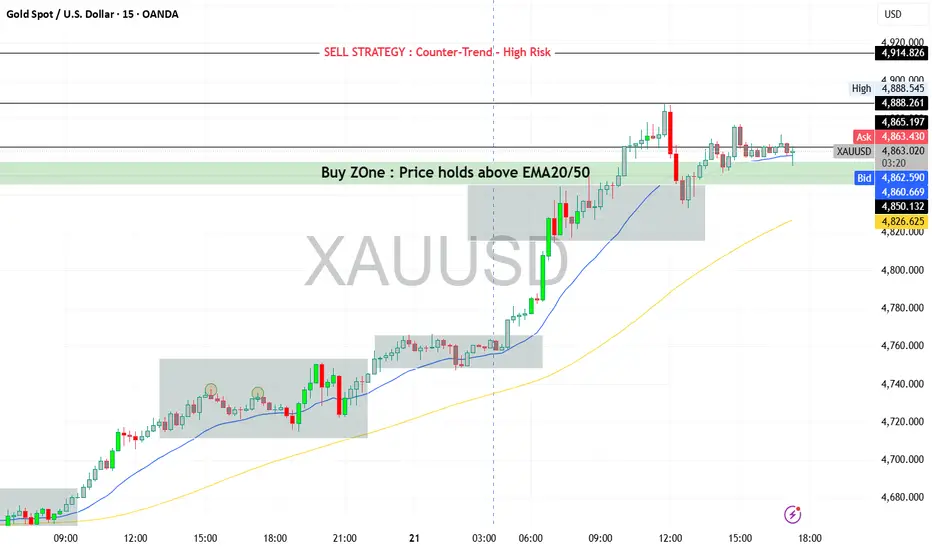
XAUUSD (Gold) | Bullish vs Bearish Scenario | Trading SetupBullish vs Bearish View
Bullish Scenario (Primary Bias – Trend Continuation)
Trend remains strongly bullish as long as price holds above the pivot zone (4858–4845).
Buyers are in control, supported by ADX strength, MACD momentum, and moving average
alignment.
Break and hold above 4888 opens the door for further upside expansion.
Bearish Scenario (Corrective Pullback Only)
Bearish moves are considered corrective, not trend-reversing, unless price falls below 4800.
Overbought conditions may trigger short-term profit booking, but trend remains bullish
above key supports.
Key Levels to Watch
Resistance Levels
4888 – 4895 (Day high / breakout zone)
4914
4939 – 4950 (extension zone)
Support Levels
4858 – Pivot
4845
4829
4803
4773 (strong trend support)
Intraday Trading Strategy (Day Trading Plan)
Strategy Type:
Trend Continuation Buy-on-Dips
Buy Setup
Buy Zone: 4858 – 4845 (pivot support / minor pullback)
Confirmation:
Price holds above EMA20 / EMA50
Bullish rejection candle or continuation pattern on M15–M30
Targets
Target 1: 4888
Target 2: 4914
Target 3 (extension): 4939
Stop Loss
Intraday SL: Below 4825
Aggressive SL: Below 4800 (trend invalidation zone)
Alternative Sell Strategy (Counter-Trend – High Risk)
⚠️Only for experienced traders
Sell Zone: 4914 – 4940
Condition: Clear rejection + bearish divergence on M15/M30
Target: 4880 → 4858
Stop Loss: Above 4955
Preferred Trading Style Today
✔️Buy on dips
❌Avoid chasing price at highs
❌Avoid heavy counter-trend sells
#Nifty - PANIC SELLING due to global markets what’s next 24960?Due to global markets what’s condition nifty is not holding support on all downside move
What’s next
If 25160 holds today, UPMOVE/ RECOVERY will start
If 25160 breaks, next reversal levels
25025/24960/24780
24960 reversal possible if not 24780 is good. If levels if comes not to miss

Sensex - Expiry day analysis Jan 22The price faced resistance at the 84100 zone and was falling for a few days. Now it is having a pullback from the 81100 zone. 82000 can act as resistance as it coincides with the trend line resistance.
Buy above 82040 with the stop loss of 81880 for the targets 82180, 82300, 82460, 82600 and 82780.
Sell below 81700 with the stop loss of 81860 for the targets 81560, 81400, 81240, 81080 and 80900.
As per the daily chart, the price is testing the trend line support.
Always do your analysis before taking any trade.

Part 2 Institutional Option Trading VS. Technical Analysis What Is an Option?
An option is a financial contract that gives the buyer the right, but not the obligation, to buy or sell an underlying asset at a predetermined price, on or before a specific date.
There are two types of options:
Call Option
Put Option
Each option contract is defined by:
Underlying asset
Strike price
Expiry date
Premium (price of the option)

Part 1 Institutional Option Trading VS. Technical Analysis Introduction to Option Trading
Option trading is one of the most powerful yet misunderstood segments of the financial markets. Unlike traditional investing, where traders buy or sell shares outright, options are derivative instruments whose value is derived from an underlying asset such as stocks, indices, commodities, or currencies.
Options provide traders with flexibility, leverage, risk management tools, and income generation opportunities. However, they also involve complexity and risk, making education and discipline essential.
In modern markets, especially after the rise of derivatives exchanges like NSE, CBOE, and global electronic trading platforms, option trading has become central to institutional strategies, hedge funds, proprietary desks, and advanced retail traders.

Platinum Forecast - 3000-3500+ possible in near futureCurrently it is consolidating at the ATH breakout line, once it picks up the momentum it will head towards 3000-3500+ levels..

XAUUSD - Brian | H2 Technical AnalysisGold remains constructive and continues to hold a bullish structure despite last night’s sharp cross-market volatility. The main driver behind the larger moves was heavy selling pressure in U.S. equities, which briefly accelerated safe-haven demand and helped support gold.
On the macro side, tensions linked to Greenland and renewed tariff rhetoric have increased uncertainty across markets. The USD weakened in the short term, while the EUR appears more exposed to medium-term geopolitical and policy risks. This backdrop generally remains supportive for gold, especially on pullbacks into key support.
Technical Structure & Key Zones (H2)
On the H2 timeframe, XAUUSD is still trading within a clear uptrend: price respects the rising trendline and continues to print higher highs and higher lows, confirming buyers remain in control of the primary structure.
The latest impulse leg has left several important technical areas:
A Fair Value Gap (FVG) below current price, which may be revisited if a technical retracement develops.
The 0.618 Fibonacci retracement zone at 4750–4755, aligned with the rising trendline — a strong confluence support for a deeper pullback scenario.
A higher, near-term demand area around 4812, suitable for shallow pullbacks during strong momentum conditions.
As long as price holds above these demand zones, the medium-term bullish structure remains intact.
Liquidity & Forward Expectations
To the upside, the market still has room to expand toward prior highs and the ATH liquidity area. Any short-term pullback, if it occurs, may simply act as a reset before continuation — especially while macro volatility remains elevated.
Reminder: strong trends rarely move in a straight line. Pauses and retracements are normal and often offer better participation than chasing price at the highs.
Trading Bias
Primary bias: Buy pullbacks in line with the trend; avoid FOMO entries near the top.
Key zones to watch:
4812: shallow pullback / momentum continuation zone
4750–4755: deeper pullback into 0.618 + trendline confluence
Preferred monitoring timeframe: H1–H4 to reduce noise
Risk management remains critical given the market’s sensitivity to news flow and cross-asset swings.
Refer to the accompanying chart for a detailed view of the structure, FVG, and key pullback zones.
Follow the TradingView channel to get early updates and join the discussion on market structure and trade ideas.

HOW TO TRADE 5 MIN ORB STRUCTURE?✅ What is 5-Min ORB?
ORB = Opening Range Breakout
You mark the high & low of the first 5-minute candle after market open.
That first 5-min range becomes the battle zone for the day.
🔥 Step 1: Mark the ORB Levels
After first 5-min candle closes, mark:
✅ ORB High
✅ ORB Low
✅ ORB Mid (optional)
🔥 Step 2: Read the Structure First (MOST IMPORTANT)
Before taking any breakout, check:
Bullish structure =
Higher high + higher low forming
Strong green candles
No heavy selling wicks from top
Bearish structure =
Lower low + lower high forming
Strong red candles
Rejections from above
📌 If structure is unclear → no trade
✅ Best ORB Entry Types (Structure Based)
1️⃣ Break + Retest Entry (Best & Safe)
BUY Setup
Price breaks ORB High
Candle closes above ORB High
Then price retests ORB High
Retest holds + bullish candle forms → BUY
📌 Stoploss: below retest low / ORB high
📌 Target: 1:2 or next resistance zone
SELL Setup
Price breaks ORB Low
Candle closes below ORB Low
Retest ORB Low fails → SELL
📌 Stoploss: above retest high / ORB low
📌 Target: 1:2 or next support zone
2️⃣ Impulse Breakout Entry (Only when momentum is strong)
Take direct breakout only if:
✅ Big candle closes outside ORB
✅ Next candle continues in same direction
✅ No long wick rejection
📌 This is a “momentum ORB” trade.
3️⃣ Fakeout ORB (Trap Trade using structure)
Fake breakout happens when
Price breaks ORB High/Low
But immediately comes back inside range
Opposite strong candle appears
Example
Price breaks ORB High → fails → closes back inside
➡️ That’s weakness → SELL toward ORB Low
📌 Stoploss: above fakeout high
📌 Target: ORB mid / ORB low
🧠 ORB Structure Rules (Powerful)
✅ Rule 1: First breakout is not always real
Many times market gives fake breakout first to trap traders.
So wait for:
✔ close confirmation
✔ retest
✔ structure support
✅ Rule 2: ORB range size matters
Too small ORB → whipsaw chances high
Too big ORB → breakout needs time
📌 Best ORB = medium range (clean candle)
✅ Rule 3: Time filter
Best ORB moves usually happen:
🕘 9:20 to 10:30
After that, breakouts can turn sideways.
🎯 Targets using Structure
Instead of fixed targets, use:
✅ Previous day High/Low
✅ Gap fill zone
✅ Swing high / swing low
✅ Supply & demand zones
✅ Round numbers (like 22500 / 22600 etc.)
❌ Avoid ORB Trades When
🚫 ORB is inside heavy support/resistance zone
🚫 Market is already in strong trend before open
🚫 ORB breakout candle has long wick
🚫 Breakout happens after long sideways chop
🚫 Volume is dead + candles are small
📌 Simple ORB Checklist (Quick)
Before trade ask:
✅ Did candle close outside ORB?
✅ Is structure supporting direction?
✅ Break + retest happened?
✅ Stoploss is logical?
✅ Target is clear?
✅ Risk:Reward at least 1:2?
If any answer is NO → skip trade
⭐ Best ORB Strategy Summary
Trade ORB like a price action trader:
✔ Break → Close → Retest → Continue
✔ Follow structure, not excitement
✔ Avoid fakeouts by waiting confirmation
✔ Keep SL tight & defined

BNBUSDTAKE PROFIT TARGETS
📍 You can scale your exits:
Target USDT Level Notes
🥇 Take Profit 1 $900 First resistance on bounce
🥈 Take Profit 2 $915–$920 Medium resistance zone
🏆 Take Profit 3 $935–$950 Stronger resistance above recent swing highs

Bitcoin Bybit chart analysis JENUARY 20Hello
It's a Bitcoin Guide.
If you "follow"
You can receive real-time movement paths and comment notifications on major sections.
If my analysis was helpful,
Please click the booster button at the bottom.
This is a Bitcoin 30-minute chart.
There are no Nasdaq indicators released today.
*Conditional red finger long position strategy.
1. After touching the purple finger once at the top,
$91,069.8 is the entry point for a long position at the bottom.
2. $92,611.2 is the initial target for a long position -> Target prices are Top, Good, and so on.
If the strategy is successful, $91,954 can be used as a re-entry point for a long position.
If the price falls immediately without touching the first purple finger at the top, $90,142.8 is the final long position waiting point at the second section,
and the stop loss is set if the green support line is broken.
If the price falls to section 2,
the possibility of a sideways movement increases, and there is an uptrend line below it. If the Nasdaq falls sharply,
the price remains open at $89,029.6,
and from the bottom, $89,029.6 is where Bitcoin's mid-term pattern is likely to recover.
Please use my analysis to this point for reference only.
I hope you operate safely, with a focus on principled trading and stop-loss orders.
Thank you.

Will Aster DM Reverse from the Demand Zone ? cmp 563.70Stock Update – *Aster DM Healthcare cmp 563.70*
The stock has corrected around 26% from its all time high and is now taking support on a major weekly demand zone.
Turned technically bullish & Price action near support shows stability which indicating a potential trend reversal from lower levels.
Support : 529 - 542
Safe bet for current market scenario in Healthcare space
*8% to 17% Upside Potential*

JK TYREJK TYRE is consolidating near the previous Swing High Supply zone around 500–510 after a strong uptrend from lower levels. Instead of a sharp rejection, price is holding near resistance and contracting, while sustaining above the weekly 9 EMA. This price behaviour often points to supply absorption rather than distribution.
The stock continues to show leadership strength, with a high RS Rating (92 on the daily chart), indicating strong relative performance versus the broader market.
From a probability perspective:
> Sustained acceptance above the supply zone with expansion could support trend continuation.
> Failure to hold above key EMAs and acceptance below the range would suggest supply is still active.
On the fundamental side , the company has outlined a ₹5,000 crore capex plan over the next few years, focused on capacity expansion and long-term growth, which adds supportive context to the technical structure.
Keep it in your watchlist.
✅ If you like my analysis, please follow me here as a token of appreciation :) in.tradingview.com/u/SatpalS/
📌 For learning and educational purposes only, not a recommendation. Please consult your financial advisor before investing.
