Part 5 Advance Trading Strategies Option Trading in Different Market Conditions
A. Trending Market
Buyers get benefit
CE/PE give good returns
B. Sideways Market
Sellers benefit
Strangles, straddles perform well
C. High Volatility
Premium expands
Good for selling post-news
D. Low Volatility
Cheap premiums
Good for buying before breakout
Trendcontinuation

Renewable Energy Certificates (RECs) and Carbon Credits1. Introduction: Why RECs and Carbon Credits Matter
As countries, corporations, and investors push toward net-zero emissions, two market-based instruments have become central to climate policy and sustainable finance: Renewable Energy Certificates (RECs) and Carbon Credits.
Both aim to reduce greenhouse gas (GHG) emissions, but they operate in different markets, address different problems, and serve different compliance and voluntary needs. Understanding their structure, pricing, and role is critical for policymakers, power producers, corporates, and traders—especially in fast-growing markets like India.
2. Renewable Energy Certificates (RECs): Core Concept
A Renewable Energy Certificate (REC) represents proof that 1 megawatt-hour (MWh) of electricity has been generated from a renewable energy source such as solar, wind, hydro, biomass, or geothermal.
When a renewable power producer generates electricity:
The physical electricity flows into the grid
The environmental attribute is unbundled and issued as a REC
This separation allows electricity consumers to claim renewable usage even if the physical power they consume is from the conventional grid mix.
3. Purpose of RECs
The primary objectives of RECs are:
Regulatory Compliance
In many countries, utilities and large power consumers must meet Renewable Purchase Obligations (RPOs). RECs allow entities that cannot physically procure green power to meet these obligations financially.
Market-Based Incentives
RECs provide additional revenue to renewable generators, improving project viability without direct subsidies.
Corporate Sustainability Claims
Corporates use RECs to meet ESG targets, claim renewable sourcing, and comply with Scope 2 emission accounting under GHG Protocols.
4. REC Markets: Compliance vs Voluntary
Compliance REC Markets
Mandated by government regulation
Prices often volatile and policy-driven
Examples:
India (Solar & Non-Solar RECs)
US state-level Renewable Portfolio Standards (RPS)
Voluntary REC Markets
Purchased by corporates or individuals
Focus on brand value, ESG disclosure, and carbon neutrality
Examples:
International Renewable Energy Certificates (I-RECs)
Guarantees of Origin (EU)
5. India’s REC Framework
India’s REC mechanism is overseen by CERC and operated via power exchanges like IEX and PXIL.
Key features:
Solar RECs and Non-Solar RECs
Issued by the National Load Despatch Centre (NLDC)
Traded through exchange-based auctions
Used for RPO compliance by DISCOMs, open-access consumers, and captive users
India’s REC prices have historically been:
Highly cyclical
Influenced by RPO enforcement
Sensitive to supply-demand mismatches
6. Carbon Credits: Core Concept
A Carbon Credit represents the reduction or removal of 1 metric tonne of CO₂ equivalent (tCO₂e) from the atmosphere.
Unlike RECs (which are linked to energy generation), carbon credits are linked directly to emission reductions, regardless of the sector.
Carbon credits are generated through projects such as:
Renewable energy installations
Afforestation and reforestation
Methane capture
Energy efficiency upgrades
Industrial process improvements
7. Carbon Markets: Compliance vs Voluntary
Compliance Carbon Markets
Created under international or national regulation.
Examples:
EU Emissions Trading System (EU ETS)
China National ETS
California Cap-and-Trade
Key traits:
Mandatory caps on emissions
Allowances traded among regulated entities
Prices often reflect marginal abatement cost
Voluntary Carbon Markets (VCM)
Used by corporates to offset emissions beyond regulatory requirements.
Standards include:
Verra (VCS)
Gold Standard
American Carbon Registry (ACR)
VCM prices vary widely depending on:
Project type
Vintage year
Verification quality
Co-benefits (biodiversity, social impact)
8. Key Differences: RECs vs Carbon Credits
Aspect RECs Carbon Credits
Unit 1 MWh renewable power 1 tonne CO₂e
Purpose Renewable sourcing Emission offset
Scope Electricity only Multi-sector
Accounting Scope 2 Scope 1, 2, or 3
Market Power & ESG Climate finance
Permanence Linked to generation Linked to reduction/removal
9. Corporate Use Cases
Corporates often use both instruments together:
RECs → Claim renewable electricity usage
Carbon credits → Offset residual emissions
For example:
A data center uses RECs to claim 100% renewable power
It then purchases carbon credits to offset diesel backup, logistics, and Scope 3 emissions
10. Price Dynamics and Risks
REC Price Drivers
RPO targets and enforcement
Renewable capacity additions
Regulatory changes
DISCOM financial health
Carbon Credit Price Drivers
Climate policy ambition
Corporate net-zero commitments
Quality and credibility of credits
Supply constraints for nature-based projects
Key Risks
Double counting
Greenwashing
Policy reversals
Low-quality offsets undermining credibility
11. Emerging Trends
Article 6 of Paris Agreement
Enables cross-border carbon trading and international credit transfers.
High-Integrity Carbon Credits
Shift toward removal-based credits (DAC, biochar).
India’s Carbon Market (ICM)
India is transitioning from PAT & REC mechanisms toward a unified Indian Carbon Credit Trading Scheme (CCTS).
Tokenization & Digital MRV
Blockchain-based tracking for transparency and trust.
12. Investment and Trading Perspective
For investors and traders:
RECs offer policy-driven cyclical trades
Carbon credits represent a long-term structural decarbonization play
Quality differentiation will drive price dispersion
Carbon markets may become a new asset class, similar to power and gas
13. Conclusion
Renewable Energy Certificates and Carbon Credits are cornerstones of market-based climate action. RECs accelerate renewable adoption by monetizing clean energy attributes, while carbon credits provide flexibility in achieving emission reduction targets across the economy.
As climate regulation tightens and ESG scrutiny deepens, these instruments will evolve from niche compliance tools into strategic financial assets, shaping energy markets, corporate strategy, and global capital flows.

Part 11 Trading Master Class With Experts Time Decay (Theta)
Theta represents how much value option will lose per day even if price doesn’t move.
Sellers LOVE Theta
Buyers FEAR Theta
Near expiry:
A ₹200 premium may fall to ₹20 even with little change in spot.
This is how sellers make money consistently.

Part 4 Institutional Option Trading Vs. Technical AnalysisBasic Terminology of Options
Underlying: Asset on which the option is based (Nifty, Bank Nifty, stocks).
Strike Price: The fixed price at which the holder can buy or sell.
Premium: The price paid to buy an option.
Expiry Date: Date on which the option becomes void.
Lot Size: Minimum quantity you must trade (e.g., Nifty lot = 50).
Intrinsic Value: Real value if the option is exercised now.
Time Value: Extra premium due to remaining time until expiry.
Option Buyer: Pays premium, has limited risk and unlimited reward potential.
Option Seller (Writer): Receives premium, has limited reward and potentially high risk.

Thematic ETFs & Sector Funds for India in 2026🧠 1. Understanding Thematic & Sector Funds in India
📌 What Are Sector Funds?
Sector funds are investment vehicles (often mutual funds or ETFs) that concentrate their assets in one specific industry or sector of the economy—like banking, IT, infrastructure, or energy. These funds aim to capture the full performance cycle of that one sector. They hold only stocks from that sector and therefore have high concentration risk and potentially high returns if the sector outperforms.
📌 What Are Thematic Funds?
Thematic funds also focus on a broad theme or trend—but rather than being confined to a single sector, they may span multiple sectors that fit the underlying idea. A theme could be consumption, business cycle, digital transformation, or green energy. Thematic funds must invest at least ~80% of their assets in stocks tied to the theme.
📌 Thematic ETFs vs Sector Mutual Funds
ETFs (Exchange-Traded Funds): Listed on stock exchanges and traded like stocks, ETFs can offer lower expense ratios, intraday pricing, and transparency.
Mutual Funds (Sector or Thematic): Often actively managed and traded based on NAV (net asset value) at the end of the trading day.
Difference in Practice: ETFs are typically passive (tracking an index), while sector/thematic mutual funds can be active or semi-passive.
📊 2. Why Investors Use These Funds in 2026
🎯 Focused Exposure
Sector/thematic funds allow investors to selectively target growth drivers in the Indian economy—such as rapid urbanisation, rising middle-class consumption, infrastructure spend, or digitisation.
📉 Diversification vs Concentration
Sector funds have minimal diversification, giving deep exposure to sector movements.
Thematic funds, because they span multiple sectors linked by a narrative (e.g., ESG or digital economy), offer moderate diversification relative to sector funds, but still higher concentration than broad equity funds.
📈 Tactical Strategies
Many investors view these funds as tactical or satellite allocations (not core holding), because returns and risk can vary dramatically depending on economic cycles. For instance, sector funds often work very well when a specific sector is booming—but can lag significantly when that sector weakens. Experts suggest using them only as a small part of a broader portfolio strategy.
📌 3. Major Themes & Sectors in the Indian Market (2026)
📌 A. Infrastructure & Capex
India’s infrastructure push, under multiple government initiatives, continues to be a key secular theme. Funds in this space invest in companies tied to construction, engineering services, power utilities, logistics, and related capital goods.
Examples:
ICICI Pru Nifty Infrastructure ETF — tracks infrastructure companies.
Quant Infrastructure Fund — strong long-term historical CAGR among thematic funds.
Why It Matters: India’s National Infrastructure Pipeline and related spending targets fuel demand for businesses in this space.
📌 B. Consumption & Domestic Growth
As household incomes rise, themes tied to domestic consumption (ranging from FMCG to automobiles and retail services) remain strong.
Examples:
Nippon India ETF Nifty India Consumption — exposure to consumption companies.
SBI Consumption Opportunities Fund — thematic mutual fund capturing diverse consumer demand.
Why Few Investors Like It: Consumption trends are closely linked to demographic changes and urbanisation, often yielding stable growth opportunities.
📌 C. Banking & Financial Services
Traditionally a pillar of the Indian economy, financials—especially banks and PSU banks—remain a favourite for tactical investors.
Examples:
Kotak Nifty PSU Bank ETF — focused on public sector banks.
Nippon India ETF Nifty PSU Bank BeES — tracks PSU bank index.
Investor Angle: Rotational strategies sometimes favour this sector during banking or credit cycles.
📌 D. Technology & Digital Themes
Tech exposure spans not just traditional IT services, but digital transformation trends such as cloud, automation, and AI.
Examples:
ICICI Pru Nifty IT ETF — technology sector ETF.
ICICI Pru Technology Fund — mutual fund with broader tech exposure.
Why It’s Catchy: Tech firms often benefit from global digital adoption trends, but can be volatile due to global cyclical pressures.
📌 E. Defence & Strategic Industries
With rising defence spending and a focus on domestic manufacturing, defence has become a thematic focus.
Examples:
Motilal Oswal Nifty India Defence ETF — defence-focused ETF.
Why It’s Trending: Government policy support and strategic investments in aerospace and defence manufacturing bolster this theme.
📌 F. Metals, Energy & Commodities
Commodity cycles and industrial demand also create opportunities—from metals/refineries to energy companies.
Examples:
Mirae Asset Nifty Metal ETF — metals sector exposure.
Motilal Oswal Nifty Energy ETF — ETFs tracking energy & utilities.
🎯 4. Thematic Funds (Mutual Funds) to Watch in 2026
Sectoral mutual funds—another important segment—are actively managed thematic equity funds.
Examples (based on performance or popularity):
ICICI Pru Business Cycle Fund — focuses on cyclical trends across sectors.
SBI PSU Fund — diversified PSU-oriented theme.
HDFC Defence Fund — defence industry exposure.
Quant Infrastructure Fund — strong historical CAGR.
DSP Healthcare Fund & SBI Healthcare Opportunities Fund — healthcare & pharma themes.
These funds span a variety of thematic ideas including business cycles, PSUs, infrastructure, technology, and healthcare.
⚠️ 5. Risks & Limitations
🔥 High Concentration Risk
By design, sector/thematic funds often invest heavily in a narrow universe. While this can amplify gains when the theme works, it also means sharper declines when it doesn’t.
🧨 Volatility & Timing
Performance often swings with economic cycles or sentiment—making timing important. Many retail investors enter after strong performance, only to face downturns later.
📉 Inflow Fluctuations
Recent market data show inflows into thematic/sector funds have fluctuated sharply, with periods of both rapid growth and sudden slowdown—suggesting investor sentiment is volatile.
🧠 ETF Liquidity Concerns
Unlike broad index ETFs, many sector/theme ETFs suffer from lower liquidity, which can widen bid-ask spreads and affect trading prices.
📊 6. How These Fit Into a Portfolio (Practical Tips)
🧩 Core vs Satellite Strategy
Core Investments: Broad index funds or diversified equity funds.
Satellite Allocation: Sector/thematic funds (5–15% of total equity allocation), for tactical exposure to growth trends.
📆 Long vs Short Term
Use sector/thematic funds for long-term structural themes, but monitor risk and rebalance regularly.
For short-term tactical plays, ETFs allow more flexibility due to intraday pricing.
⚖️ Diversification Balance
To mitigate risk, never concentrate a major portion of your portfolio solely in one theme/sector—even if the narrative looks strong.
🧠 Conclusion
In 2026, thematic ETFs and sector funds remain powerful investment tools in India for capturing specific growth stories—from infrastructure and defence to tech and consumption themes. They offer a focused way to participate in structural tailwinds. However, they come with higher concentration risk and volatility than broad market exposures. Used wisely—as satellite elements within a diverse portfolio—they can enhance returns, but they are not a replacement for diversified investing.
If you're considering these, align your choice with your risk appetite, time horizon, and thematic conviction, and review regularly to ensure the underlying story still holds.

Retail investor behavior changes post-20251. Retail Markets Are Evolving — Not Repeating Old Patterns
The retail investor segment — once dismissed as undisciplined, speculative, or marginal — has matured into a structurally relevant market force. Retail participation now influences not only trading volumes but also broader asset flows and sentiment. Research in 2025 shows that retail investors are making more strategic decisions and timing markets better than stereotypes suggest, challenging conventional assumptions about “amateur” investors.
This evolution is not uniform globally, but common themes emerge across regions, asset classes, and platforms.
2. Demographic Shifts: Younger, Tech-Native Investors Dominate
One of the most profound changes in retail investing post-2025 is the demographic profile of participants:
Gen Z and Millennials are engaging earlier — many starting to invest in their late teens or early 20s — far sooner than previous generations.
Younger investors are more receptive to AI-assisted advice, open to automated portfolio guidance, and more comfortable with digital ecosystems.
This shift not only increases the number of retail accounts but reshapes risk preferences, preferences for asset types, and methods of market interaction.
Across markets, this younger cohort is less bound by traditional investing conventions and more likely to explore alternative assets, thematic strategies, and digital-first tools.
3. Digital Platforms Are Central to Retail Behavior
The rise of mobile trading apps — with real-time alerts, frictionless execution, and intuitive interfaces — is fundamental to post-2025 retail behavior:
Zero-commission trading has become the global norm, enabling more frequent trading and attracting a broader, younger base.
Investors use apps to trade fractional shares, access international markets, and mix traditional and alternative assets seamlessly.
Security and trust features, including biometric logins and fraud detection, are now expected rather than optional.
These platforms blur the boundary between “investing” and “social finance”: funds, equities, crypto, ETFs, and educational content all coexist in one ecosystem.
4. Broader Access, Greater Participation
Before 2020, market access was limited by cost, information asymmetry, and institutional barriers. Now:
Retail investors can trade international stocks, ETFs, and digital assets with minimal friction.
Brokerage innovations like fractional investing democratize high-priced stocks.
Emerging market investors — including in India — are increasingly participating directly in equities, moving away from fixed deposits and traditional assets.
This has increased retail influence in indices and capital markets. In some markets like India, retail investors now hold a significant share of total market cap, reshaping ownership structures and domestic liquidity.
5. Portfolio Strategies Are Becoming More Sophisticated
Although early retail behavior was often associated with speculation, the reality post-2025 is more nuanced:
Goal-Oriented and Long-Term Thinking
Retail portfolios increasingly reflect long-term objectives — retirement, wealth accumulation, home ownership — rather than pure short-term speculation.
Diversification and Passive Investing
Low-cost ETFs and passive investing vehicles are popular, with many retail investors seeking diversified exposure to sectors like AI, clean energy, and global indices.
Sustainable & ESG Focus
Environmental, Social, and Governance (ESG) considerations are shaping allocations, particularly among younger investors who view sustainability as part of value investing.
Measured Risk Appetite
While risk tolerance remains varied, evidence suggests retail traders are becoming more selective and less reactive than in past cycles. Some research highlights that many retail traders provide liquidity and market support rather than heightening volatility.
6. Behavior Under Stress: Caution and Contradictions
Retail investor behavior isn’t a straight line toward efficiency. In fact, periods of market stress reveal key tendencies:
Sentiment Fluctuates with Macro Conditions
In late 2025, institutional signals of caution led retail traders to reduce bullish bets, especially in sectors like tech, suggesting a more cautious stance in uncertain markets.
Behavioral Biases Still Matter
Despite growth in sophistication, classic biases — like herding, confirmation bias, and FOMO — remain visible. Online communities and social proof can amplify speculative moves.
Fatigue After the Hype Cycle
After the intense retail trading frenzy of 2020–24, some markets experienced declines in active retail accounts, possibly due to losses, tougher conditions, or burnout.
This suggests that retail participation is sensitive to market stress and profitability, and not immune to drawdowns in engagement.
7. Crypto and Alternative Assets: A Structured Return
Following the bear markets and regulatory ambiguity of earlier years, retail interest in crypto and blockchain-linked assets has returned with more structure and participation in regulated markets:
Improved infrastructure, clearer rules, and institutional endorsement have boosted confidence among retail crypto investors.
Platforms now blend crypto and traditional assets, making allocation decisions easier for diversified portfolios.
Retail involvement in digital finance is no longer a fringe play — it’s part of the mainstream investing toolkit.
8. Globalization of Retail Investing
Geography matters less in 2026:
Investors in India, Latin America, Africa, and Southeast Asia are participating in U.S. and European markets through accessible platforms.
Cross-border flows and digital finance products are creating global retail pools that influence markets beyond local economies.
This globalization expands liquidity but also exposes retail investors to new risks — including currency, geopolitical, and macroeconomic risk — that require sophisticated strategies.
9. The Role of Financial Education and AI Tools
Retention of educated investors often hinges on tools:
AI assistants and automated advisors are reducing informational gaps, making complex portfolio decisions more accessible.
Investors are leveraging analytics, sentiment indicators, and automated risk scoring — previously the domain of professionals.
Education — both formal and platform-driven — is transforming how retail investors think about risk, returns, and diversification.
10. What This Means for Markets and the Road Ahead
The cumulative effect of these changes has reshaped market dynamics:
Retail flows contribute to price discovery and contribute non-negligible capital in major markets.
Retail participation can dampen sell-offs when coordinated but may exacerbate volatility in specific themes.
The “retail investor” is no longer a monolithic trading stereotype but a diverse set of participants with varied goals — long-term wealth building, speculative trading, algorithmic strategies, and alternative asset exposure.
Looking forward into late 2026 and beyond:
Digital platforms will likely continue to innovate with AI and automation.
Regulatory frameworks may evolve to protect novice investors while fostering broader participation.
Retail behavior — because of its scale and connectedness — will remain a core driver of market liquidity and sentiment.
Conclusion
Post-2025, retail investors are not simply more active — they are more informed, more diverse, and more central to modern capital markets. They blend long-term goals with real-time execution, embrace technology and data, and increasingly shape global market flows. However, behavioral biases and cyclical sentiment swings persist, reminding us that retail investing is as much a human endeavor as a technological one.

Part 1 Institutional Option Trading Vs. Technical Analysis Pros and Cons of Trading Options
Pros
Potential upside gains
Losses may be limited to premium paid
Leverage can increase rewards
Risk hedging
Cons
Complex
Difficult to price
Advance investment knowledge
Leverage can multiply potential losses
Potentially unlimited risk when selling options

KIRIINDUS 1 Day Time Frame 📌 Current Price Snapshot
📍 NSE (approx current trading price): ₹496.50 – ₹513.95 range during today’s session.
The stock has been trading near its 1D range low to mid and is well below key moving averages, signaling near‑term weakness.
📊 1‑Day Pivot & Support/Resistance Levels
Pivot Points (Classic/Fibonacci – short‑term traders)
Based on pivot calculations from the previous session:
Pivot (central reference): ~ ₹536.98
Resistance Levels:
R1: ~ ₹545.62
R2: ~ ₹553.53
R3: ~ ₹562.17
Support Levels:
S1: ~ ₹529.07
S2: ~ ₹520.43
S3: ~ ₹512.52
👉 These are the key intraday turning points that many traders use to gauge short‑term bias:
Holding above the pivot (~₹536) is bullish bias intraday.
Dropping below S2/S3 suggests continued weakness for the session.
📉 Alternative Support/Resistance from Other Technical Sources
A slightly wider intraday pivot setup also suggests:
Central Pivot (CPR): ~ ₹520–₹524
Immediate Support: ~ ₹503–₹507
Immediate Resistance: ~ ₹548–₹558
This is useful for scalpers and intraday short‑term strategies.
🎯 How Traders Use These Levels
Bullish scenario
A sustained price move above Pivot (~₹536) → rally toward R1 (₹545–₹550) and R2 (~₹553+).
Bearish scenario
Break and close below S1/S2 (~₹529–₹520) → risk of probing S3 and lower (~₹512 or below).
These levels are widely used by intraday traders to set entry, stop‑loss, and exit targets for the day session.

Part 2 Intraday Master Class 1. Advantages of Options
Small capital can control large exposure
Multiple strategies for any market condition
Limited risk for buyers
Hedging capabilities
Income generation for sellers
2. Disadvantages of Options
Time decay kills buyers
Volatility can cause unpredictable movements
Unlimited loss for unhedged sellers
Complex to understand initially
Liquidity issues in some stocks

Fastest-growing sectors in 2026: Renewables, EV, Tech, Infra1. Renewables: Powering the Energy Transition
Global Growth & Investment
Renewable energy — including solar, wind, hydro, bioenergy, and emerging technologies such as green hydrogen and energy storage — is one of the fastest-growing sectors worldwide. Governments, investors, and corporations are pouring capital into clean energy to decarbonize economies, meet climate targets, and reduce reliance on fossil fuels. According to international forecasts, renewables are projected to increase their share of global energy consumption significantly by 2030, with renewable electricity expanding rapidly in the industry, transport, and buildings sectors.
Key Drivers
Climate Commitments & Policy Incentives – Governments across Europe, Asia, and the Americas are implementing policies that subsidize renewable projects, penalize carbon emissions, and set net-zero targets. For example, India’s push for 500 GW of renewable capacity by 2030 is driving solar and wind expansion alongside storage solutions.
Cost Reductions – Technological improvements have dramatically lowered the cost of solar panels and wind turbines, making renewables competitive with conventional energy.
Integration with Storage & Smart Grids – Growth in advanced energy storage technologies (including battery systems) and smart grid integration is solving the intermittency problem — a major historical barrier to renewables.
Emerging Trends
Solar innovation — new technologies like perovskite solar cells and floating solar farms are expanding opportunities.
Offshore wind growth — deeper water installations and floating turbines are enabling significant offshore capacity.
Green hydrogen scaling — as electrolyzer costs fall, hydrogen is gaining traction for heavy industry decarbonization.
Corporate demand — companies are committing to renewable power as part of ESG and net-zero strategies.
Economic Impact
Renewables are a major job creator and investment destination. For example, installation, manufacturing, and maintenance roles in solar and wind are among the fastest-growing occupations globally. With investments exceeding traditional fossil fuel project financing in some markets, renewables are reshaping how energy systems are built and financed.
2. Electric Vehicles (EVs): Redefining Transportation
Market Expansion
The electric mobility market continues its rapid global expansion. Electric vehicle sales — including passenger cars, trucks, buses, and two-wheelers — are accelerating due to stronger emissions regulations, consumer demand, and falling battery costs. One estimate suggests the global EV fleet could reach roughly 116 million vehicles in 2026, up about 30 % from the previous year.
Growth Drivers
Emissions Regulations – Many regions are phasing out internal combustion engine vehicles, pushing manufacturers and consumers toward EVs.
Battery Technology & Cost Declines – As battery performance improves and prices drop, EVs become more affordable and attractive to a broader consumer base.
Charging Infrastructure Expansion – Investment in EV charging networks — including fast chargers and grid-connected systems — is enabling longer trips and better usability.
Integration with Renewables
A key growth area is the integration of EVs with renewable energy systems. Solar-powered charging points and vehicle-to-grid (V2G) technologies help EVs not only use clean energy but also stabilize the grid by providing stored electricity when needed.
Sector Challenges & Opportunities
Charging infrastructure gap — expansion still needs to catch up with adoption.
Battery recycling and sustainability — as EV deployment scales, end-of-life battery recycling will become vital.
Despite challenges, EVs are a centerpiece of electrified transport and decarbonization strategies globally, with significant implications for energy demand patterns, oil markets, and automotive industry structures.
3. Technology: The Digital Acceleration
Redefining Industries
Technology — particularly artificial intelligence (AI), cloud computing, cybersecurity, data centers, and digital services — is expanding rapidly as organizations across sectors invest heavily in digital transformation.
AI & Machine Learning
AI is no longer just a tool — it’s becoming a core infrastructure component for enterprise and industrial systems. From autonomous energy grid management to predictive maintenance and business analytics, AI adoption is growing fast. AI systems are optimizing energy distribution, managing EV charging demand, and enhancing industrial productivity.
Cloud & Data Centers
Cloud computing and data center infrastructure remain vital as demand for digital services — including streaming, remote work, big data, and AI training — grows. Forecasts indicate that cloud infrastructure revenue will exceed hundreds of billions of dollars in 2026, with data centers expanding capacity globally.
Cybersecurity & Digital Services
With digital expansion comes higher cybersecurity needs. Investments in digital defenses, secure cloud platforms, and compliance solutions are booming as businesses safeguard data and ensure continuity.
Emerging Tech Sub-sectors
Edge computing — for low-latency processing in IoT and industrial use cases.
Generative AI and automation tools — reshaping workflows across industries.
Quantum computing and next-gen semiconductors — these are nascent yet rapidly emerging areas.
The tech sector’s evolution is foundational to every other growth theme — from enabling smart energy grids to powering autonomous vehicles and delivering digital public services.
4. Infrastructure: Building the Backbone of Growth
Why Infrastructure Matters
Infrastructure — including energy systems, transport networks, digital networks, and urban development — is central to sustained economic growth. By 2026, infrastructure investment is one of the fastest-growing areas because it supports all the other sectors (renewables, EVs, tech).
Key Infrastructure Drivers
Energy Systems Modernization – To support renewable energy growth and EV charging, grid modernization and energy storage infrastructure are critical. Projects include upgraded transmission lines, substation automation, and decentralized power networks.
Transport & Mobility Networks – Beyond EV adoption, there’s demand for integrated transport infrastructure including smart highways, electrified public transit, and urban mobility solutions.
Digital Infrastructure Expansion – With cloud services and digital adoption rising, infrastructure for broadband, fiber optic networks, 5G/6G, and data centers is expanding rapidly.
Sector Trends
Clean Energy Infrastructure — integrating renewables, storage and EV charging to support resilient and sustainable grids.
Smart Cities & Urban Systems — digital and sensor networks to optimize traffic, utilities, and public services.
Public-Private Partnerships (PPPs) — governments are increasingly partnering with private investors to finance large infrastructure projects.
Economic Impact
Infrastructure spending stimulates economic activity through job creation, supply chain demand, and enhanced productivity. Upgrading infrastructure is directly linked to long-term competitiveness, economic resilience, and quality of life improvements.
How These Sectors Interact
These four sectors — Renewables, EVs, Technology, and Infrastructure — are deeply interconnected:
Renewables and EVs both depend on grid upgrades, storage systems, and digital control systems.
Technology (especially AI, cloud, and digital services) enables smarter energy grids, efficient logistics, and responsive urban systems.
Infrastructure investment is the foundation that makes large-scale transitions feasible — from renewable generation to electrified mobility and digital economies.
This synergy creates a multiplier effect for economic growth: advancements in one sector accelerate progress in the others, leading to broader innovation and productivity gains.
What This Means for 2026 and Beyond
Investment Opportunities – These sectors are attracting capital from sovereign wealth funds, institutional investors, and venture capital, reflecting confidence in long-term growth.
Jobs & Skills Transformation – Employment will rise in clean energy, software engineering, EV manufacturing, AI development, infrastructure planning, and data management.
Policy Focus – Governments are enacting supportive regulations, subsidies, and targets to accelerate adoption and market formation.
Global Competitiveness – Countries leading in these sectors stand to benefit from economic growth, technological leadership, and improved energy security — shaping the next era of global economic power.
Conclusion
In 2026, the expansion of renewables, electric vehicles, technology, and infrastructure is not just a trend — it’s a structural shift in the global economy. Driven by sustainability goals, technological advancement, and changing consumer and business behaviors, these sectors offer significant opportunities for growth, investment, employment, and innovation.
Together, they represent the backbone of a future-ready economy — one that is cleaner, more connected, and more resilient.
Part 1 Technical Analysis VS. Institutional Trading Common Mistakes Traders Make
Buying OTM options expecting miracles
No stop-loss on option selling
Trading without understanding volatility
Getting trapped during reversal
Overtrading
Trading during low liquidity
Holding positions during events without hedges

Part 2 Technical Analysis VS. Institutional Trading Option Expiry Dynamics
On expiry day:
Theta decay is fastest.
Premium collapses quickly.
OTM options lose value rapidly.
Scalping becomes intense.
Liquidity is high.
Many traders prefer weekly expiry trading for quick momentum.

Part 3 Technical Analysis VS. Institutional Trading Hedging Using Options
Hedging protects your capital.
Example:
You hold ₹10 lakh worth of Nifty stocks.
You can buy PE options to protect your portfolio from a fall.
This is why options were originally created—not for speculation, but for risk management.

Part 2 Candle Stick Patterns Strategies in Options Trading
Investors have a wide range of option trading methods at their disposal. Here are the most often-used option trading methods:
Covered Call Technique
In this somewhat cautious strategy, an investor purchases a stock and afterwards sells the call option for a profit. The investor can keep the additional gains if the share price increases.
Bull Spread
The bull call spread approach entails the purchase and sale of call options with various strike prices. The investor might potentially profit from the difference between the two options by purchasing the one with a lower strike price for a cheaper price.
Long Put Approach
The investor purchases a put option. The investor can earn from the difference in the prices of stocks at the time of buying and selling the options contract. Even if the stock price declines, the options holder has the right to sell the asset at the price prevailing at the time of purchase.
Iron Condor Approach
This sophisticated strategy entails the simultaneous purchase and sale of both put and call options having various strike prices by the investor. The investor can earn when the stock price remains inside the band of the strike price. Learn more about the PCR ratio and how it can help you trade stocks at Share India.

Part 1 Candle Sticck Patterns Types of Options
There are basically two types of options; Call and Put.
Call: Call options give the buyer the right to buy an asset at a specific price on a fixed date.
Put: Put options give the buyer the right to sell an asset at a predetermined price. Similar to call options, Put options also have a certain expiration date.
To buy both calls and puts, the investors must pay a fee called the premium to the option seller.

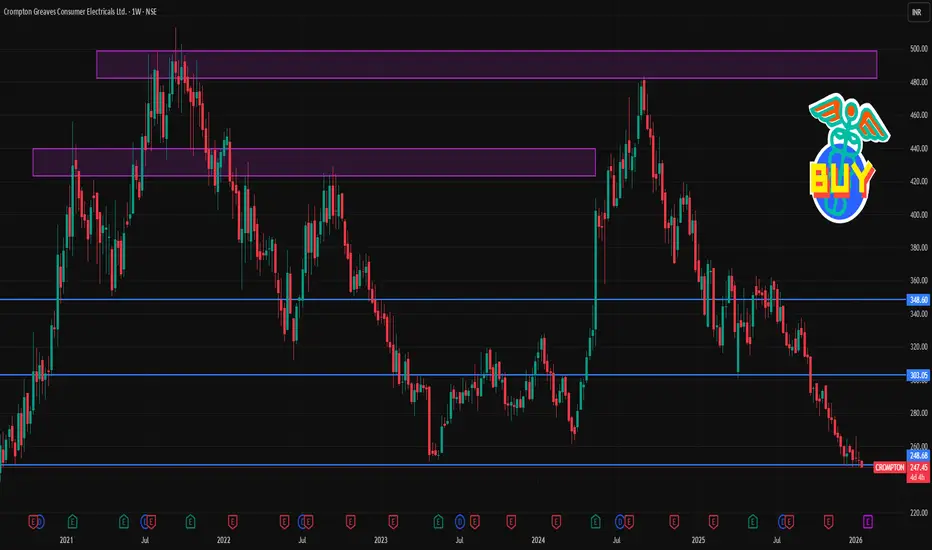
CROMPTON 1 Week Timw Frame 📊 Current Price Snapshot (Recent Close)
📌 Last traded price: ~₹251–₹255 range (as per latest market data).
📈 Key 1‑Week Technical Levels (Support & Resistance)
🔻 Support Levels — Where Buyers May Step In
Immediate support: ~₹248–₹252 (current level area)
Secondary support: ~₹245–₹247 (short‑term downside buffer)
Lower support: ~₹241–₹242 (deeper short‑term demand zone)
➡️ If price stays above ~₹248, short‑term weakness may stabilize.
🔺 Resistance Levels — Where Selling Might Appear
R1 (first resistance): ~₹255–₹256 (near immediate intraday hurdle)
R2 (next resistance): ~₹259–₹260 (near short‑term pivot barrier)
R3 (higher resistance): ~₹262–₹263 (short‑term rally target on strength)
➡️ A breakout above ~₹259–₹260 with volume could signal a short‑term bounce.
📅 1‑Week Scenario Outlook
➡️ Bearish scenario (higher probability given current momentum):
Price remains below ₹259–₹260 resistance → likely to trade lower toward ₹245 and possibly at ₹241–₹242 zone.
➡️ Bullish reversal setup (requires catalyst):
Price breaks and sustains above ₹259–₹260 with decent volume → could see rally toward ₹262+ within week.
⚠️ Important Notes
This is a technical perspective only (not investment advice).
Price movements can change rapidly with market news, volumes, and macro catalysts.
Use stop‑loss and risk management if planning any trades.
HAL 1 Week Time Frame 📌 Current Approximate Price
HAL’s latest price is around ₹4,440 – ₹4,480 on NSE (varies with live market moves).
📊 Weekly Technical Levels (1‑Week View)
📈 Resistance Levels (Upside)
These are levels where price may struggle to break above on the weekly timeframe:
R1 (Immediate): ~₹4,500 – ₹4,550 — first resistance zone.
R2 (Medium): ~₹4,540 – ₹4,580 — next resistance cluster.
R3 (Bullish / extended): ~₹4,580 – ₹4,670 — higher resistance if buyers take control.
Key breakout barrier to watch: sustaining above ₹4,580–₹4,600 may strengthen bullish bias for the week.
📉 Support Levels (Downside)
These are levels where price may find buying interest if it declines:
S1 (Immediate): ~₹4,420 – ₹4,380 — first support for this week.
S2 (Secondary): ~₹4,380 – ₹4,340 — deeper support if sellers push lower.
S3 (Lower): ~₹4,340 – ₹4,300 — key demand zone historically.
Key downside pivot: break below ~₹4,380 could extend selling into the ₹4,300 area.
📐 Weekly Pivot Reference
Pivot Point: ~₹4,460 – ₹4,470 — midpoint reference level for direction bias.
Above this pivot → bullish bias
Below this pivot → bearish/neutral bias
📝 Summary Weekly Levels Table
Level Price Zone
🟥 R3 ~₹4,580 – ₹4,670
🟧 R2 ~₹4,540 – ₹4,580
🟨 R1 ~₹4,500 – ₹4,550
⚪ Pivot ~₹4,460 – ₹4,470
🟦 S1 ~₹4,420 – ₹4,380
🟩 S2 ~₹4,380 – ₹4,340
🟪 S3 ~₹4,340 – ₹4,300

Earnings Season Trading: Opportunities, Risks, and StrategiesWhat Is Earnings Season and Why It Matters
Earnings season typically occurs four times a year, following the end of each financial quarter. In India, major earnings seasons usually unfold in April, July, October, and January. During this period, companies announce their financial performance, including earnings per share (EPS), revenue, margins, debt levels, and management commentary. Markets react not only to whether results are good or bad, but also to how they compare with expectations already priced into the stock.
Stock prices are forward-looking. This means a company can report strong earnings and still see its share price fall if results fail to meet market expectations. Conversely, a company with weak numbers may rally if the outcome is “less bad” than anticipated or if guidance improves. This expectation-versus-reality dynamic makes earnings season particularly powerful for short-term traders.
Volatility: The Core Feature of Earnings Trading
The defining characteristic of earnings season trading is volatility. Stocks often experience sharp price gaps on the day results are announced, especially if the earnings surprise is significant. These gaps can occur upward or downward and may range from a few percent to double-digit moves in extreme cases. For intraday traders, this volatility creates momentum-based opportunities, while swing traders look to capture post-earnings trends that may last days or weeks.
However, volatility cuts both ways. Sudden adverse moves can trigger stop-losses or cause significant losses if risk is not controlled. Therefore, earnings trading demands disciplined position sizing, predefined exit strategies, and an understanding that outcomes can be unpredictable.
Earnings Expectations and Market Psychology
A critical element of earnings season trading is market psychology. Analysts issue earnings estimates well in advance, and these numbers shape investor expectations. Traders closely monitor consensus EPS, revenue forecasts, and “whisper numbers” circulating in the market. The stock’s price movement before earnings often reflects these expectations, with rallies signaling optimism and declines indicating caution.
During earnings season, traders focus on three major aspects: actual results, comparison with estimates, and management guidance. Among these, guidance often has the strongest influence because it affects future valuations. A company beating estimates but lowering future guidance may still face selling pressure, while a modest miss combined with strong forward outlook can trigger buying interest.
Common Earnings Season Trading Strategies
Several strategies are commonly used during earnings season. One approach is pre-earnings momentum trading, where traders ride the price trend leading up to the results, exiting positions before the announcement to avoid uncertainty. This strategy benefits from speculation and anticipation but avoids overnight risk.
Another method is post-earnings reaction trading, where traders wait for results and then trade based on the market’s reaction. This reduces uncertainty and allows traders to align with confirmed momentum, though the initial move may already be partially priced in.
Derivative traders often use options-based strategies such as straddles, strangles, or spreads to benefit from volatility rather than direction. These strategies aim to profit from large price swings regardless of whether the stock moves up or down, but they require a solid understanding of implied volatility and option pricing.
Sector and Index-Level Impact
Earnings season does not affect all stocks equally. Heavyweight companies in sectors like banking, IT, FMCG, and metals can significantly influence broader indices such as the Nifty 50 or Sensex. Strong results from large banks or IT firms can lift the entire market, while disappointments can drag indices lower even if other stocks perform well.
Traders often analyze sector-wide earnings trends to identify leadership or weakness. For example, if multiple companies in a sector report margin expansion and strong demand, traders may adopt bullish positions across that sector. Conversely, widespread earnings downgrades may signal structural issues, prompting defensive or short-selling strategies.
Risk Management During Earnings Season
Risk management is especially important during earnings season trading. Price gaps can bypass stop-loss orders, leading to slippage. To manage this, traders often reduce position sizes, avoid holding leveraged positions overnight, or hedge exposure using options. Clear risk-reward ratios and strict discipline help protect capital during unpredictable market reactions.
Another important practice is avoiding overtrading. The abundance of opportunities during earnings season can tempt traders to take excessive positions. Successful traders focus on high-quality setups rather than chasing every earnings announcement.
Long-Term Perspective vs Short-Term Trading
While earnings season is popular among short-term traders, long-term investors also use this period to reassess portfolio holdings. Consistent earnings growth, improving margins, and strong guidance reinforce long-term investment theses. For traders, understanding this long-term context helps interpret short-term price movements more accurately.
A stock that corrects sharply after earnings may offer opportunities if the long-term fundamentals remain intact. Conversely, a sharp rally driven purely by short-term enthusiasm may fade if earnings quality is weak.
Conclusion
Earnings season trading is a powerful but demanding aspect of the stock market. It offers unique opportunities driven by volatility, expectations, and market psychology, but it also carries heightened risks. Successful earnings traders combine fundamental understanding with technical analysis, focus on expectations rather than headlines, and practice strict risk management. Whether trading stocks, indices, or derivatives, mastering earnings season dynamics can significantly enhance a trader’s ability to navigate markets with confidence and discipline.

Quantitative Trading The Science of Data-Driven Financial MarketCore Concept of Quantitative Trading
At its core, quantitative trading is built on the belief that market behavior follows identifiable patterns that can be measured, modeled, and exploited. Quant traders collect vast amounts of historical and real-time market data—such as price movements, volume, volatility, interest rates, and macroeconomic indicators—and apply mathematical techniques to uncover statistically significant relationships. These insights are then converted into precise trading rules that computers can execute automatically.
The goal is not to predict markets with certainty, but to gain a probabilistic edge. Even a small statistical advantage, when applied consistently across many trades, can lead to meaningful long-term profitability.
Key Components of Quantitative Trading
Quantitative trading systems typically consist of several interlinked components. First is data acquisition, where clean, high-quality data is gathered from exchanges, economic reports, and alternative sources such as satellite data or social media sentiment. Second is model development, where traders use mathematics, statistics, and machine learning to design strategies. These models may focus on trends, mean reversion, arbitrage, or volatility patterns.
Next comes backtesting, a critical step in which strategies are tested against historical data to evaluate performance, risk, and robustness. Finally, execution and risk management ensure that trades are placed efficiently while controlling losses through position sizing, stop-loss rules, and portfolio diversification.
Common Quantitative Trading Strategies
Several well-known strategies form the foundation of quantitative trading. Trend-following strategies aim to capture sustained market movements by identifying upward or downward momentum. Mean reversion strategies assume that prices tend to return to their historical averages after extreme movements. Statistical arbitrage seeks to exploit temporary price discrepancies between related securities, often across stocks, futures, or ETFs.
Another important category is high-frequency trading (HFT), which uses ultra-fast algorithms to execute large numbers of trades within milliseconds, profiting from small price inefficiencies. Factor-based investing, commonly used by hedge funds and asset managers, ranks securities based on factors such as value, momentum, quality, and low volatility.
Role of Technology and Algorithms
Technology is the backbone of quantitative trading. Powerful computers process massive datasets, while programming languages such as Python, R, and C++ are used to build and deploy models. Machine learning and artificial intelligence have further expanded the scope of quant trading by enabling systems to adapt, learn from new data, and improve performance over time.
Algorithmic execution minimizes transaction costs by intelligently splitting large orders and timing trades to reduce market impact. As markets become more competitive, speed, efficiency, and technological sophistication often determine success.
Risk Management in Quantitative Trading
Risk management is just as important as strategy design. Quantitative traders focus on controlling downside risk through diversification, volatility targeting, and strict drawdown limits. Since quant strategies often rely on historical relationships, unexpected market events—such as financial crises or geopolitical shocks—can cause models to fail. Robust risk frameworks help mitigate these risks by limiting exposure and adapting to changing market conditions.
Stress testing and scenario analysis are widely used to evaluate how strategies might perform under extreme conditions. This disciplined approach helps protect capital and ensures long-term sustainability.
Advantages of Quantitative Trading
One of the biggest advantages of quantitative trading is objectivity. Decisions are based on data and rules rather than emotions like fear or greed. Quant strategies are also scalable, allowing traders to manage large portfolios across multiple markets simultaneously. Automation improves consistency, ensuring that strategies are executed exactly as designed without human error.
Additionally, quantitative trading can uncover opportunities that are invisible to the human eye, especially in complex, fast-moving markets where manual analysis is impractical.
Challenges and Limitations
Despite its strengths, quantitative trading is not without challenges. Developing reliable models requires deep expertise in mathematics, programming, and financial theory. Data quality issues, overfitting, and changing market dynamics can reduce effectiveness. As more participants adopt similar strategies, competition increases and profit margins shrink.
Regulatory constraints, technological costs, and the risk of model breakdowns during extreme events also pose significant hurdles. Successful quant traders must continuously research, refine, and adapt their models.
Future of Quantitative Trading
The future of quantitative trading is closely tied to advancements in artificial intelligence, big data, and cloud computing. Alternative data sources, such as satellite imagery and real-time consumer behavior, are expanding the analytical toolkit of quant traders. As markets evolve, quantitative trading is expected to become even more sophisticated, integrating human insight with machine intelligence.
Conclusion
Quantitative trading represents the fusion of finance, mathematics, and technology. By transforming market data into systematic strategies, it offers a disciplined and scalable approach to trading. While it requires significant expertise and resources, quantitative trading continues to shape modern financial markets, redefining how trades are analyzed, executed, and managed in an increasingly data-driven world.

Understanding Ownership, Value, and Investment in Stock MarketWhat Are Shares?
A share is a unit of ownership in a company. When a company needs capital to start, expand, or modernize its operations, it may choose to raise funds by issuing shares to the public or to private investors. Each share represents a small portion of the company’s ownership. Shareholders, therefore, become part-owners of the business.
For example, if a company issues one million shares and an investor owns ten thousand of them, that investor owns one percent of the company. Ownership through shares can entitle investors to certain rights, such as voting on major company decisions and receiving a portion of the company’s profits.
Why Companies Issue Shares
Companies issue shares primarily to raise capital without taking on debt. Unlike loans, the money raised through shares does not need to be repaid. Instead, shareholders share in the risks and rewards of the business. This capital can be used for various purposes such as launching new products, expanding into new markets, upgrading technology, or paying off existing liabilities.
Issuing shares also helps companies improve their credibility and visibility, especially when they are listed on a stock exchange. Publicly listed companies are often perceived as more transparent and reliable due to regulatory requirements and regular disclosures.
Types of Shares
Shares can be broadly classified into two main types: equity shares and preference shares.
Equity shares are the most common form of shares. Equity shareholders are the true owners of the company and have voting rights. They benefit from capital appreciation when the company grows and may receive dividends when profits are distributed. However, equity shareholders are last in line to receive assets if the company is liquidated, making these shares riskier.
Preference shares offer preferential treatment in terms of dividend payments and capital repayment during liquidation. Preference shareholders usually receive a fixed dividend, regardless of the company’s profitability, but they generally do not have voting rights. These shares are considered less risky than equity shares but offer limited growth potential.
How Share Prices Are Determined
The price of a share is determined by supply and demand in the stock market. When more investors want to buy a share than sell it, the price rises. Conversely, when more investors want to sell than buy, the price falls. Several factors influence this demand and supply dynamic, including company performance, earnings reports, industry trends, economic conditions, interest rates, and investor sentiment.
Fundamental factors such as revenue growth, profitability, management quality, and future prospects play a crucial role in determining a company’s intrinsic value. Technical factors, such as market trends and trading volumes, also influence short-term price movements.
Benefits of Investing in Shares
Investing in shares offers several advantages. One of the most important benefits is the potential for high returns over the long term. Historically, equities have outperformed many other asset classes such as fixed deposits and bonds, especially when investments are held for extended periods.
Shares also provide an opportunity to earn dividends, which can serve as a regular income stream. Additionally, investing in shares helps protect wealth against inflation, as growing companies tend to increase their revenues and profits over time, which is reflected in rising share prices.
Another key benefit is liquidity. Shares listed on stock exchanges can be easily bought and sold, allowing investors to convert their investments into cash relatively quickly.
Risks Associated with Shares
While shares offer attractive returns, they also come with risks. Market risk is the most common, where share prices fluctuate due to economic changes, political events, or global developments. Company-specific risks, such as poor management decisions, increased competition, or regulatory issues, can also negatively impact share prices.
Volatility is another risk, particularly in the short term. Share prices can rise or fall sharply, which may be unsettling for new investors. In extreme cases, if a company goes bankrupt, shareholders may lose their entire investment.
Role of Shares in Wealth Creation
Shares play a vital role in long-term wealth creation. By investing in fundamentally strong companies and holding shares over time, investors can benefit from compounding returns. Reinvesting dividends further enhances wealth accumulation.
Shares also contribute to economic growth by channeling savings into productive investments. The capital raised through shares enables companies to innovate, create jobs, and expand operations, which in turn supports overall economic development.
Shares and the Stock Market
The stock market acts as a platform where shares are issued, bought, and sold. Primary markets allow companies to issue new shares through initial public offerings (IPOs), while secondary markets enable investors to trade existing shares. Stock exchanges ensure transparency, liquidity, and fair pricing through regulated trading mechanisms.
Conclusion
Shares represent a powerful financial instrument that connects investors with businesses and economic growth. They offer ownership, the potential for high returns, and participation in a company’s success, while also carrying risks that require careful evaluation. Understanding shares—how they are issued, priced, and traded—helps investors make informed decisions and build long-term wealth. For anyone aiming to grow their financial knowledge or investment portfolio, shares remain a cornerstone of modern finance and an essential component of the global economic system.

Algorithmic AI Trading Strategies: Transforming Modern Markets1. Meaning of Algorithmic AI Trading
Algorithmic AI trading refers to the use of computer programs powered by AI to execute trades based on predefined rules and adaptive learning models.
Unlike traditional algorithmic trading, AI-based systems can learn from historical and real-time data, improving decisions over time.
These strategies reduce emotional bias and enable data-driven decision-making.
2. Core Components of AI Trading Strategies
Data Collection: Market prices, volume, order book data, news, social media sentiment, and macroeconomic indicators.
Data Processing: Cleaning, normalization, and feature extraction for accurate analysis.
AI Models: Machine learning, deep learning, reinforcement learning, and neural networks.
Execution Engine: Automatically places, modifies, and exits trades at optimal prices.
Risk Management Module: Controls exposure, position sizing, and drawdowns.
3. Types of Algorithmic AI Trading Strategies
Trend-Following Strategies:
AI identifies price momentum and trends using historical patterns.
Trades are placed in the direction of the prevailing trend.
Mean Reversion Strategies:
AI assumes prices revert to historical averages.
Trades are triggered when prices deviate significantly from the mean.
Arbitrage Strategies:
AI detects price inefficiencies across markets or instruments.
Executes simultaneous buy and sell orders to lock risk-free or low-risk profits.
Market-Making Strategies:
AI places buy and sell orders continuously to capture bid-ask spreads.
Requires ultra-low latency and precise risk control.
Sentiment-Based Strategies:
AI analyzes news, earnings reports, and social media sentiment.
Trades are aligned with positive or negative market sentiment signals.
4. Role of Machine Learning in Trading
Supervised Learning:
Uses labeled data to predict price direction or volatility.
Unsupervised Learning:
Identifies hidden patterns, clusters, and market regimes.
Reinforcement Learning:
AI learns by trial and error, optimizing strategies through rewards and penalties.
Deep Learning:
Neural networks analyze complex, non-linear relationships in market data.
5. Strategy Development Process
Idea Generation: Identifying inefficiencies or repeatable patterns.
Backtesting: Testing strategies on historical data to evaluate performance.
Optimization: Fine-tuning parameters to improve risk-adjusted returns.
Paper Trading: Simulating trades in real-time without real money.
Live Deployment: Executing strategies in real market conditions.
6. Risk Management in AI Trading
Position Sizing: Limits capital allocation per trade.
Stop-Loss Mechanisms: Automatically exit losing trades.
Diversification: Trading across multiple assets and strategies.
Drawdown Control: Prevents excessive losses during adverse market phases.
Model Risk Monitoring: Detects when AI models stop performing effectively.
7. Advantages of Algorithmic AI Trading
Speed and Efficiency: Executes trades in milliseconds.
Emotion-Free Trading: Eliminates fear, greed, and hesitation.
Scalability: Can trade multiple markets simultaneously.
Consistency: Follows rules strictly without deviation.
Data Utilization: Analyzes vast datasets beyond human capability.
8. Limitations and Challenges
Overfitting Risk: Models may perform well historically but fail in live markets.
Data Quality Issues: Poor data can lead to inaccurate signals.
Market Regime Changes: AI models may struggle during unexpected events.
High Infrastructure Costs: Requires powerful hardware and low-latency systems.
Regulatory Constraints: Compliance with market regulations is essential.
9. Ethical and Regulatory Considerations
Market Fairness: High-frequency AI trading can disadvantage retail traders.
Transparency: Black-box AI models are difficult to interpret.
Risk of Flash Crashes: Rapid automated trading can amplify volatility.
Regulatory Oversight: Authorities monitor algorithmic trading to prevent manipulation.
10. Role of AI Trading in Retail vs Institutional Markets
Institutional Traders:
Use advanced AI systems with large datasets and capital.
Focus on high-frequency and statistical arbitrage strategies.
Retail Traders:
Use simplified AI tools, bots, and platforms.
Emphasize swing trading, trend-following, and signal-based automation.
11. Integration with Other Technologies
Cloud Computing: Enables scalable data processing and storage.
Big Data Analytics: Enhances pattern recognition and forecasting.
Blockchain Integration: Improves transparency and settlement efficiency.
APIs and Trading Platforms: Allow seamless execution and monitoring.
12. Future of Algorithmic AI Trading
AI systems will become more adaptive and self-learning.
Greater use of alternative data such as satellite images and web traffic.
Improved explainable AI models for better transparency.
Increased regulatory frameworks to ensure market stability.
Wider adoption among retail traders through user-friendly platforms.
13. Conclusion
Algorithmic AI trading strategies represent a major evolution in financial markets.
They enhance efficiency, accuracy, and scalability of trading operations.
Despite challenges, proper risk management and ethical practices can make AI trading sustainable.
As technology advances, AI-driven strategies will continue to redefine how markets operate and how traders participate globally.

Part 11 Trading Master Class Withh Experts Understanding Options
An option is a financial derivative that gives the holder the right, but not the obligation, to buy or sell an underlying asset at a specified price on or before a certain date. The underlying asset could be stocks, indices, commodities, currencies, or ETFs.
Options trading has grown significantly due to the ability to generate profits in bullish, bearish, and sideways markets. It provides a combination of flexibility, leverage, and strategic possibilities that traditional trading cannot offer.
The two primary participants in options trading are:
Option Buyer (Holder): Pays a premium to acquire the right to exercise the option.
Option Seller (Writer): Receives the premium and is obligated to fulfill the contract if the buyer exercises the option.

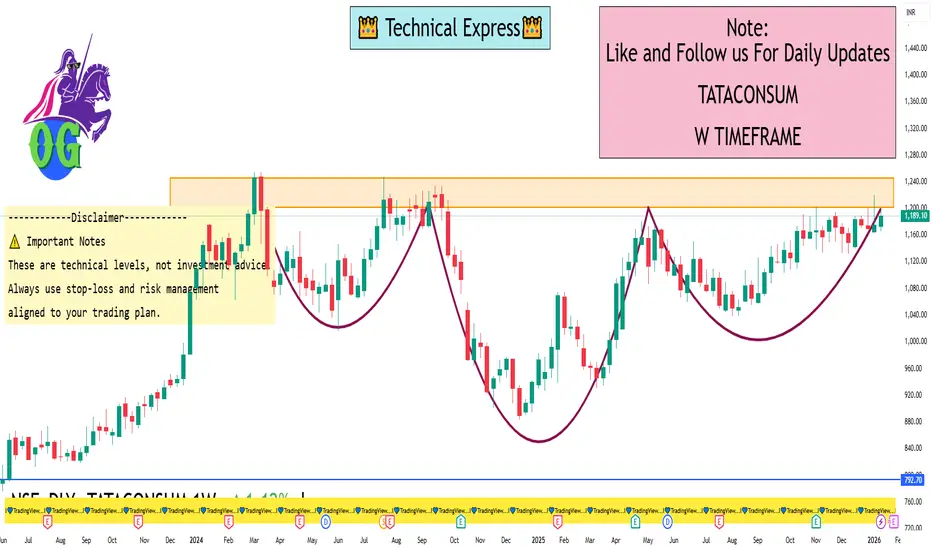
TATACONSUM 1 Week View 📊 Weekly Support & Resistance – Current Levels
Resistance Levels (Upside Targets)
R1: ~₹1,182 – first weekly resistance zone.
R2: ~₹1,200 – medium resistance.
R3: ~₹1,212–₹1,218 – higher resistance cluster.
Major weekly zone: ~₹1,243–₹1,265 – extended upside possible if breakout happens.
Support Levels (Downside Levels)
S1: ~₹1,152–₹1,153 – primary weekly support.
S2: ~₹1,131 – next support zone.
S3: ~₹1,097 – deeper support if S2 breaks.
Lower supports: ~₹1,136–₹1,151 cluster from other pivots.
📌 Weekly Pivot Reference (Live-ish)
Current price is around ₹1,185–₹1,190 region, indicating the balance zone for the week.
📈 How to Use These Levels This Week
Bullish Scenario
A sustained move above ₹1,200 → could accelerate toward ₹1,212–₹1,218 and then ₹1,243+.
Hold above ₹1,182 keeps near-term upside intact.
Bearish Scenario
A break below ₹1,152 → could see correction down to ₹1,131 & ₹1,097.
Weekly close below ₹1,131 may signal deeper selling.
Neutral/Range
If price stays between ₹1,152–₹1,200 → we could see consolidation before a breakout direction.
🧠 Additional Current Indicators (Context)
RSI & SMA readings on daily suggest neutral to mixed momentum, not extreme overbought/oversold.
Moving averages around 1,180–1,171 zones give overlapping support confluence.
⚠️ Important Notes
These are technical levels, not investment advice.
Weekly levels are based on recent technical support/resistance analysis — actual prices may vary intra-session.
Always use stop-loss and risk management aligned to your trading plan.