IPO & SME IPO Analysis1. What Is an IPO?
An Initial Public Offering (IPO) is when a private company offers its shares to the public for the first time and becomes listed on stock exchanges such as NSE or BSE. This allows the company to:
Raise capital for expansion, debt repayment, or acquisitions
Increase brand value and credibility
Provide exit opportunities to early investors
For investors, IPOs offer:
A chance to invest early in a growing company
Potential for listing gains
Long-term wealth creation if fundamentals are strong
2. What Is an SME IPO?
An SME IPO is similar to a mainboard IPO but is designed for Small and Medium Enterprises. These companies are listed on SME platforms such as:
NSE Emerge
BSE SME
Characteristics of SME IPOs:
Smaller issue sizes (₹10–₹50 crore usually)
Higher risk but higher return potential
Mandatory market making for liquidity
Allotment in lots of minimum ₹1–2 lakh
SME IPOs have recently become extremely popular because many have delivered 100%–500% listing gains and strong long-term returns.
3. Types of IPO Issues
Understanding issue structure is essential before analyzing an IPO.
a) Fresh Issue
New shares created and sold
Money goes to the company
Used for expansion, debt reduction, capex
b) Offer for Sale (OFS)
Existing shareholders sell their stake
Money goes to them, not the company
High OFS sometimes indicates partial exit by promoters
c) Book Building Issue
Price band system
Final price based on investor demand
d) Fixed Price Issue
A single fixed price (mostly seen in SME IPOs)
4. Why IPO Analysis Is Important
Not all IPOs are profitable. Some get oversubscribed due to hype but fail to perform after listing. Others may not show massive listing gains but turn into multi-year wealth creators.
A thorough IPO analysis helps investors:
Identify strong businesses
Avoid overpriced or weak companies
Distinguish hype from genuine opportunity
Decide whether to apply for listing gains or long-term holding
5. Steps for IPO Analysis
Below are the core analytical steps used by professional investors and research analysts:
A) Company Background & Business Model
Start by analysing the company’s:
Industry
Products/services
Market share
Competitive advantage (moat)
Business scalability
Questions to ask:
Is the business model sustainable and future-ready?
Does the company operate in a growing industry?
Is the company fundamentally different from its competitors?
Example: A technology-focused or renewable-energy IPO generally finds more interest than a slow-growth traditional industry.
B) Financial Performance (3–5 Years)
Investors must review:
Revenue growth
Profit growth
EBITDA margins
Net Profit Margin (NPM)
Debt-to-Equity (D/E) ratio
Return on Equity (ROE)
Return on Capital Employed (ROCE)
Key principles:
Consistent growth = strong fundamentals
High ROE/ROCE = efficient company
Low debt = safer investment
Improving margins = healthy profitability
For SME IPOs, avoid companies with unstable financials or sudden one-year spikes (possible window dressing).
C) Valuation Analysis
Valuation shows whether the IPO is priced reasonably.
Metrics:
P/E Ratio compared to peers
P/B Ratio
EV/EBITDA
Market Cap-to-Sales Ratio
Sector Valuation Benchmarks
Red flag:
If valuation is too high compared to sector leaders, the stock may correct after listing.
D) Promoter & Management Quality
Strong leadership drives long-term performance.
Check:
Promoter background
Experience in the industry
Corporate governance track record
Litigation or fraud cases
Promoter shareholding after IPO
High promoter holding after IPO indicates strong confidence in the business.
E) Use of IPO Funds
Understand why the company needs capital.
Common uses:
Expansion or capacity building
Debt repayment
Acquisitions
Working capital
General corporate purposes
Prefer IPOs focused on growth and expansion rather than repaying old debt or giving exits to existing investors.
F) Peer Comparison
Compare the company with listed peers in terms of:
Market Share
Margins
Valuations
Growth Rate
Debt levels
This reveals whether the IPO is reasonably priced or overpriced.
G) Risk Factors
Every IPO has potential risks mentioned in the RHP/DRHP.
Typical risks include:
Dependence on a few clients
Regulatory issues
High debt
Competitive industry
Raw material price volatility
SME IPOs may also face:
Low liquidity
Limited track record
Smaller management teams
H) Grey Market Premium (GMP) & Subscription Data
GMP is an unofficial indicator of listing expectations.
Subscription data (QIB, HNI, Retail) shows demand.
Interpretation:
High QIB subscription = strong institutional confidence
High HNI subscription = aggressive listing expectation
Rising GMP = strong sentiment, but not always reliable
I) Post-Listing Strategy
Your decision depends on your goal.
For Listing Gains:
Focus on IPOs with strong GMP, high subscription, good financials
Book profits on listing if price rises sharply
For Long-Term Investment:
Focus on fundamentals, not GMP
Accumulate more if valuation becomes attractive after listing
6. SME IPO Analysis – Key Differences
SME IPOs require additional caution because they are smaller, riskier, and less regulated in terms of liquidity.
Important SME IPO Metrics
3-year financial stability
Strong promoter background
Consistent cash flows
Reasonable valuation
Low debt
Clear business expansion plan
Advantages of SME IPOs
High return potential
Early-stage investing opportunity
Many SME companies grow into mainboard success stories
Risks in SME IPOs
Low liquidity
High volatility
Smaller business scale
Potential for manipulation
Best Way to Approach SME IPOs
Focus on quality businesses, not hype
Prefer manufacturing, technology, healthcare, engineering SMEs
Avoid companies with sudden revenue spikes or loss-making history
7. How Retail Investors Should Approach IPOs
a) Identify Your Goal
Listing gain
Medium-term swing
Long-term holding
b) Read the RHP
This document contains complete details about financials, risks, promoter holdings, business strategy, etc.
c) Focus on QIB & HNI Demand
Institutions often understand valuations better.
d) Avoid Over-Hyped IPOs
Hype doesn’t guarantee gains.
e) Don’t Apply for Every IPO
Select quality, not quantity.
8. Key Indicators of a Strong IPO
A fundamentally strong IPO usually shows:
✔ Strong financial growth
✔ Low debt
✔ Good ROE & ROCE
✔ Experienced management
✔ Attractive valuation
✔ Positive GMP
✔ Strong QIB subscription
✔ Future-ready business model
Conclusion
IPO and SME IPO investing can be a powerful wealth-building strategy when done with proper analysis. While IPOs offer security and stable growth potential, SME IPOs offer higher risk but significantly higher rewards. The key to success lies in evaluating the company’s business model, financial health, promoter credibility, valuation, and demand indicators.
A disciplined approach—combining fundamental research with market sentiment—helps investors choose the right IPOs and avoid high-risk or overpriced ones. For long-term investors, a high-quality IPO can evolve into a multibagger, while SME IPOs can deliver extraordinary returns if selected wisely.
Trendcontinuationpatterns
Part 2 Support and Resistance Call Options Explained
A call option increases in value when the price of the underlying asset rises.
Example:
Nifty is at 20,000. A trader buys a Nifty 20,100 Call Option.
If Nifty crosses 20,100 before expiry, the call option gains value and the buyer profits.
Call option buyers expect the price to go up.
Call option sellers expect the price to stay below the strike.

Premium Chart Patterns RISK MANAGEMENT FOR PREMIUM PATTERNS
Premium setup ≠ reckless trading.
Always follow:
1. SL Placement
Place SL at logical structure points, not near the breakout.
2. Position Sizing
Risk 1–2% per trade.
3. Exit Strategy
Use partial booking or trail SL using swing lows.

SME IPO BUZZ FOR HUGE PROFITS1. What Are SME IPOs — And Why the Buzz?
SME IPOs are public issues floated by Small and Medium Enterprises that list on specialized platforms like:
NSE SME (Emerge)
BSE SME
These platforms provide small companies a chance to raise capital and investors an opportunity to participate in early-stage growth stories.
Why SME IPOs Have Become a Hot Trend
Massive oversubscriptions
Many SME issues are oversubscribed 100x to even 800x, reflecting huge liquidity and demand.
High listing gains
Many SMEs deliver 50%–200% listing pop, significantly higher than mainboard IPO averages.
Cheaper valuations
SMEs often come with smaller balance sheets but high growth potential, offering attractive valuations.
Low float → High volatility → Big gains
Small supply of shares means demand pushes prices up quickly.
Improved regulation & transparency
SEBI and exchanges have strengthened compliance, improving investor confidence.
2. SME IPO Mechanics: How They Work
Understanding the framework helps in capturing big gains.
Minimum Investment Is Higher
Unlike mainboard IPOs, SME IPOs require:
Minimum lot size ₹1–2 lakh
At times, ₹3–4 lakh per lot
This filters out casual investors and builds stability in demand.
Two IRP Categories
Retail quota: 35%
NII/HNI quota: 15%
QIB quota: 50%
Oversubscription in NII and QIB is a major indicator of strength.
Listing Platform
SME companies initially list only on SME exchanges.
Migration to mainboard is possible after reaching certain thresholds.
3. Why SME IPOs Can Generate Huge Profits
Let’s break down the reasons SME IPOs outperform mainboard IPOs:
A. Low Market Cap = High Growth Headroom
SME companies usually operate with revenues of ₹10–200 crore.
Any increase in orders, capacity, or profit quickly reflects on stock price.
Example:
A ₹50 crore company that gets a ₹20 crore contract can see a massive re-rating.
B. Limited Supply of Shares
Most SME IPOs offer small issue sizes:
₹10–50 crore.
This scarcity creates strong listing demand.
C. Strong Promoter Skin-in-the-Game
Promoters in SMEs often hold 70%–80% stake even after listing, creating confidence:
They have real business incentive
They don’t dilute aggressively
They manage business directly
This often results in more predictable growth.
D. Anchor and Institutional Participation
In many recent SME IPOs:
Family offices
PMS funds
Category II AIFs
UHNI investors
buy big allocation beforehand.
This strengthens credibility and improves listing demand.
4. How to Identify High-Potential SME IPOs
Here’s a simple but powerful analysis checklist to spot upcoming multibagger SME issues.
1. Strong Financials (Revenue, PAT, Margins)
Look for:
Revenue growth: 20–40% YoY
Profit margins: 8–15%+
Low debt
Avoid companies with sudden spike in profits just before IPO — often a red flag.
2. Reasonable Valuations
Even a great business can perform poorly if priced aggressively.
Compare:
P/E ratio vs sector P/E
EV/EBITDA
Market cap vs revenue
Safer zone:
PE below 20, or discount to peers.
3. Use of IPO Proceeds
Prefer IPOs where funds are used for:
Expansion
Working capital
Technology upgrades
Debt reduction
Avoid IPOs raising money for general corporate purposes only.
4. Strong Lead Manager Track Record
Top SME merchant bankers:
Fedex
Hem Securities
Pantomath
Gretex
Swastika Investmart
Their IPOs often have stronger post-listing performance.
5. Subscription Demand
High demand indicates strong market interest.
Key benchmarks:
Retail 20x+
NII 50x+
Overall 100x+
This significantly increases listing gain probability.
5. Strategies to Earn Huge Profits from SME IPOs
Here are the top profit-making strategies smart traders use:
A. Listing Gain Strategy
This is the most popular.
Steps:
Apply for strong SME IPOs
Target 40–150% listing pop
Exit on listing day or within 1–3 days
This minimizes risk and gives quick returns.
B. Post-Listing Breakout Strategy
Some SME IPOs consolidate after listing and give massive breakouts.
Look for:
Volume breakout
Price above listing high
Strong market trend
These stocks can become 2x to 5x within months.
C. Anchor Investor Following
If large anchors participate, buying post-listing during consolidation often yields good results.
D. Sector-Based Investing
Focus on high-growth sectors:
Defence
EV manufacturing
Pharma API
Auto components
IT services
Infra and engineering
These sectors dominate SME multibagger lists.
E. Avoiding Weak SMEs
Avoid companies with:
Sudden jump in profits pre-IPO
High receivables
High debt
Related-party transactions
Filtering negatives is as important as chasing positives.
6. Risks Associated with SME IPOs (Must Know)
Even though SME IPOs offer huge profits, they also carry unique risks.
1. Low Liquidity
Post listing, many SME stocks have limited buyers/sellers.
This can create:
Sharp price swings
Difficulty in exit
2. Price Manipulation (In Some Cases)
Low float sometimes attracts speculative operators.
Hence, due diligence is crucial.
3. High Lot Size = High Capital Requirement
You must invest ₹1–3 lakh minimum — increases risk exposure.
4. Limited Historical Data
Many SMEs are young companies without long-term financial history.
7. How to Participate Smartly — Practical Roadmap
Follow this step-by-step success system:
Step 1: Track Upcoming SME IPOs
Use sources:
Exchange websites, IPO blogs, SEBI filings.
Step 2: Apply Only for High-Quality IPOs
Use the 5-point checklist above.
Step 3: Play for Listing Gains in Over-Subscribed Issues
If NII crosses 100x, listing gains are almost guaranteed.
Step 4: Avoid Greed — Book Profits
SME stocks can crash after hype fades.
Step 5: For Long-Term, Pick Only Fundamentally Strong SMEs
Companies with clear growth path can deliver 5x–10x returns.
8. The Future of SME IPOs in India
The SME IPO market is expected to grow dramatically due to:
Government MSME support
Manufacturing boom
Retail investor participation
Better regulations
Strong Indian economy
This segment may produce the next wave of midcap multibaggers.
Conclusion
SME IPOs in India are no longer a hidden corner of the stock market — they are now a powerful wealth-building platform. With strong oversubscriptions, attractive valuations, and booming investor interest, they offer excellent opportunities for huge profits.
However, success requires smart filtering, disciplined strategy, risk management, and knowledge of SME dynamics.
If approached correctly, SME IPOs can be one of the most rewarding segments for modern Indian investors.
Options Trading & Greeks1. What Are Options?
Options are derivative contracts that give traders the right, but not the obligation, to buy or sell an asset (like stocks, indices, commodities, or currencies) at a preset price (strike price) within a specific period.
There are two major types:
1. Call Option
Gives the buyer the right to buy the underlying asset at the strike price.
Call Buyer → Bullish
Call Seller → Bearish
2. Put Option
Gives the buyer the right to sell the underlying asset at the strike price.
Put Buyer → Bearish
Put Seller → Bullish
Options can be bought or sold, creating four basic positions:
Long Call
Short Call
Long Put
Short Put
From these, traders build advanced strategies such as spreads, straddles, strangles, condors, butterflies, etc.
2. Why Trade Options?
Options offer benefits that stocks cannot:
1. Leverage
Small capital can control a large position.
2. Hedging
Protect your portfolio against downside risk (e.g., buying Puts).
3. Income Generation
Sell options regularly (like Covered Calls, Cash Secure Puts).
4. Flexibility & Strategy
Strategies exist for every type of market — trending, sideways, volatile, or low-volatility.
3. How Option Prices Are Determined
An option’s premium is influenced by:
Underlying Asset Price
Strike Price
Time to Expiry
Volatility
Interest Rates
Dividends
All these factors interact continuously and cause option premiums to fluctuate. Traders use Option Greeks to measure these changes and manage risk.
4. Introduction to Option Greeks
Greeks measure the sensitivity of an option’s price to various market factors. Think of them as tools that let you understand:
How much premium will change if price changes
How fast time decay will erode value
How volatility impacts premium
How the option behaves near expiry
The 5 major Greeks are:
Delta
Theta
Vega
Gamma
Rho
Let’s explore each in detail.
5. Delta – The Price Sensitivity Greek
Delta measures how much an option’s premium will change if the underlying price moves by ₹1.
Example:
If a Call option has Delta = 0.60
→ A ₹1 rise in the stock increases the premium by ₹0.60
Interpretation:
Call Delta: 0 to 1
Put Delta: -1 to 0
ATM options → around 0.50
ITM options → higher Delta (~0.70 to 0.90)
OTM options → lower Delta (~0.10 to 0.30)
Uses of Delta:
Predicting premium movements
Position sizing in options (Delta exposure)
Hedging (Delta neutral strategies)
As expiry approaches, Delta of ATM options moves sharply toward 1 or 0.
6. Gamma – The Acceleration Greek
Gamma measures how much Delta will change if the underlying asset moves by ₹1.
If Delta is the speed of movement, Gamma is the acceleration.
Importance:
Tells how unstable or stable your Delta is
ATM options have highest Gamma
Near expiry, Gamma becomes extremely high → risky
Why Traders Watch Gamma:
High Gamma = fast change in Delta → rapid premium movement
Option sellers fear high Gamma because small price moves can cause big losses
Gamma helps traders avoid selling risky options near expiry.
7. Theta – The Time Decay Greek
Theta measures how much an option loses in value every day due to time decay.
Options are wasting assets — they lose value as expiry approaches.
Example:
Theta = -6
→ The option loses ₹6 in premium each day (all else constant)
Key Points:
Theta is negative for option buyers
Theta is positive for option sellers
ATM options lose value fastest
Time decay accelerates in the last 10–15 days of expiry
Why Theta Matters:
Option sellers (writers) love Theta because they profit from time decay.
Option buyers must overcome Theta loss through strong directional moves.
8. Vega – The Volatility Greek
Vega measures how sensitive an option’s price is to changes in volatility.
Volatility is the heartbeat of options pricing. When volatility rises, options become more expensive.
Example:
Vega = 10
→ If IV increases by 1%, premium increases by ₹10
Volatility Impact:
High IV → expensive options
Low IV → cheap options
Vega Behaviors:
Highest for ATM options
Falls sharply near expiry
Impacts long-term options (LEAPS) more than short-term
Why Vega Matters:
Traders use Vega to:
Trade earnings announcements
Trade events (Union Budget, Fed decisions)
Avoid buying overpriced options
Take advantage of IV crush
9. Rho – The Interest Rate Greek
Rho measures sensitivity to changes in interest rates.
Example:
Rho = 5
→ a 1% rise in interest rates increases the premium by ₹5
Rho impacts:
Long-term options
Index options (slightly)
Hardly affects short-term equity options
It is the least important Greek for day-to-day trading but relevant for long-duration positions.
10. How Greeks Work Together
Greeks never work alone. They influence each other and create the real behavior of an option.
Example:
A high Delta ITM option also has low Gamma
An ATM option has high Gamma, high Vega, and high Theta
An OTM option has low Delta, low Gamma, and low Theta
Understanding these relationships helps you choose the right strike and expiry.
11. Practical Applications of Greeks
1. Directional Trading (Delta-based)
Choose high Delta options for directional moves.
Avoid low Delta (far OTM) options → high probability of decay.
2. Income Strategies (Theta-based)
Short Strangles, Iron Condors, Credit Spreads
→ Earn from time decay + low movement
3. Volatility Trading (Vega-based)
Trade before major events (high IV) and exit after IV crush.
4. Risk Management (Gamma-control)
Avoid selling naked ATM options near expiry due to high Gamma risk.
12. Greeks by Different Market Phases
Trending Market
Delta is most important
Use low Gamma (ITM options) for stability
Sideways Market
Theta becomes dominant
Use option selling strategies
High-Volatility Market
Vega spikes → options overpriced
Prefer selling IV (credit spreads, straddles)
Expiry Day
Gamma risk highest
Only experienced traders should trade
Theta is maximum (rapid decay)
13. Why Greeks Matter More in Indian Markets
India’s option market (specially Nifty and BankNifty) is:
Volatile
High participation
Weekly expiries
Strong intraday moves
This makes Greeks extremely important. A 20–50 point move in Nifty can drastically change Delta, Gamma, and Theta. Traders who understand Greeks avoid emotional trading and make data-driven decisions.
14. Conclusion
Options trading is not just about prediction — it is about understanding the forces that shape option prices. Greeks are your tools to measure:
Directional risk (Delta)
Acceleration risk (Gamma)
Time decay (Theta)
Volatility risk (Vega)
Interest rate sensitivity (Rho)
Mastering Greeks helps you:
Select the right strike
Choose the right expiry
Control losses
Optimize returns
Build safe strategies
Trade confidently
Whether you are a beginner looking to understand basics or an intermediate trader trying to refine strategies, knowing Greeks will transform your options trading journey.

Price Action Trading1. What is Price Action Trading?
Price action trading is the analysis of raw price movement on a chart. It involves studying candlestick patterns, support and resistance zones, trendlines, breakouts, volume behavior, and the psychology behind market participants’ actions. Instead of using lagging indicators, price action traders focus on:
Higher highs and higher lows
Support and resistance
Market structure
Trend strength
Candle patterns
Order flow concepts
Because price is immediate and reflects the most recent market decisions, price action helps traders stay aligned with real-time sentiment and avoids the delays of indicators.
2. Why Price Action Works
Price action works because it is rooted in the core principle of markets:
All buying and selling decisions are reflected in price.
Every candlestick tells a story:
A long wick shows rejection.
A big body shows strength.
A small range candle shows indecision.
A breakout candle signals aggression.
Unlike indicator-based trading, price action teaches traders to understand why something is happening, not just what is happening. This deeper understanding is why professional traders and institutional players rely heavily on price action.
3. Core Components of Price Action Trading
(A) Market Structure
Market structure is the backbone of price action. It tells you whether the market is trending, consolidating, or reversing.
Uptrend:
Higher Highs (HH)
Higher Lows (HL)
Downtrend:
Lower Highs (LH)
Lower Lows (LL)
Range:
Horizontal support and resistance
Equal highs and equal lows
Once you know the structure, you know the bias.
(B) Support and Resistance (S/R)
Support and Resistance are areas where price reacts repeatedly because buyers or sellers defend those levels. They are widely used in price action trading.
Support: A level where buying pressure exceeds selling pressure.
Resistance: A level where selling pressure exceeds buying pressure.
The strongest S/R zones have:
Multiple touches
Volume confirmation
Trend alignment
Psychological round numbers (like 100, 500, 1000)
(C) Candlestick Patterns
Candlesticks reflect market psychology and reveal what buyers and sellers are doing.
Key price action patterns include:
Pin Bar (Hammer / Shooting Star) – Strong rejection
Engulfing Pattern – Trend reversals or continuation
Inside Bar – Low volatility → breakout setup
Doji – Indecision
Marubozu – Strong directional momentum
Candlesticks are tools for confirming entries and exits.
(D) Breakouts and Fakeouts
Price often breaks above or below important levels. But not all breakouts sustain. Many fail — known as fakeouts.
A good price action trader learns to differentiate between:
True breakout: High volume, strong candle body, retest
False breakout: Wick break, low volume, immediate reversal
Fakeout trading is one of the most profitable techniques when mastered.
(E) Trendlines and Channels
Trendlines help visualize structure and momentum. Two or more touches create a valid trendline.
Channels (rising or falling) help traders locate:
Buying opportunities at lower boundary
Selling opportunities at upper boundary
Breakouts at structure collapse
Trendlines enhance clarity in volatile markets.
4. Price Action Entry Techniques
There are several reliable entry models:
(A) Breakout Entry
Traders enter when price breaks a major level:
Resistance breakout → Buy
Support breakout → Sell
Strong breakout confirmation includes:
Big-bodied candle
Volume increase
Retest of level
(B) Pullback Entry
This is the most common entry for professional traders.
Steps:
Identify trend
Wait for correction
Look for price action signal
Enter with trend continuation
Pullback entries offer high reward-to-risk ratios.
(C) Reversal Entry
Used at key S/R zones.
Signals include:
Pin Bar at resistance
Engulfing candle at support
Divergence between price and momentum
Reversal entries require patience and confirmation.
5. Price Action Exit Strategies
(A) Fixed Target Exit
Based on S/R levels, Fibonacci targets, or ATR projections.
(B) Trailing Stop Exit
Use structure-based trailing:
Swing high/lows
Trendline breaks
Moving average (optional)
(C) Partial Profit Booking
Sell half at first target, trail rest.
This reduces risk and increases consistency.
6. Risk Management in Price Action Trading
Risk management is inseparable from price action.
Key principles:
Risk 1–2% per trade
Use stop loss below/above structure
Never chase trades
Avoid overtrading
Trade high-probability zones
Maintain minimum 1:2 or 1:3 RR
Price action is powerful, but without risk control, even the best trades can fail.
7. Psychological Aspect of Price Action
Price action exposes traders to raw market volatility, so emotional discipline is essential.
Key psychological principles:
Stick to your plan
Don’t interpret noise as signals
Trust structure and patterns
Accept losing trades
Stay unbiased—trade what the chart shows
Avoid revenge trades
Markets reward disciplined behavior more than aggressive behavior.
8. Major Price Action Strategies
(A) Trend Following Strategy
Identify trend
Buy pullbacks in uptrend
Sell pullbacks in downtrend
Confirm with candle patterns
This is the most reliable and beginner-friendly approach.
(B) Reversal Trading Strategy
Look for reversal patterns at major S/R levels:
Pin bar reversal
Double top/bottom
Head and shoulders
Engulfing reversal
Reversal trading offers high RR but requires experience.
(C) Breakout and Retest Strategy
One of the cleanest setups:
Price breaks a strong level
Comes back to retest
Forms a bullish/bearish signal
Enter towards breakout direction
Institutional traders commonly use this.
(D) Range Trading Strategy
In a sideways market:
Buy support
Sell resistance
Wait for breakout to stop range trading
Ranges are predictable and profitable for price action traders.
9. Advantages of Price Action Trading
Works on all markets and timeframes
No dependency on indicators
Quick decision-making
Clears chart from clutter
Aligns with institutional trading
Easy to learn but deep to master
Works even in low-volume markets
10. Limitations of Price Action Trading
Requires screen time and practice
Highly subjective
Can generate false signals in choppy markets
Emotional discipline needed
News events can disrupt structure
Price action is powerful, but traders must combine it with risk management and emotional control.
Conclusion
Price Action Trading is a complete trading ecosystem—focused on understanding how price behaves, how market participants react, and how to trade based on pure market psychology. It eliminates reliance on lagging indicators and teaches traders to interpret structure, trends, reversals, breakouts, and raw candlestick signals. With practice, traders using price action gain clarity, develop confidence, and improve consistency across all market conditions.

Technical Analysis (TA) Mastery1. The Foundations of Technical Analysis
At its core, technical analysis relies on three key assumptions:
1.1 Market Discounts Everything
All information—economic, political, sentiment, and fundamental—is already reflected in price. Therefore, reading price is reading the collective behavior of market participants.
1.2 Prices Move in Trends
Markets do not move randomly; they move in trends: uptrends, downtrends, and sideways consolidations. Mastering TA requires identifying these trends early and riding them until signs of reversal emerge.
1.3 History Repeats Itself
Price patterns repeat because investor psychology—fear and greed—remains constant over time. Patterns like head and shoulders, triangles, and flags exist across decades because of this behavioral consistency.
2. Market Structure: The Backbone of TA Mastery
Before indicators, price patterns, or oscillators, a trader must learn how markets actually move.
2.1 Trend Structure
Uptrend: Higher highs (HH), Higher lows (HL)
Downtrend: Lower highs (LH), Lower lows (LL)
Sideways: Equal highs and lows
Identifying these structures helps traders avoid counter-trend mistakes and focus on high-probability setups.
2.2 Support & Resistance (S&R)
These are the most powerful tools in TA:
Support: A price level where buyers consistently step in.
Resistance: A price level where sellers emerge.
Strong S&R zones act like “decision points” where breakouts or reversals occur. TA mastery includes knowing when a level will hold or break—based on volume, candlesticks, and momentum.
2.3 Market Phases
Every market cycles through four stages:
Accumulation
Markup
Distribution
Markdown
This Wyckoff-style structure helps traders catch big moves and avoid traps.
3. Candlestick Mastery: Price Action at its Purest
Candlesticks represent raw decision-making in the market. Learning them gives you an instant emotional map—who controls the market: bulls or bears?
3.1 Key Candlestick Types
Doji → Indecision
Hammer/Inverted Hammer → Reversal signals
Engulfing → Strong reversal confirmation
Marubozu → Heavy momentum
3.2 Candlestick Patterns
Morning Star & Evening Star
Bullish/Bearish Engulfing
Pin Bar reversals
Inside Bars and Breakout Bars
Mastery comes when you can read candlesticks in context—resistance, trend direction, and volume matter more than the pattern itself.
4. Indicators and Oscillators: Enhancers, Not Predictors
Indicators help confirm price action. TA mastery means using them smartly, not blindly.
4.1 Trend Indicators
Moving Averages (20, 50, 200)
MACD
Use them to confirm trend direction and catch momentum shifts.
4.2 Momentum Indicators
RSI
Stochastic
CCI
These show overbought/oversold conditions, but only matter when aligned with trend strength.
4.3 Volatility Indicators
Bollinger Bands
ATR (Average True Range)
Great for breakout trades and stop-loss placement.
4.4 Volume Indicators
Volume Profile
OBV (On Balance Volume)
VWAP
Volume is the real power behind price movement. Breakouts with volume = reliable. Breakouts without volume = trap.
5. Chart Patterns: The Trader’s Language
Patterns represent crowd psychology. TA mastery involves recognizing these patterns early and calculating the risk–reward.
5.1 Continuation Patterns
Bull flags / Bear flags
Triangles (ascending, descending, symmetrical)
Rectangles
Cup and Handle
These indicate that the trend is likely to continue after a short pause.
5.2 Reversal Patterns
Head and Shoulders
Double Top / Bottom
Rounding Bottom
Falling / Rising Wedge
These help traders catch major turning points.
5.3 Breakouts and Fakeouts
Recognizing real breakouts vs false breakouts is critical. Volume, candle strength, and retests help filter traps.
6. Multi-Timeframe Analysis (MTA): The Secret Weapon of Pros
What beginners see as noise, experts see as structure.
6.1 How to Apply MTA
Higher timeframe (HTF): Identify trend → Weekly/Monthly
Middle timeframe: Identify S&R → Daily
Lower timeframe (LTF): Entry timing → 15m/1h
This top-down approach ensures every trade aligns with the bigger picture.
6.2 Benefits of MTA
Fewer false signals
Cleaner entries
Better trend direction understanding
Higher win rate
7. Risk Management: The Real TA Mastery
Even the best analysis fails without proper risk controls.
7.1 Position Sizing
Never risk more than 1–2% of capital per trade.
7.2 Stop-Loss Placement
Use:
ATR-based stops
Swing highs/lows
Major S&R
7.3 Risk–Reward Ratio (RRR)
Aim for at least 1:2 or 1:3 to stay profitable even with moderate accuracy.
7.4 Avoiding Overtrading
Mastery means waiting for high-probability setups, not trading every small move.
8. Trading Psychology: The Brain Behind TA
TA mastery is 70% psychology.
8.1 Common Psychological Traps
Fear of missing out (FOMO)
Revenge trading
Holding losing trades
Taking profits too early
8.2 Developing the Trader’s Mindset
Discipline > prediction
Consistency > luck
Process > outcome
A trader’s biggest enemy is not the market—it’s emotions.
9. Building a Professional TA Strategy
To truly master TA, you need a structured system.
9.1 The 5-Step Trading Blueprint
Identify Market Trend – MA, structure
Mark HTF S&R – weekly/daily
Look for Price Action Signals – candle patterns + volume
Confirm with Indicators – RSI, MACD, VWAP
Execute with Risk Control – stop-loss, position size
9.2 Backtesting Your Strategy
Check how your setup performs over 100–200 past trades. Backtesting reveals:
Win rate
Average RR
Drawdown
Strategy reliability
10. Continuous Improvement: The Path to TA Mastery
Markets evolve, and so must traders.
10.1 Keep a Trading Journal
Record:
Entry/exit
Reason for trade
Setup type
Emotional state
Lessons learned
10.2 Learn from Market Cycles
Each cycle—bull, bear, sideways—teaches different strategies.
10.3 Stay Updated
Follow market sentiment, global cues, and macro stories to complement TA.
Conclusion
Technical Analysis Mastery is not just learning indicators or patterns. It is the art of understanding price behavior, recognizing market psychology, and applying risk-controlled strategies consistently.
A true TA master:
Reads price like a story
Executes like a machine
Manages risk like a professional
Improves continuously

Divergence Secrets Risks in Option Trading
High volatility risk
Time decay for buyers
Unlimited loss for sellers
Gap-up or gap-down opening risk
Liquidity issues in stock options
Wrong position sizing leads to heavy losses
Tips for Option Traders
Always trade with a clear plan: entry, exit, stop-loss.
Avoid trading just before big news events unless experienced.
Track global markets, FIIs, indices.
Manage risk: never risk more than 1–2% of capital per trade.
Learn option Greeks—Delta, Theta, Vega are essential.
Start with buying options; move to selling only after experience.
Avoid low-liquidity contracts.

Part 10 Trade Like Institutons Call Option (CE) Explained
A call option benefits from price going UP.
Call Buyer
Pays premium.
Unlimited profit potential.
Loss limited to premium paid.
Call Seller
Receives premium.
Profit limited to premium received.
Loss can be unlimited if price rises sharply.
Example:
You buy Nifty 22000 CE for ₹100.
If Nifty moves to 22100 at expiry, your option becomes ITM (In-the-money).
Intrinsic value = 22100 – 22000 = 100
You break even at 22100.
If Nifty moves to 22200,
Intrinsic value = 200
Profit = 200 – 100 = 100.

Part 7 Trading Master Class With Experts What Are Options?
Options are derivative instruments whose value is derived from an underlying asset such as Nifty, Bank Nifty, stocks, commodities, or currencies.
An option is a contract between a buyer and seller regarding the future price of an asset within a specific time.
There are two types of options:
Call Option (CE) – Gives the buyer the RIGHT (but not the obligation) to BUY the asset at a fixed price (strike price).
Put Option (PE) – Gives the buyer the RIGHT (but not the obligation) to SELL the asset at a fixed price.
The seller (also called option writer) has the OBLIGATION to fulfill the contract if the buyer exercises the option.

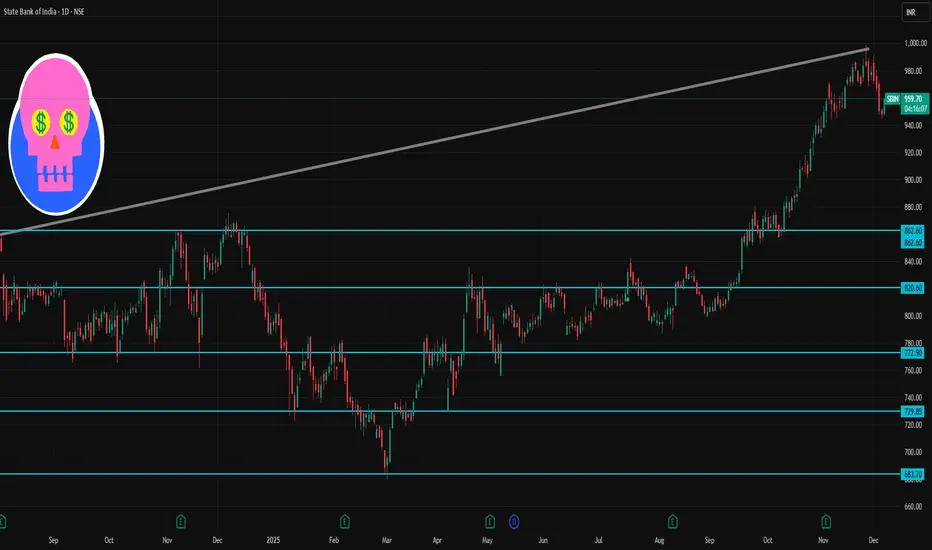
SBI 1 Day Time Frame 📌 Current Price Context
According to recent sources, SBI is trading around ₹949–₹957 (NSE/BSE) depending on the feed.
Its 52‑week trading range remains roughly ₹680 (low) to ₹999 (high).
🎯 What to Watch: Possible Scenarios
Bullish bias: If price holds above pivot (~₹988) and breaks above R1 (~₹994.5), watch for a move toward ~₹1005–₹1010+.
Neutral / Range‑bound: If price oscillates between support (~₹977–₹971) and pivot/resistance zone (~₹988–₹994), expect sideways movement.
Bearish bias: Break and close below S2/S3 (~₹971–₹960) might open downside — next major cushion near ~₹950–₹940.
Part 4 Learn Institutional TradingTrading Rules & Conditions Set by SEBI & Exchanges
a) KYC & Risk Disclosure
KYC and Risk Disclosure Documents (RDD) are mandatory before enabling F&O trading.
b) Contract Specifications
Every option contract has pre-defined:
Strike intervals
Lot size
Tick size
Expiry cycle (weekly/monthly)
c) No Guarantee of Profit
Exchanges emphasize that options are risky; brokers must warn traders.
d) No Insider Trading
Traders cannot use non-public information for trading.
e) Brokers Must Provide Transparency
Brokers need to show:
Margin reports
Contract notes
Daily ledger reports

Part 3 Learn Institutional Trading Expiry & Settlement Terms
a) Index Options (Nifty, Bank Nifty)
They are settled in cash, not in shares.
b) Stock Options
They are settled through physical delivery of shares if the contract expires in-the-money.
c) European Style Options (India)
Indian markets allow exercise only on expiry day, unlike American options (any time).
d) Premium Settlement
Premium is paid upfront while taking the position.
e) Final Settlement Price (FSP)
Exchanges calculate it based on the closing price of the underlying asset on expiry.

Part 2 Ride The Big MovesMargin Requirements: Critical Conditions
Margins are financial requirements that protect the market from defaults.
a) Initial Margin
This is required when the position is opened. It includes:
SPAN margin
Exposure margin
b) Maintenance Margin
Traders must maintain a minimum balance to keep positions open.
c) Additional Margin
If volatility increases, brokers may collect extra margins.
d) Physical Delivery Margin
Mandatory if stock options are taken near expiry.
e) Penalties
Failure to meet margin requirements leads to:
Squaring off of positions
Penalty charges
Blocking of trading account
Understanding margin rules is crucial for safe option trading.

Part 2 Intraday Master ClassRights of Option Buyers
Option buyers have certain rights defined by the exchange:
a) Right to Buy (Call Buyer)
The buyer can buy the asset at the strike price even if market price is higher.
b) Right to Sell (Put Buyer)
The buyer can sell at the strike price even if market price is lower.
c) No Obligation to Exercise
If the market is not favorable, traders can let the contract expire without exercising.
d) Limited Risk
The maximum loss for option buyers is the premium paid.
e) Unlimited Profit Potential
Call buyers can profit from rising markets
Put buyers can profit from falling markets
These rights are protected by the exchange, SEBI rules, and clearing corporations.

Option Chain Analysis Time Decay (Theta): A Major Profit Source
Time decay is a predictable reduction in premium as expiry approaches.
How Theta works:
Buyers lose money daily if the price does not move.
Sellers gain money daily even if nothing happens.
Example:
Premium at start of week: ₹200
No price movement
By expiry: ₹20
Sellers keep ₹180 simply because time passed.

Part 2 Trading Master ClassHow Option Sellers Earn Profit
Option sellers (writers) make money very differently from buyers.
Sellers earn through:
Premium collection
Time decay (Theta) working in their favor
Market staying within a defined range
Selling gives higher probability of profit but unlimited risk if the market moves aggressively.
Example:
You sell Bank Nifty 49,000 CE at ₹220
Market stays sideways or falls
Premium collapses to ₹30
Your Profit = (220 – 30) × Lot Size
This profit results from the sold option expiring worthless.

Part 1 Trading Master ClassHow Put Options Generate Profit
A Put Option gives you the right to sell an asset at a fixed strike price.
You profit from a put when:
Underlying price moves below strike
Premium increases because market falls
Example:
Nifty at 22,000
You buy Put 22,000 PE for ₹100
Market falls to 21,700
Premium rises to ₹210
Your Profit = (210 – 100) × Lot Size
Put buyers make money when markets fall, similar to short selling but with limited risk.

Part 2 Support and Resistance How Call Options Generate Profit
A Call Option gives you the right—but not obligation—to buy an asset at a fixed price (strike price).
You profit from a call option when:
The market price goes above the strike price.
The premium increases due to:
Price movement
Increased volatility
Reduced time to expiry near ITM levels
Example:
Nifty trading at 22,000
You buy Call 22,000 CE at ₹120
Price moves to 22,200
Premium increases to ₹200
Your Profit = (200 – 120) × Lot Size
This profit comes without buying the actual index—just the premium appreciation.

Part 1 Support and Resistance Understanding the Foundation of Option Profits
Before diving into strategies, two basic forces determine profit in options:
A. Price Movement of the Underlying
If the underlying asset (stock, index, commodity) moves in the direction you expect, your option gains value.
Calls gain when price goes up
Puts gain when price goes down
B. Premium (Option Price)
Premium is the amount you pay (for buyers) or receive (for sellers/writers).
Profit/loss happens based on how this premium changes.

Part 8 Trading Master ClassLong Put – Best for Bearish Markets
This is the opposite of a long call.
How it works
You buy a put option.
Profit when price drops below strike.
When to use
You expect a sharp fall.
You want a cheap hedge for your portfolio.
Risk and reward
Risk: Limited to premium paid.
Reward: Large profit as price falls.
Example
You buy 48,000 put on Bank Nifty for ₹80.
If BN falls to 47,500, the option may rise to ₹600.

Part 4 Learn Institutional Trading Covered Call – Best for Slow Uptrend or Range-Bound Markets
A covered call is one of the safest option strategies and perfect for long-term investors who already hold stocks.
How it works
You own shares of a stock.
You sell a call option at a higher strike price.
You earn the premium upfront.
If price stays below strike, you keep the premium + your shares.
When to use
You expect slow gains, not a big rally.
You want regular income from your holdings.
Risk and reward
Risk: Stock price can fall (same as holding shares).
Reward: Premium income + small upside until strike.
Example
You own 100 shares of TCS at ₹3,800.
You sell a ₹3,900 call for a premium of ₹20.
If the stock stays below ₹3,900, you keep ₹2,000 premium.

Part 2 Ride The Big MovesThe Role of Time Decay (Theta)
Options lose value as time passes. This is called time decay.
If you are an option buyer, time is your enemy.
If you are an option seller, time is your friend.
Near expiry, premium drops rapidly.
This is why many intraday traders take advantage of selling options during low volatility.
