Part 7 Trading Master Class With Experts Option Expiry
Every option has an expiration:
Weekly expiry
Monthly expiry
Close to expiry, time decay becomes extremely fast.
Why Expiry Day Is Dangerous?
Huge volatility
Premium collapses quickly
Big risk for inexperienced traders
But for skilled option sellers, expiry day is profitable due to rapid theta decay.
Trendindicator

How Large-Scale Forces Shape Global Markets and EconomiesMacro Events Impact:
Macro events are large-scale economic, political, financial, and social developments that influence entire countries, regions, or the global system. Unlike company-specific or sector-specific factors, macro events operate at a broader level and often create ripple effects across markets, industries, currencies, and investor sentiment. Understanding the impact of macro events is essential for policymakers, businesses, investors, and individuals, as these forces determine economic cycles, capital flows, and long-term growth trends.
1. Understanding Macro Events
Macro events refer to significant developments that affect the overall economic environment. These include interest rate changes, inflation trends, geopolitical conflicts, pandemics, technological disruptions, climate events, and major policy decisions. Because they influence supply, demand, liquidity, and confidence at a systemic level, macro events often trigger widespread reactions across financial markets and real economies.
Such events are usually beyond the control of individual firms or investors, yet their impact can be profound. A single macro decision—such as a central bank raising interest rates—can alter borrowing costs, investment behavior, consumption patterns, and asset valuations globally.
2. Monetary Policy and Interest Rate Decisions
One of the most powerful macro events is a change in monetary policy by central banks. Interest rate hikes or cuts influence inflation control, economic growth, and currency strength. When rates rise, borrowing becomes expensive, slowing down consumption and investment. Equity markets often react negatively, while bonds and currencies may strengthen depending on expectations.
Conversely, rate cuts aim to stimulate economic activity by encouraging spending and investment. Liquidity injections through quantitative easing can push asset prices higher, sometimes creating asset bubbles. Markets closely track central bank communication, as even small signals or guidance can cause volatility.
3. Inflation and Economic Growth Data
Inflation reports, GDP growth numbers, employment data, and industrial production figures are key macro indicators. Higher-than-expected inflation reduces purchasing power and forces policymakers to tighten monetary conditions. This can lead to stock market corrections, higher bond yields, and currency fluctuations.
Strong economic growth data usually supports equity markets, but if growth is accompanied by rising inflation, the positive effect may be short-lived. Weak data, on the other hand, raises fears of recession, reducing risk appetite and increasing demand for safe-haven assets like gold or government bonds.
4. Fiscal Policy and Government Decisions
Government spending, taxation policies, subsidies, and budget deficits also represent critical macro events. Expansionary fiscal policy, such as increased infrastructure spending or tax cuts, can boost economic activity in the short term. Sectors like construction, manufacturing, and consumer goods often benefit from such measures.
However, excessive fiscal deficits can raise concerns about debt sustainability, leading to higher bond yields and currency depreciation. Markets assess not only the size of fiscal measures but also their long-term impact on economic stability and growth.
5. Geopolitical Events and Global Uncertainty
Wars, trade disputes, sanctions, and diplomatic tensions significantly affect global markets. Geopolitical instability disrupts supply chains, raises commodity prices, and increases uncertainty. Energy markets are particularly sensitive to conflicts in oil- and gas-producing regions.
Trade wars and sanctions can reduce global trade volumes, affect corporate profitability, and slow economic growth. Investors often respond by reducing exposure to risky assets and shifting capital toward safer regions or instruments.
6. Global Crises and Black Swan Events
Unexpected macro events such as financial crises, pandemics, or systemic banking failures have far-reaching consequences. These “black swan” events typically cause sharp market sell-offs, liquidity shortages, and economic contractions.
The global financial crisis demonstrated how interconnected financial systems amplify shocks. Similarly, pandemics can simultaneously affect supply, demand, labor markets, and consumer behavior. Recovery from such events often requires coordinated global policy responses.
7. Currency Markets and Capital Flows
Macro events strongly influence currency valuations. Interest rate differentials, economic stability, and political confidence drive capital flows between countries. A strong currency can reduce export competitiveness, while a weak currency can increase inflation through higher import costs.
Emerging markets are particularly vulnerable to macro shocks such as sudden changes in global interest rates or risk sentiment. Capital outflows during periods of global uncertainty can pressure currencies, stock markets, and foreign exchange reserves.
8. Commodity Prices and Inflation Transmission
Commodities such as oil, metals, and agricultural products are highly sensitive to macro events. Supply disruptions, geopolitical tensions, and weather-related events can cause sharp price movements. Rising commodity prices often feed into inflation, affecting consumers and businesses alike.
Energy prices, in particular, play a crucial role in shaping inflation trends and economic growth. Sustained high energy costs can reduce corporate margins and household spending power.
9. Impact on Financial Markets
Equity markets, bond markets, and alternative assets all respond differently to macro events. Stocks are influenced by growth expectations and corporate earnings, while bonds react to inflation and interest rate outlooks. Gold and other safe-haven assets tend to perform well during periods of uncertainty.
Market volatility often increases around major macro announcements. Investors adjust portfolios based on changing risk perceptions, leading to sector rotation and shifts between asset classes.
10. Long-Term Structural Implications
Some macro events create lasting structural changes. Technological advancements, demographic shifts, climate policies, and globalization trends reshape economies over decades. These long-term macro forces influence labor markets, productivity, and competitive dynamics across industries.
Understanding these structural impacts helps investors and policymakers make informed decisions beyond short-term market reactions.
Conclusion
Macro events are powerful forces that shape economic outcomes and financial market behavior. From central bank policies and inflation trends to geopolitical conflicts and global crises, these events influence growth, stability, and investor confidence at a systemic level. While macro events often create uncertainty and volatility, they also present opportunities for those who understand their implications. A comprehensive awareness of macro impacts enables better risk management, strategic planning, and long-term decision-making in an increasingly interconnected global economy.

Option Trading1. Common Mistakes by Retail Traders
Buying far OTM options
Overtrading
No stop-loss
Ignoring volatility
Selling naked options without hedge
Trading near expiry without plan
Following tips blindly
2. Best Practices for Option Trading
✔ Trade with a system
✔ Check trend (market structure)
✔ Use option Greeks
✔ Focus on liquidity
✔ Avoid gambling with OTM
✔ Use spreads to reduce risk
✔ Journal your trades

IFCI 1 Day Time Frame 📌 Live Price (approx current)
• IFCI trading around ₹57–₹58 on NSE today (Jan 13, 2026) — price moves with the market and may vary minute‑to‑minute.
🧱 Daily Support & Resistance (Key Levels)
Resistance Levels (Upside)
🔹 R1 (Immediate): ~₹59–₹60 — first upside barrier where price may stall.
🔹 R2: ~₹62–₹62.20 — next resistance zone above R1.
🔹 R3: ~₹63.5–₹64 — stronger upper resistance on a breakout.
Support Levels (Downside)
🟢 S1 (Immediate): ~₹56.0 — crucial first support zone.
🟢 S2: ~₹54.6 — secondary support level if price dips below S1.
🟢 S3: ~₹52.2–₹52.3 — major lower support zone on a deeper pullback.
Pivot Reference
⭐ Pivot ~₹58.4 — daily equilibrium level around which price may oscillate.
📊 What This Means (Daily View)
Bullish price structure
• Price above recent supports suggests bulls defending lower levels.
• A close above ₹59–₹60 could add momentum toward ₹62+ resistance.
Caution zones
• Failure below ₹56 may see further pullback toward ₹54.6 then ₹52+.
• Daily momentum might fluctuate — use volume and candlestick patterns to confirm moves.
🧠 Quick Take
Bullish bias above ₹59–₹60 with targets near ₹62–₹64;
Bearish risk below ₹56 with deeper support near ₹54.6–₹52.3.
Pivot near ₹58.4 acts as a short‑term balance point for intraday position decisions.

TITAN 1 Week Time Frame 📌 Current Price Context
• The stock is trading around ₹4,230 – ₹4,260 on NSE/BSE today.
• It hit a 52-week high ~₹4,312 recently after strong quarterly results.
📊 Weekly Support & Resistance Levels (1-Week Timeframe)
(Based on pivot analysis for the current weekly chart)
🔼 Resistance Levels
R1 (Immediate): ₹4,327
R2: ₹4,453
R3: ₹4,593
These are key upside hurdles this week — above these, stronger bullish bias.
🔽 Support Levels
S1 (Immediate): ₹4,061
S2: ₹3,921
S3: ₹3,795
If price breaks below S1 → deeper correction risk toward S2/S3.
📌 Weekly Pivot Base
Weekly central pivot zone: ~₹4,186–₹4,218
This can act as a short-term balance area for price rotation this week.
🧠 Quick Reference Table — Weekly Levels
Level Price (₹) Significance
R3 ~4,593 Major weekly upside limit
R2 ~4,453 Secondary resistance
R1 ~4,327 Immediate upside barrier
Pivot zone ~4,186–4,218 Weekly balance level
S1 ~4,061 Immediate support
S2 ~3,921 Next support if S1 breaks
S3 ~3,795 Deep support zone
💡 Summary: Titan’s 1-week view shows a short-term bull bias while above ₹4,061, with upside resistance near ₹4,327–₹4,453 and strong weekly range ₹4,061–₹4,453. A break below support levels opens room for deeper correction.

NATIONALUM 1 Week Time Frame 📊 Current Price (approx)
• Trading around ₹347 – ₹355 range recently. Last prices show ~₹350–357 levels.
📈 Key Levels for the Next 1 Week (Short-Term View)
🔹 Resistance (Upside Targets)
1. Near-term resistance ~₹358-362 — current upper zone where sellers may appear.
2. Next resistance ~₹366-370 — above current high, breakout zone bulls will aim.
3. Extended resistance ~₹375-380 if momentum stays strong. Forecast models also show potential around these levels later in the week.
Interpretation:
Above ₹362-366, early breakout continuation could target ₹370-380 this week.
Sustained trade above ₹375 would signal strong short-term bullish strength.
🔻 Support (Downside Floors)
1. Immediate support ~₹342-347 — recent pullbacks found buyers here.
2. Next support ~₹335-338 — confluence of recent lows and pivot support.
3. Major support ~₹328-332 — deeper pullback zone; break below indicates bearish risk for the week.
Interpretation:
Holding ₹342-347 is key for the short-term uptrend to remain intact.
A break below ₹335 could see further slide toward ₹328-320 levels.
⚖️ Pivot / Range This Week
Bullish bias: Above ~₹350 pivot zone.
Neutral/Consolidation zone: ~₹342-350 — sideways action likely.
Bearish tilt: Below ~₹338 — increases probability of deeper correction.
📍 Short-Term Trading Notes
📌 Bullish scenario: If price closes above ₹362-366 on daily, expect continuation toward ₹370+ next days.
📌 Bearish scenario: Failure to hold ₹342-347 could see range slide toward ₹328-332.

A Stock Market Crash Warning for the Indian MarketRupee Bubble About to Pop?
In recent months, concerns have been rising among investors, economists, and market participants about whether the Indian rupee is being artificially supported and whether a potential “rupee bubble” could burst, triggering turbulence in the stock market. While India remains one of the world’s fastest-growing major economies, financial markets often move ahead of fundamentals. When currency valuations, capital flows, interest rate differentials, and equity prices become misaligned, the risk of a sharp correction increases. This has led to growing speculation that a sudden depreciation of the rupee could act as a catalyst for a broader stock market crash in India.
Understanding the Idea of a “Rupee Bubble”
A currency bubble does not mean the rupee is overvalued in absolute terms, but rather that it may be trading at levels that do not fully reflect underlying economic pressures. Persistent current account deficits, rising fiscal burdens, imported inflation, and global tightening of liquidity can strain any currency. When central banks intervene heavily to stabilize exchange rates, they may delay volatility—but not eliminate it. Over time, such interventions can create a false sense of stability, encouraging excessive risk-taking in equities and debt markets.
In India’s case, foreign portfolio investors (FPIs) play a crucial role. Large inflows support the rupee and push stock indices higher. However, these flows are highly sensitive to global interest rates, especially US Federal Reserve policy. If global investors suddenly shift capital back to dollar assets, the rupee could weaken rapidly, exposing vulnerabilities that were previously masked.
Global Factors Pressuring the Rupee
One of the biggest threats to the rupee comes from global monetary conditions. When the US dollar strengthens due to higher interest rates or safe-haven demand, emerging market currencies typically come under pressure. India is no exception. A strong dollar increases the cost of imports, particularly crude oil, widening the trade deficit and putting downward pressure on the rupee.
Additionally, geopolitical tensions, global recession fears, and volatility in commodity markets can trigger risk-off sentiment. In such scenarios, investors tend to exit emerging markets first. A sudden reversal of capital flows could cause the rupee to depreciate sharply, catching equity markets off guard.
Link Between Rupee Weakness and Stock Market Crashes
A falling rupee is not always bad for equities. Export-oriented sectors like IT and pharmaceuticals often benefit from currency depreciation. However, a sharp and disorderly fall in the rupee can be dangerous. It raises inflation, increases input costs, and forces the central bank to tighten monetary policy. Higher interest rates hurt corporate earnings, reduce consumption, and compress valuation multiples.
Indian stock markets, especially large-cap indices, have seen periods of rich valuations driven by liquidity rather than earnings growth. If the rupee weakens rapidly, foreign investors may rush to exit, leading to heavy selling pressure. This can snowball into a broader market crash, particularly in sectors dependent on foreign capital such as banking, financial services, and infrastructure.
Debt, Deficits, and Hidden Risks
India’s fiscal and current account deficits are manageable but remain structural concerns. Rising government borrowing can crowd out private investment and increase dependence on foreign capital. If global funding conditions tighten, refinancing risks increase. A weaker rupee also raises the burden of external debt, especially for companies with unhedged foreign currency exposure.
Corporate balance sheets may look stable during periods of currency calm, but sudden depreciation can expose mismatches between revenues and liabilities. This can lead to credit stress, higher non-performing assets in the banking system, and erosion of investor confidence—classic ingredients for a market downturn.
Valuation Excesses and Retail Euphoria
Another warning sign is the surge in retail participation and speculative activity. When markets rise steadily alongside a stable currency, investors begin to assume that volatility is a thing of the past. This complacency can inflate bubbles in mid-cap and small-cap stocks, where valuations often detach from fundamentals.
If the rupee bubble bursts, sentiment can flip quickly. Retail investors, who entered markets expecting quick gains, may panic during sharp corrections. This can amplify selling pressure, turning a currency shock into a full-blown stock market crash.
Role of the RBI: Protector or Pressure Point?
The Reserve Bank of India (RBI) has been proactive in managing currency volatility using its foreign exchange reserves. While this provides short-term stability, it also raises questions about sustainability. Reserves are finite, and defending a particular level of the rupee indefinitely is neither practical nor desirable.
If the RBI is forced to choose between supporting growth and defending the currency, tough decisions will follow. Aggressive rate hikes to protect the rupee could hurt equities, while allowing the rupee to weaken could trigger capital outflows. Either path carries market risks.
Is a Crash Inevitable?
A rupee depreciation does not automatically guarantee a stock market crash. India’s long-term growth story, demographic advantage, and structural reforms remain strong. However, markets are cyclical, and excess optimism often precedes sharp corrections. The real danger lies in a sudden, unexpected move rather than a gradual adjustment.
If global conditions deteriorate rapidly and capital flows reverse, the combination of rupee weakness, high valuations, and leveraged positions could result in a painful market correction. Such a crash would likely be sharp but could also reset valuations to more sustainable levels.
What Should Investors Watch?
Investors should closely monitor foreign institutional flows, crude oil prices, US dollar strength, and RBI policy signals. Rising bond yields, widening trade deficits, and increased currency intervention are early warning signs. Diversification, risk management, and realistic return expectations are critical during such uncertain phases.
Conclusion
The narrative of a “rupee bubble about to pop” reflects growing anxiety rather than certainty. However, history shows that currency stress and equity market crashes often go hand in hand in emerging economies. While India’s fundamentals remain resilient, complacency can be dangerous. A sharp rupee depreciation could act as a trigger, exposing valuation excesses and triggering a stock market crash. For investors, the message is clear: respect risk, avoid over-leverage, and remember that stability in financial markets is often temporary, especially when driven by global liquidity rather than solid fundamentals.

Impact of US Federal Reserve and Interest Rate DecisionsThe Indian Economy:
The monetary policy decisions of the United States Federal Reserve (commonly known as the Fed) have far-reaching consequences beyond the US economy. As the world’s most influential central bank, the Fed’s interest rate actions significantly affect global liquidity, capital flows, currency movements, commodity prices, and investor sentiment. For an emerging economy like India—deeply integrated into global trade and financial systems—changes in Fed rates play a crucial role in shaping economic growth, inflation dynamics, financial markets, and policy responses. Understanding this relationship is essential for policymakers, businesses, investors, and households.
1. The Federal Reserve and Its Global Influence
The Federal Reserve primarily adjusts interest rates to manage inflation, employment, and economic stability in the United States. However, because the US dollar is the world’s reserve currency and US financial markets dominate global capital flows, Fed rate decisions influence borrowing costs and investment decisions worldwide. When the Fed raises interest rates, global liquidity tends to tighten; when it cuts rates, liquidity expands. These shifts directly and indirectly affect emerging markets like India.
2. Capital Flows and Foreign Investment in India
One of the most immediate impacts of Fed rate changes on India is through foreign capital flows. When the Fed raises rates, US assets become more attractive due to higher yields and lower perceived risk. This often leads to Foreign Institutional Investors (FIIs) pulling money out of emerging markets, including India, and reallocating it to US bonds and equities. Such outflows can lead to volatility in Indian equity and debt markets.
Conversely, when the Fed pauses or cuts rates, global investors search for higher returns, making India an attractive destination due to its relatively strong growth prospects. This can result in increased foreign portfolio investment, boosting stock markets and improving liquidity conditions.
3. Impact on the Indian Rupee and Exchange Rates
Fed rate hikes typically strengthen the US dollar. A stronger dollar puts depreciation pressure on the Indian rupee. Rupee depreciation makes imports—especially crude oil, natural gas, and other commodities—more expensive, contributing to imported inflation. On the other hand, a weaker rupee can benefit exporters by making Indian goods more competitive globally.
When the Fed cuts rates, the dollar often weakens, which can support the rupee. A stable or appreciating rupee helps contain inflation and reduces the cost of imports, but it may slightly reduce export competitiveness. The Reserve Bank of India (RBI) closely monitors these movements and may intervene in forex markets to reduce excessive volatility.
4. Inflation Dynamics and Monetary Policy in India
Fed rate decisions influence global inflation trends and commodity prices, which directly affect India. Higher US interest rates often cool global demand, leading to softer commodity prices. For India, this can reduce inflationary pressures, particularly from oil and metals.
However, capital outflows and currency depreciation caused by Fed hikes can offset these benefits by increasing import costs. In such scenarios, the RBI faces a policy dilemma: whether to raise domestic interest rates to control inflation and stabilize the rupee or to prioritize growth by keeping rates accommodative.
When the Fed adopts an easing stance, global liquidity increases, often pushing commodity prices higher. While this supports global growth, it can raise inflation risks for India, forcing the RBI to act cautiously.
5. Impact on Indian Interest Rates and Borrowing Costs
Although the RBI sets interest rates based on domestic conditions, Fed actions indirectly influence Indian interest rates. Persistent Fed tightening can pressure the RBI to maintain relatively higher rates to prevent excessive capital outflows and currency instability. This leads to higher borrowing costs for Indian businesses and consumers, affecting investment, housing demand, and consumption.
In contrast, a dovish Fed provides the RBI with more room to cut rates or maintain an accommodative stance, supporting credit growth and economic expansion.
6. Effects on Indian Equity Markets
Indian stock markets are highly sensitive to global monetary conditions. Fed rate hikes generally lead to risk aversion, causing corrections in equities, especially in sectors dependent on foreign capital such as IT, banking, and real estate. Growth stocks often underperform during high interest rate cycles due to higher discount rates.
On the other hand, Fed rate cuts or expectations of easing usually fuel global equity rallies. Indian markets benefit from increased foreign inflows, improved liquidity, and positive sentiment, often leading to higher valuations.
7. Impact on Debt Markets and Government Borrowing
Fed tightening can raise global bond yields, influencing Indian government securities (G-Secs). Higher yields increase borrowing costs for the Indian government, potentially widening fiscal deficits. Corporate bond yields may also rise, making debt financing more expensive for companies.
When the Fed eases, global yields tend to soften, which can help lower Indian bond yields, ease government borrowing pressures, and support infrastructure and development spending.
8. Trade, Exports, and Global Demand
Fed rate decisions influence the pace of global economic growth. Aggressive rate hikes can slow down the US and global economy, reducing demand for Indian exports such as IT services, pharmaceuticals, textiles, and engineering goods. This can negatively impact India’s trade balance and corporate earnings.
A dovish Fed stance, encouraging global growth, can boost export demand and improve India’s external sector performance.
9. RBI’s Strategic Response to Fed Actions
The RBI does not mechanically follow the Fed but considers its actions while formulating policy. India’s strong foreign exchange reserves, improving macroeconomic fundamentals, and domestic demand provide some insulation. The RBI uses a combination of interest rate adjustments, liquidity management, and forex interventions to mitigate the spillover effects of Fed policies.
10. Long-Term Perspective for India
In the long run, India’s economic trajectory depends more on domestic reforms, productivity growth, fiscal discipline, and structural factors than on external monetary cycles. However, Fed rate decisions remain an important external variable that can influence short- to medium-term volatility.
Conclusion
The US Federal Reserve’s interest rate decisions have a profound and multi-dimensional impact on the Indian economy. From capital flows and currency movements to inflation, interest rates, and market sentiment, Fed actions shape India’s macroeconomic environment. While India has built resilience through strong reserves and prudent policymaking, it cannot remain completely immune to global monetary shifts. A balanced and flexible policy approach by the RBI, combined with structural economic strength, is key to navigating the challenges and opportunities arising from changing Fed rate cycles.

Indian Stock Market: The Pulse of India’s Economic GrowthStructure and Foundation of the Indian Stock Market
The Indian stock market primarily operates through two major exchanges: the Bombay Stock Exchange (BSE) and the National Stock Exchange (NSE). The BSE, established in 1875, is Asia’s oldest stock exchange, while the NSE, launched in 1992, revolutionized trading with its fully electronic platform. Together, these exchanges ensure transparency, liquidity, and efficient price discovery for thousands of listed companies across sectors.
At the heart of the market lies the Securities and Exchange Board of India (SEBI), the regulatory authority responsible for protecting investor interests and maintaining fair market practices. SEBI’s regulatory framework has strengthened corporate governance, improved disclosure standards, and enhanced market integrity, making the Indian stock market more credible and attractive to domestic as well as global investors.
Key Indices and Market Representation
Market indices serve as barometers of overall market performance. The BSE Sensex, comprising 30 blue-chip companies, and the NSE Nifty 50, representing 50 of the largest and most liquid stocks, are the most widely tracked indices in India. These indices reflect the collective performance of key sectors such as banking, IT, pharmaceuticals, energy, FMCG, and automobiles.
Beyond these benchmarks, sectoral and thematic indices allow investors to gauge performance in specific industries or investment themes. This diversity enables market participants to align their investment strategies with macroeconomic trends and sector-specific opportunities.
Participants in the Indian Stock Market
The Indian stock market is driven by a diverse set of participants, each playing a distinct role. Retail investors form the backbone of market liquidity, increasingly participating through online trading platforms and mutual funds. Institutional investors, including domestic institutions like mutual funds and insurance companies, provide long-term stability to the market.
Foreign Institutional Investors (FIIs), now referred to as Foreign Portfolio Investors (FPIs), significantly influence market trends through capital inflows and outflows. Their participation links the Indian market to global economic developments, making it responsive to international events such as interest rate changes, geopolitical tensions, and global growth cycles.
Role of Technology and Digital Transformation
Technology has been a game changer for the Indian stock market. The introduction of electronic trading, online brokerage platforms, and mobile trading apps has democratized access to markets. Investors can now trade in real time, analyze data instantly, and manage portfolios with greater efficiency.
Advanced tools such as algorithmic trading, artificial intelligence, and big data analytics have further transformed market operations. These innovations have improved execution speed, reduced transaction costs, and enhanced market depth, making the Indian stock market more competitive on a global scale.
Economic Linkages and Market Drivers
The Indian stock market is closely intertwined with the country’s economic fundamentals. Factors such as GDP growth, inflation, interest rates, fiscal policies, and corporate earnings directly impact market sentiment. Government reforms, infrastructure spending, and policy initiatives like “Make in India” and digitalization efforts often create new investment opportunities.
Global factors also play a crucial role. Movements in crude oil prices, currency exchange rates, and global equity markets influence Indian stocks, particularly in export-oriented and import-dependent sectors. As India integrates further with the global economy, these linkages continue to strengthen.
Investment Opportunities and Wealth Creation
One of the most compelling aspects of the Indian stock market is its potential for long-term wealth creation. Historically, equities have outperformed most other asset classes over extended periods, rewarding patient investors. The rise of systematic investment plans (SIPs) in mutual funds has encouraged disciplined investing, allowing individuals to participate in equity markets with lower risk and greater consistency.
The growing startup ecosystem, frequent initial public offerings (IPOs), and expansion of small and mid-cap companies provide investors with opportunities across different risk-return profiles. This breadth makes the Indian stock market suitable for both conservative and aggressive investors.
Risks, Volatility, and Investor Awareness
Despite its growth potential, the Indian stock market is not without risks. Market volatility, driven by economic uncertainties, policy changes, and global events, can lead to short-term fluctuations. Behavioral biases, lack of financial literacy, and speculative trading can also expose investors to losses.
However, increased investor education, regulatory safeguards, and the availability of diversified investment products have helped mitigate these risks. A focus on long-term fundamentals, risk management, and asset allocation remains essential for sustainable investing.
Future Outlook of the Indian Stock Market
The future of the Indian stock market appears promising, supported by favorable demographics, rising income levels, and a growing middle class. Continued reforms, technological advancements, and increased participation from both domestic and global investors are likely to deepen market maturity.
As India aspires to become a major global economic powerhouse, its stock market will play a crucial role in channeling capital, fostering innovation, and supporting sustainable growth. For investors, the Indian stock market offers not just opportunities for financial returns but also a chance to participate in the nation’s economic journey.
Conclusion
In essence, the Indian stock market is more than a platform for buying and selling shares—it is a reflection of India’s economic vitality and future potential. Its evolution, driven by regulation, technology, and investor participation, underscores its importance in the global financial landscape. For those who understand its dynamics and invest with discipline, the Indian stock market remains a powerful tool for wealth creation and economic progress.

Divergence Secrets Pros of Option Trading
✔ Low capital requirement
✔ High leverage
✔ Risk-defined trades
✔ Can profit in any market condition
✔ Wide variety of strategies
✔ Best tool for hedging
✔ High return potential
Cons of Option Trading
✘ Complexity for beginners
✘ Time decay risk
✘ Requires knowledge of volatility
✘ High risk for option sellers
✘ Emotional pressure
✘ Requires active monitoring

Part 2 Supoort and Resistance Why Traders Use Options
Options are powerful because they offer flexibility.
Traders use options for three major purposes:
1. Hedging
To protect portfolios from loss.
Example:
If you own stocks worth ₹5 lakhs, buying Put Options protects you during a crash.
2. Speculation
Traders use options to bet on market direction:
Buy calls to bet bullish
Buy puts to bet bearish
Sell options to bet sideways
3. Income Generation
Option sellers (writers) earn consistent premium income.
This is why big institutions prefer selling options rather than buying.

Part 2 Intraday Master Class How Option Prices Are Determined
The price of an option (premium) is influenced by several factors. The most important include:
1. Underlying Price
As price moves up:
Calls become expensive
Puts become cheaper
As price moves down:
Puts become expensive
Calls become cheaper
2. Volatility
Volatility (IV – Implied Volatility) has a huge impact.
High IV → Expensive premiums
Low IV → Cheaper premiums
IV reflects expected future movement.
3. Time to Expiry
Options decay faster as expiry approaches.
This is called Theta Decay.
Weekly options decay rapidly (especially last 3 days).
4. Interest Rates & Dividends
These influence option pricing slightly but are more relevant for institutional traders.

India’s Market Surge: The Rise of a New Economic Powerhouse1. Introduction: Understanding India’s Market Surge
India’s financial markets have witnessed a remarkable surge over the past few years, marked by record highs in equity indices, rising investor participation, and strong capital inflows.
This surge is not limited to stock prices alone; it reflects deeper economic strength, structural reforms, and growing global confidence in India.
India is increasingly seen as one of the most attractive long-term investment destinations among emerging and developed markets.
2. Strong Economic Growth as the Foundation
India remains one of the fastest-growing major economies globally, consistently outperforming peers.
Robust GDP growth is driven by domestic consumption, infrastructure spending, manufacturing expansion, and services exports.
A young population and rising income levels continue to fuel demand across sectors such as FMCG, banking, real estate, and automobiles.
3. Demographic Advantage and Rising Middle Class
India’s demographic profile is a major growth engine, with a large working-age population.
Rapid urbanization and expansion of the middle class have increased savings, investments, and consumption.
Higher financial literacy has encouraged retail investors to actively participate in equity markets through direct stocks and mutual funds.
4. Structural Reforms Strengthening Markets
Government-led reforms such as GST, Insolvency and Bankruptcy Code (IBC), and digital taxation have improved transparency and efficiency.
Simplification of business regulations has enhanced the ease of doing business.
These reforms have increased corporate profitability and reduced systemic risks, positively impacting market valuations.
5. Infrastructure Boom Driving Capital Formation
Massive investments in roads, railways, ports, airports, and power infrastructure have created strong multiplier effects.
Infrastructure spending boosts employment, supports allied industries like cement and steel, and strengthens long-term productivity.
Markets reward this capital formation cycle with higher valuations in core and industrial sectors.
6. Manufacturing Push and “Make in India”
Initiatives like Production-Linked Incentive (PLI) schemes have accelerated domestic manufacturing.
Sectors such as electronics, defense, pharmaceuticals, and renewable energy have attracted large investments.
India’s ambition to become a global manufacturing hub has strengthened investor confidence in long-term growth prospects.
7. Digital Revolution and Technology Adoption
India’s digital infrastructure, including UPI, Aadhaar, and digital public platforms, has transformed financial inclusion.
Fintech, e-commerce, SaaS, and IT services companies have benefited from rapid digital adoption.
Technology-led efficiency has reduced costs and increased scalability for businesses, positively impacting market performance.
8. Strong Corporate Earnings Growth
Indian corporates have shown consistent earnings growth supported by cost optimization and revenue expansion.
Balance sheets have improved due to deleveraging and better capital allocation.
Higher profitability and return ratios have justified premium valuations in many sectors.
9. Banking and Financial Sector Revival
The banking sector has emerged stronger after years of balance sheet stress.
Non-performing assets (NPAs) have declined, credit growth has accelerated, and profitability has improved.
A healthy financial system acts as the backbone of the market surge by efficiently channeling capital to productive sectors.
10. Rising Retail Investor Participation
The surge in Demat accounts and systematic investment plans (SIPs) has transformed market dynamics.
Domestic investors now provide stability during periods of foreign investor volatility.
This shift has reduced dependence on external capital and strengthened market resilience.
11. Foreign Investment and Global Interest
Global investors view India as a strategic alternative in the China-plus-one strategy.
Stable political leadership and policy continuity have enhanced investor confidence.
Foreign institutional investors (FIIs) continue to allocate capital to Indian equities for long-term growth exposure.
12. SME, IPO, and Startup Ecosystem Growth
India’s IPO market has expanded significantly, including strong participation from SMEs.
A vibrant startup ecosystem has encouraged innovation, job creation, and wealth generation.
Capital markets have become a key funding source for emerging businesses, deepening market breadth.
13. Sectoral Leadership in the Market Surge
IT services, pharmaceuticals, capital goods, infrastructure, defense, and renewable energy have led market rallies.
Consumption-driven sectors such as FMCG, retail, and automobiles continue to provide stability.
Sectoral rotation ensures sustained momentum rather than a narrow market rally.
14. Policy Stability and Governance
Consistent policy direction and long-term planning have reduced uncertainty for investors.
Fiscal discipline and inflation management have improved macroeconomic stability.
Markets reward predictability and governance with sustained investor trust.
15. Inflation and Interest Rate Management
Compared to global peers, India has managed inflation relatively well.
A balanced monetary policy approach supports growth while maintaining price stability.
Stable interest rates encourage investment in equities over traditional savings instruments.
16. Market Valuations and Risk Awareness
While the market surge reflects strong fundamentals, valuations in certain pockets are stretched.
Investors are becoming more selective, focusing on earnings quality and balance sheet strength.
This maturity indicates a healthier market environment compared to speculative rallies.
17. India’s Growing Role in Global Indices
India’s increasing weight in global equity indices has attracted passive investment flows.
Inclusion of Indian bonds in global indices is expected to further boost capital inflows.
This integration strengthens India’s position in global financial markets.
18. Long-Term Wealth Creation Opportunity
India’s market surge is not just a short-term phenomenon but part of a long-term structural growth story.
Equities remain one of the most effective tools for wealth creation in a growing economy.
Long-term investors benefit from compounding driven by economic expansion and innovation.
19. Challenges and Potential Risks
Global economic slowdowns, geopolitical tensions, and commodity price volatility pose risks.
Domestic challenges such as fiscal pressures and uneven growth across sectors require monitoring.
However, strong fundamentals provide a cushion against short-term shocks.
20. Conclusion: The Road Ahead
India’s market surge is a reflection of economic strength, reform-driven growth, and rising investor confidence.
With strong demographics, digital leadership, and manufacturing momentum, India is well-positioned for sustained growth.
While short-term volatility is inevitable, the long-term outlook remains positive, making India a compelling investment destination in the global landscape.

Mastering High-Speed Profits in the Stock MarketIntraday Scalping:
Intraday scalping is one of the most fast-paced and skill-intensive trading strategies in financial markets. It focuses on capturing small price movements multiple times within a single trading day, often within minutes or even seconds. Unlike swing trading or positional investing, scalping does not rely on large trends. Instead, it exploits micro-price fluctuations, liquidity, and volatility to generate consistent profits through volume and precision.
Below is a detailed 1000-word explanation of intraday scalping, covering its philosophy, tools, strategies, risks, and mindset.
1. What Is Intraday Scalping?
Intraday scalping is a short-term trading technique where traders:
Enter and exit trades within the same trading session
Hold positions for a few seconds to a few minutes
Target small price movements
Execute multiple trades per day
The core idea is simple: small profits × high frequency = meaningful returns.
Scalpers do not carry positions overnight, avoiding gap risk, global news shocks, and overnight volatility.
2. Why Scalping Works in Intraday Markets
Scalping thrives because markets constantly fluctuate due to:
Order flow imbalance
High liquidity in index stocks and derivatives
Algorithmic trading activity
Institutional participation
News-driven momentum bursts
In highly liquid instruments, prices rarely stay still. Scalpers capitalize on these continuous movements with disciplined execution.
3. Key Characteristics of a Scalping Strategy
Intraday scalping has distinct features:
Very Short Timeframes
Common charts include 1-minute, 2-minute, and 5-minute
High Trade Frequency
10–50 trades per session is common for active scalpers
Small Stop Loss & Target
Typical risk-reward ranges from 1:1 to 1:1.5
High Accuracy Over High Reward
Win rate matters more than big profits per trade
Strict Discipline
No emotional trading, no hope-based holding
4. Instruments Best Suited for Scalping
Not all instruments are suitable for scalping. The best ones offer high liquidity and tight spreads:
Index futures (NIFTY, BANK NIFTY, FINNIFTY)
Large-cap stocks with high volume
Highly liquid options (near-ATM strikes)
Forex major pairs (for global traders)
Index ETFs
Illiquid stocks are avoided due to slippage and erratic price behavior.
5. Technical Tools Used in Intraday Scalping
Scalpers rely heavily on technical analysis and market structure:
A. Moving Averages
9 EMA, 20 EMA, VWAP
Used for trend direction and dynamic support/resistance
B. VWAP (Volume Weighted Average Price)
A critical tool for intraday bias
Above VWAP = bullish sentiment
Below VWAP = bearish sentiment
C. Support & Resistance
Previous day high/low
Opening range
Intraday demand and supply zones
D. Momentum Indicators
RSI (short periods like 7 or 9)
Stochastic Oscillator
MACD histogram for momentum bursts
E. Volume & Price Action
Volume spikes confirm breakout validity
Candlestick patterns like engulfing, pin bars, and inside bars
6. Popular Intraday Scalping Strategies
1. VWAP Rejection Strategy
Trades are taken when price rejects VWAP with strong volume confirmation.
2. Opening Range Breakout (ORB) Scalping
The first 5–15 minutes define a range. Breakout with volume leads to quick scalps.
3. Pullback Scalping
Trade in the direction of the main trend after a shallow retracement to EMA or VWAP.
4. Momentum Burst Scalping
Quick entries during sudden volume and price expansion caused by news or institutional orders.
5. Range Scalping
Buying near support and selling near resistance in sideways markets.
7. Risk Management in Scalping
Risk control is the foundation of successful scalping:
Fixed stop loss for every trade
Risk only 0.25%–0.5% of capital per trade
Daily maximum loss limit
Stop trading after consecutive losses
Never average losing trades
In scalping, capital protection is more important than profit chasing.
8. Psychology of a Successful Scalper
Scalping is mentally demanding. Successful scalpers develop:
Emotional neutrality
Ability to accept small losses quickly
High focus and alertness
Discipline to follow rules strictly
Detachment from individual trade outcomes
Overtrading, revenge trading, and hesitation are the biggest enemies of scalpers.
9. Technology & Execution Speed
Because scalping depends on precision:
Fast internet connection is essential
Reliable trading platform
Low brokerage and transaction costs
Quick order execution
Direct market access where possible
Even a small delay can turn a profitable trade into a loss.
10. Advantages of Intraday Scalping
No overnight risk
Quick feedback and learning curve
Works in both trending and ranging markets
Capital efficiency
Clear entry and exit rules
11. Challenges and Risks
High stress and screen time
Requires constant attention
Transaction costs can eat profits
Emotional fatigue
Not suitable for part-time traders
Scalping is not a shortcut to quick money—it is a professional-level trading approach.
12. Who Should Choose Scalping?
Intraday scalping is ideal for traders who:
Can monitor markets actively
Have strong discipline
Enjoy fast decision-making
Are comfortable with frequent trades
Prefer short exposure durations
It is not suitable for investors or traders who dislike screen-based work.
Conclusion
Intraday scalping is a precision-driven, high-discipline trading methodology designed for traders who thrive in fast environments. Success in scalping does not come from prediction, but from probability, execution, and consistency. When combined with proper risk management, sound psychology, and robust technical frameworks, scalping can become a powerful tool for generating steady intraday income.

Stock Market LearningA Complete Guide for Retail Investors, HNIs, FIIs, DIIs & Institutional Participants
The stock market is a dynamic ecosystem where different types of investors participate with distinct objectives, capital sizes, risk appetites, and strategies. For anyone serious about stock market learning—whether a beginner retail investor or an aspiring professional—understanding how Retail Investors, High Net-Worth Individuals (HNIs), Foreign Institutional Investors (FIIs), Domestic Institutional Investors (DIIs), and large Institutions operate is essential. This knowledge not only builds confidence but also helps investors align their decisions with market realities rather than emotions or rumors.
1. Understanding the Stock Market Learning Process
Stock market learning is not just about buying and selling shares. It involves:
Understanding market structure
Studying price action and volume
Learning fundamental and technical analysis
Observing institutional behavior
Managing risk, psychology, and discipline
Every participant leaves a footprint in the market. Learning to identify and interpret these footprints is what separates informed investors from speculative traders.
2. Retail Investors: The Foundation of the Market
Retail investors are individual participants who invest relatively smaller amounts. They form the largest group in terms of numbers and play a crucial role in market liquidity.
Key Characteristics:
Limited capital compared to institutions
Often influenced by news, social media, and tips
Usually focus on short- to medium-term gains
Increasingly active due to easy access via online platforms
Learning Focus for Retail Investors:
Basics of equity, derivatives, and mutual funds
Technical indicators like support, resistance, RSI, and moving averages
Fundamental analysis of company balance sheets, earnings, and growth potential
Risk management techniques such as stop-loss and position sizing
Retail investors must understand that markets are not always rational in the short term. Education helps them avoid panic selling, overtrading, and emotional decisions.
3. High Net-Worth Individuals (HNIs): Strategic Market Movers
HNIs bridge the gap between retail and institutional investors. They invest large sums and often have access to professional advisory services.
Key Characteristics:
Significant capital deployment
Ability to influence mid-cap and small-cap stocks
Longer investment horizon than retail investors
Use of structured products, PMS, and alternative investments
Learning Focus for HNIs:
Portfolio diversification across asset classes
Sector rotation strategies
Advanced derivatives and hedging techniques
Understanding liquidity risks in smaller stocks
HNIs focus more on capital preservation along with growth. Learning helps them reduce concentration risk and avoid becoming trapped in illiquid investments.
4. Foreign Institutional Investors (FIIs): Global Capital Drivers
FIIs are large overseas funds, hedge funds, pension funds, and asset managers investing in domestic markets. Their flows can significantly impact market trends.
Key Characteristics:
Massive capital inflows and outflows
Sensitive to global interest rates, currency movements, and geopolitics
Often drive large-cap index movements
Highly data-driven and research-oriented
Learning Focus for Tracking FIIs:
Understanding FII flow data and its impact on indices
Correlation between global markets and domestic equities
Role of currency exchange rates
Impact of global monetary policy
For retail and HNI investors, learning to track FII behavior provides valuable insights into broader market direction.
5. Domestic Institutional Investors (DIIs): Market Stabilizers
DIIs include mutual funds, insurance companies, pension funds, and domestic financial institutions. They often act as counterbalances to FIIs.
Key Characteristics:
Long-term investment outlook
Consistent inflows through SIPs and insurance premiums
Strong influence during market corrections
Preference for fundamentally strong companies
Learning Focus for Understanding DIIs:
Mutual fund portfolio disclosures
SIP flow trends
Sector allocation strategies
Long-term compounding principles
DIIs play a crucial role in stabilizing markets during periods of heavy FII selling, making them important players to monitor.
6. Institutional Investors: The Smart Money
Institutional investors include large asset management firms, hedge funds, sovereign wealth funds, and proprietary trading desks.
Key Characteristics:
Access to advanced analytics and research
Large block trades and algorithmic execution
Focus on risk-adjusted returns
Strong emphasis on compliance and governance
Learning Focus for Institutional-Level Thinking:
Market microstructure and liquidity
Volume profile and order flow analysis
Risk modeling and drawdown control
Macro-economic and sectoral analysis
Retail investors can significantly improve results by learning how institutions think, rather than trying to compete with them.
7. How Market Learning Helps Align with Big Players
One of the biggest mistakes retail participants make is trading against institutional trends. Stock market learning teaches:
How accumulation and distribution phases work
Why breakouts with volume matter
How institutions enter positions gradually
Why patience often outperforms aggressive trading
By aligning with institutional behavior, investors improve probability and consistency.
8. Importance of Risk Management Across All Categories
Regardless of investor type, risk management remains central:
Retail investors focus on capital protection
HNIs manage portfolio-level risk
FIIs hedge currency and macro risks
DIIs balance long-term commitments
Institutions use quantitative risk models
Learning proper risk management prevents catastrophic losses and ensures longevity in the market.
9. Psychology and Discipline: The Hidden Curriculum
Stock market learning is incomplete without mastering psychology:
Controlling fear during corrections
Avoiding greed during rallies
Sticking to predefined strategies
Accepting losses as part of the process
Professional investors survive because of discipline, not prediction.
10. Conclusion: Stock Market Learning as a Lifelong Journey
The stock market is a shared platform where retail investors, HNIs, FIIs, DIIs, and institutions interact daily. Each group brings unique strengths and influences price discovery in its own way. True stock market learning lies in understanding these roles, respecting market structure, and continuously upgrading knowledge.
For retail investors, learning builds confidence. For HNIs, it ensures strategic growth. For institutions, it maintains efficiency and discipline. Those who commit to continuous learning are the ones who not only survive but thrive across market cycles.

Unlock Market Rotation: Turn Shifting Trends into Powerful ProfiStay Ahead of Capital Flow & Capture the Next Big Opportunity
What Is Market Rotation?
Market rotation refers to the movement of capital from one sector, asset class, or investment theme to another as economic conditions, interest rates, inflation, and growth expectations change. Understanding this shift allows investors to align portfolios with where money is flowing next, not where it has already been.
Why Market Rotation Matters More Than Ever
In today’s fast-moving global markets, leadership changes quickly. Sectors that outperform in one phase of the cycle can underperform in the next. Investors who unlock market rotation gain a powerful edge by identifying early signals and positioning before the crowd reacts.
Economic Cycles Drive Rotation
Different sectors perform best at different stages of the economic cycle. Early recovery favors cyclicals, mid-cycle supports growth sectors, late-cycle shifts toward defensives, and slowdown phases reward capital preservation strategies. Market rotation is the bridge between macro trends and smart allocation.
Interest Rates as a Key Trigger
Rising interest rates often rotate money away from high-growth, high-valuation stocks toward value, financials, and commodities. Falling rates usually support technology, consumption, and growth-oriented sectors. Tracking rate expectations is critical to anticipating rotation.
Inflation and Sector Leadership
Inflation reshapes winners and losers. High inflation typically benefits energy, metals, and real assets, while compressing margins in rate-sensitive sectors. Unlocking rotation means understanding how inflation impacts pricing power across industries.
Institutional Money Leaves Clues
FIIs, DIIs, and large institutional players move capital systematically. Volume expansion, relative strength, and sectoral index breakouts often signal early institutional rotation. Smart investors learn to read these footprints rather than react to headlines.
Relative Strength Is the Core Tool
Market rotation is best identified through relative performance. Comparing sectors against benchmark indices reveals which areas are gaining strength and which are losing momentum. Sustained outperformance is a strong sign of rotation in progress.
From Sector to Stock-Level Rotation
Rotation doesn’t stop at sectors—it flows into sub-sectors and then into specific stocks. Leaders within a strong sector usually outperform peers. Unlocking market rotation means narrowing focus from macro to micro with precision.
Risk Management Through Rotation
Instead of exiting markets entirely, rotation allows investors to shift risk, not abandon opportunity. When one theme weakens, another strengthens. This approach smooths volatility and improves long-term consistency.
Psychology of Market Rotation
Most investors chase past performance. Market rotation rewards those who act before trends become obvious. Discipline, data-driven decisions, and patience are essential to avoid emotional investing.
Technical Indicators That Signal Rotation
Moving averages, sectoral relative strength lines, momentum oscillators, and trend confirmation tools help validate rotation. Technical confirmation ensures that allocation decisions are backed by price action, not assumptions.
Macro Events Accelerate Rotation
Central bank decisions, geopolitical shifts, policy reforms, and global growth changes can rapidly accelerate capital movement. Prepared investors use these events as catalysts rather than shocks.
Short-Term vs Long-Term Rotation
Rotation can be tactical (weeks to months) or strategic (quarters to years). Traders benefit from short-term sector momentum, while investors focus on structural shifts like digitization, energy transition, or infrastructure growth.
Equity, Debt, and Alternative Rotation
Rotation is not limited to equities. Capital also moves between stocks, bonds, commodities, and alternative assets. A holistic approach captures opportunities across asset classes.
Market Rotation in Indian Markets
In India, rotation often reflects domestic growth cycles, government policies, earnings visibility, and global capital flows. Understanding local drivers adds a significant advantage to portfolio positioning.
Avoiding Overcrowded Trades
When a sector becomes over-owned, upside potential reduces. Unlocking market rotation helps investors exit crowded themes early and enter emerging ones before valuations expand.
Consistency Beats Prediction
Market rotation is not about predicting tops or bottoms. It is about consistently reallocating capital toward strength and away from weakness based on objective signals.
Portfolio Rebalancing with Purpose
Regular rebalancing aligned with rotation trends keeps portfolios dynamic. This reduces drawdowns and improves risk-adjusted returns over time.
Long-Term Wealth Creation Advantage
Investors who master market rotation compound gains by riding multiple leadership cycles instead of staying stuck in one theme. This adaptability is key to sustainable wealth creation.
Unlock the Edge
Market rotation is the silent force behind every major rally and correction. Those who understand it move ahead of trends, protect capital during uncertainty, and capture opportunity when it matters most.
Unlock Market Rotation is not just a strategy—it’s a mindset. By tracking capital flow, aligning with economic cycles, and acting decisively, investors can transform uncertainty into opportunity and stay one step ahead of the market.

Best Knowledge of Chart Patterns CHART PATTERNS
Chart patterns are visual formations that appear on price charts. These patterns are formed when price creates recognizable shapes due to repeated market behavior. Chart patterns reveal market psychology, liquidity placement, stop-loss positions, and future direction of price.
1. Reversal Patterns
These patterns signal that the ongoing trend is likely coming to an end. A reversal pattern at the top of an uptrend signals bearish move; at the bottom of a downtrend, it signals bullish move.
Examples:
Head and Shoulders
Inverse Head and Shoulders
Double Top
Double Bottom
Rounding Top
Rounding Bottom
Falling Wedge
Rising Wedge
2. Continuation Patterns
These patterns show that the trend is taking a pause before continuing in the same direction.
Examples:
Bullish Flag
Bearish Flag
Bullish Pennant
Bearish Pennant
Ascending Triangle
Descending Triangle
Symmetrical Triangle
Cup and Handle
3. Bilateral Patterns
These patterns signal indecision — price can break either up or down.
Examples:
Symmetrical Triangle
Diamond Pattern

ACI 1 Day Time Frame 📌 Current Price (Approx)
₹513 – ₹521 range (latest closing/trading price).
🌀 Daily Pivot & Key Levels
(Levels updated using standard pivot point calculations)
🔹 Pivot Levels
Pivot (Daily): ~₹538.93
Central Pivot (CPR): ~₹538.93 (Mid) / Top ~₹541.72 / Bottom ~₹536.14
📈 Resistance Levels
R1: ₹547 – ₹548
R2: ₹561 – ₹562
R3: ₹570 – ₹571
These are potential upside hurdles where price may stall or reverse.
📉 Support Levels
S1: ₹525 – ₹526
S2: ₹516 – ₹518
S3: ₹502 – ₹505
These are short-term supports for price to potentially bounce from.
📊 Intraday Context
Current price is trading below the main pivot (~₹538.9), indicating the short-term bias is bearish to neutral today.
A break back above Pivot → R1 (~₹547-₹548) would signal stronger buyers entering.
If price drops below S2 / S3 (~₹516 / ₹502) with momentum, it could signal further downside pressure intraday.
📈 Moving Averages & Trend Signals (from ET Money)
Short-term averages (20 DMA, 50 DMA) are above the current price — suggesting weak short-term momentum.
⚠️ Quick Technical Summary
Short-Term (Daily)
Bias: Neutral-bearish (below pivot).
Bullish confirmation: Price sustaining above ₹547-₹548.
Bearish continuation: Breakdown below ₹502 with increasing volume.

POONAWALLA 1 Day Time Frame 📈 Poonawalla Fincorp Ltd — Daily Timeframe Levels
📌 Current Reference Price (approx)
Current price ~ ₹462–₹470 range on NSE today (recent live data)
🧠 How to Use These Levels Today
Bullish scenario (1D view):
Price holds above Pivot zone (~₹462–₹475).
Move above R1 (~₹468–₹480) then R2 (~₹477–₹485) with volume suggests an intraday upside continuation.
Bearish scenario (1D view):
Price breaks below S1 (~₹454) and stays below pivot — bearish pressure likely.
Downside acceleration if below S2 (~₹447).
Neutral/Range:
Choppy sideways if price oscillates around pivot without clear breakout.
📊 Indicator Context (Short-Term)
Short-term moving averages (e.g., 20/50/100) are clustered, indicating a mixed near-term trend (neither strongly trending up nor down).
Recent intraday pivot oscillators suggest strength near higher supports.

Impact on Global TradeEconomic Growth and Development
One of the most significant impacts of global trade is its contribution to economic growth. Trade allows countries to specialize in the production of goods and services in which they have a comparative advantage. This specialization increases efficiency, productivity, and overall output. Developing countries, in particular, benefit from access to larger international markets, enabling them to grow industries, attract foreign investment, and integrate into global value chains. For many emerging economies, export-led growth has been a key driver of poverty reduction and improved living standards.
At the same time, advanced economies benefit from global trade by gaining access to cheaper raw materials, intermediate goods, and consumer products. This helps control costs, increase competitiveness, and enhance consumer welfare through lower prices and greater product variety.
Employment and Labor Markets
Global trade has a mixed impact on employment. On one hand, it creates millions of jobs worldwide in manufacturing, services, logistics, finance, and technology. Export-oriented industries often experience job growth as demand from international markets increases. Service sectors such as IT, finance, consulting, and outsourcing have expanded rapidly due to globalization and digital trade.
On the other hand, global trade can lead to job displacement, especially in industries that face strong foreign competition. Workers in less competitive sectors may experience job losses or wage pressure. This has increased the need for reskilling, upskilling, and stronger social safety nets. The overall impact on employment depends on how well countries manage trade transitions through education, labor reforms, and inclusive economic policies.
Global Supply Chains and Efficiency
Modern global trade is deeply interconnected through global supply chains. A single product may involve raw materials from one country, manufacturing in another, and assembly and distribution across multiple regions. This system has significantly increased efficiency, reduced production costs, and accelerated innovation.
However, recent global disruptions—such as pandemics, geopolitical conflicts, and trade restrictions—have highlighted the vulnerabilities of highly integrated supply chains. As a result, many countries and companies are rethinking trade strategies, focusing on supply chain diversification, regional trade, near-shoring, and resilience rather than purely cost-based efficiency.
Impact of Technology and Digital Trade
Technology has transformed global trade more than any other factor in recent decades. Digital platforms, e-commerce, artificial intelligence, blockchain, and advanced logistics have reduced trade barriers and transaction costs. Small and medium-sized enterprises (SMEs) can now access global markets that were once dominated by large multinational corporations.
Digital trade has expanded services exports, including software, digital content, online education, and financial services. At the same time, it has raised new challenges related to data privacy, cybersecurity, digital taxation, and regulatory harmonization. Countries that invest in digital infrastructure and skills are better positioned to benefit from this transformation.
Trade Policies and Protectionism
Trade policies play a crucial role in shaping global trade flows. Free trade agreements, regional trade blocs, and multilateral institutions have historically promoted trade liberalization, reducing tariffs and non-tariff barriers. This has encouraged cross-border investment and economic integration.
However, rising protectionism, trade wars, and economic nationalism have altered the global trade landscape. Tariffs, sanctions, export controls, and regulatory barriers can disrupt trade flows, increase costs, and create uncertainty for businesses. While some protectionist measures aim to protect domestic industries or national security, excessive restrictions can slow global economic growth and strain international relationships.
Geopolitical and Strategic Impacts
Global trade is increasingly influenced by geopolitics. Strategic competition between major economies affects trade policies, technology transfer, energy markets, and supply chains. Trade is no longer purely an economic activity; it is also a strategic tool used to gain influence and reduce dependency on rivals.
This shift has led to the fragmentation of global trade into regional and strategic blocs. Countries are prioritizing trade partnerships based on political alignment and strategic interests, which may reshape long-term global trade patterns and reduce the efficiency of the global trading system.
Impact on Inflation and Consumer Prices
Trade has a direct impact on inflation and consumer prices. Open trade generally lowers prices by increasing competition and allowing access to cheaper imports. Consumers benefit from a wider range of affordable products, improving purchasing power and living standards.
Conversely, trade disruptions, tariffs, and supply chain shocks can increase costs and contribute to inflation. Rising transportation costs, energy prices, and trade restrictions can quickly translate into higher consumer prices, affecting households and businesses alike.
Environmental and Sustainability Considerations
Global trade has both positive and negative environmental impacts. On one side, it enables the global diffusion of green technologies, renewable energy equipment, and sustainable practices. International cooperation through trade can support climate goals and environmental innovation.
On the other side, increased trade can lead to higher carbon emissions, resource depletion, and environmental degradation if not properly regulated. As a result, sustainability is becoming a central theme in global trade, with growing emphasis on carbon pricing, green trade policies, ESG standards, and sustainable supply chains.
Future Outlook of Global Trade
The future of global trade will be shaped by a balance between globalization and localization. While complete de-globalization is unlikely, trade patterns are expected to become more diversified, digital, and sustainability-focused. Regional trade agreements, technological innovation, and resilient supply chains will play a larger role.
Countries that adapt to these changes by investing in technology, skills, infrastructure, and inclusive trade policies will benefit the most. Global trade will continue to be a critical driver of economic progress, but its impact will depend on how well the world manages risks, inequalities, and global cooperation.
Conclusion
The impact on global trade is profound and far-reaching, influencing economic growth, employment, innovation, geopolitics, and sustainability. While global trade has delivered immense benefits, it also presents challenges that require careful policy management. In an increasingly interconnected yet uncertain world, the future success of global trade will depend on resilience, adaptability, and international collaboration.

Best Trading Strategies: A Guide for Consistent Market SuccessTrading in financial markets—whether stocks, forex, commodities, or cryptocurrencies—offers significant opportunities, but it also involves substantial risk. Success in trading is not about luck or prediction alone; it is about applying the right strategies with discipline, proper risk management, and a clear understanding of market behavior. The “best” trading strategies are not universal—each trader must align strategies with their capital, risk tolerance, time horizon, and psychological makeup. However, some proven strategies have stood the test of time and are widely used by professional and retail traders alike. This guide explores the best trading strategies in detail, explaining how they work, when to use them, and why they matter.
1. Trend Following Strategy
Trend following is one of the most popular and effective trading strategies. The core idea is simple: trade in the direction of the prevailing market trend. Markets often move in sustained trends due to economic cycles, institutional participation, and investor sentiment.
In an uptrend, traders look for buying opportunities (higher highs and higher lows), while in a downtrend, they look for selling opportunities (lower highs and lower lows). Tools such as moving averages, trendlines, and indicators like the Average Directional Index (ADX) help identify and confirm trends.
Why it works: Trends tend to persist longer than expected, especially when driven by strong fundamentals or institutional money. Trend following reduces the need to predict tops and bottoms and instead focuses on capturing the middle portion of a move.
Best for: Swing traders and position traders with patience and discipline.
2. Breakout Trading Strategy
Breakout trading involves entering a trade when the price breaks above a resistance level or below a support level, often accompanied by high volume. Consolidation phases typically precede strong directional moves, and breakouts aim to capture these expansions in volatility.
Traders identify key levels using chart patterns such as rectangles, triangles, flags, or ranges. Once price breaks and sustains beyond these levels, trades are executed in the breakout direction.
Why it works: Breakouts often signal a shift in supply and demand. When resistance or support is broken, it can trigger stop-loss orders and fresh entries, accelerating price movement.
Best for: Intraday traders and swing traders who thrive in volatile conditions.
3. Momentum Trading Strategy
Momentum trading focuses on assets that are already moving strongly in one direction, with the expectation that the move will continue for some time. Traders use indicators like RSI, MACD, volume analysis, and price velocity to identify strong momentum.
Instead of buying undervalued assets, momentum traders buy strength and sell weakness. The key is timing—entering early in the momentum phase and exiting before it fades.
Why it works: Financial markets are driven by emotions such as fear and greed. Momentum reflects collective behavior, where strong trends attract more participants, pushing prices further.
Best for: Active traders who can monitor markets frequently and act quickly.
4. Swing Trading Strategy
Swing trading aims to capture short- to medium-term price movements that occur over several days to weeks. Traders focus on “swings” within a broader trend or range, buying near support and selling near resistance.
Technical analysis plays a major role, with indicators such as Fibonacci retracements, candlestick patterns, and oscillators helping identify entry and exit points.
Why it works: Markets rarely move in straight lines. Swing trading takes advantage of natural pullbacks and corrections within trends.
Best for: Traders who want a balance between time commitment and opportunity, without the pressure of intraday trading.
5. Day Trading Strategy
Day trading involves opening and closing positions within the same trading day, avoiding overnight risk. Strategies include scalping, range trading, and intraday breakouts, often based on lower time frames like 5-minute or 15-minute charts.
Strict risk management is essential, as day trading involves frequent trades and rapid decision-making. Liquidity, volatility, and tight spreads are crucial factors.
Why it works: Short-term price inefficiencies and intraday volatility create repeated opportunities. Skilled day traders rely on discipline and consistency rather than large individual profits.
Best for: Full-time traders with strong emotional control and fast execution ability.
6. Mean Reversion Strategy
Mean reversion is based on the idea that prices tend to return to their average or “mean” over time. When an asset becomes significantly overbought or oversold, traders anticipate a reversal.
Indicators such as Bollinger Bands, RSI, and statistical averages are commonly used to identify extreme price deviations.
Why it works: Markets often overreact to news and events. Mean reversion strategies capitalize on these overreactions, especially in range-bound markets.
Best for: Traders who prefer contrarian approaches and structured setups.
7. Price Action Trading Strategy
Price action trading relies purely on analyzing price movements without heavy use of indicators. Traders study candlestick patterns, support and resistance, market structure, and volume to make decisions.
This strategy emphasizes understanding market psychology and the behavior of buyers and sellers at key levels.
Why it works: Price reflects all available information. By focusing on raw price data, traders can react faster and avoid indicator lag.
Best for: Experienced traders who want clarity and simplicity in their analysis.
8. Risk Management and Position Sizing (The Core Strategy)
While not a trading strategy in the traditional sense, risk management is the foundation of all successful trading. Even the best strategies fail without proper risk control.
Key principles include:
Risking only a small percentage of capital per trade (typically 1–2%)
Using stop-loss orders
Maintaining a favorable risk-to-reward ratio
Avoiding overtrading
Why it works: Trading is a probability game. Risk management ensures survival during losing streaks and allows compounding during winning periods.
Conclusion
The best trading strategies are not about finding a single “holy grail” method, but about selecting approaches that match your personality, goals, and market conditions. Trend following, breakout trading, momentum trading, swing trading, day trading, mean reversion, and price action strategies all have proven effectiveness when applied correctly. However, consistency comes from discipline, continuous learning, emotional control, and robust risk management.
Ultimately, successful traders focus less on predicting the market and more on managing themselves. By mastering one or two strategies deeply and executing them with precision, traders can build long-term success in any financial market.
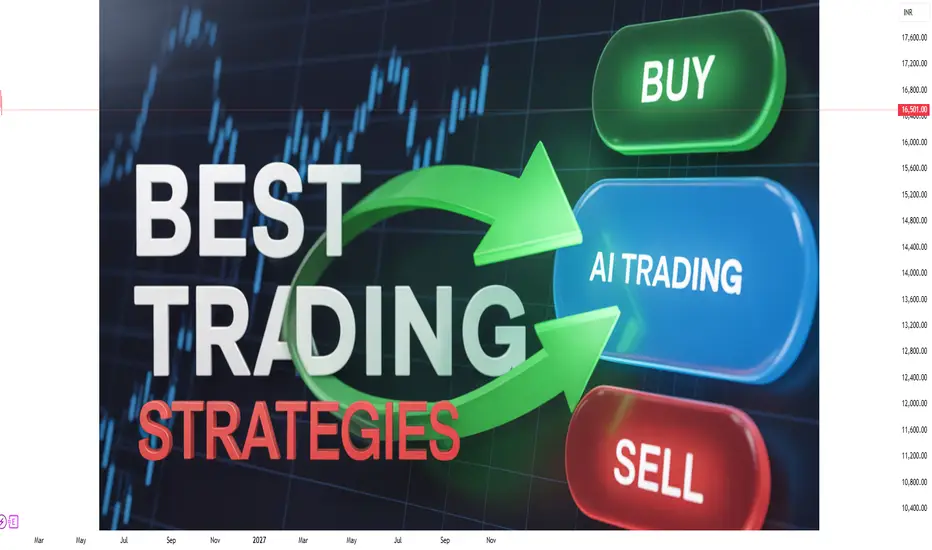
Crypto Investing Guide: Roadmap to Digital Asset InvestingCryptocurrency investing has evolved from a niche technological experiment into a global financial phenomenon. With Bitcoin, Ethereum, and thousands of alternative digital assets now traded worldwide, crypto has attracted retail investors, institutions, and even governments. However, crypto investing is fundamentally different from traditional investing due to its high volatility, emerging technology, regulatory uncertainty, and unique market dynamics. This guide provides a comprehensive overview of crypto investing, covering fundamentals, strategies, risks, and best practices to help investors make informed decisions.
Understanding Cryptocurrency and Blockchain
At its core, cryptocurrency is a digital or virtual currency secured by cryptography and typically built on blockchain technology. A blockchain is a decentralized, distributed ledger that records transactions across a network of computers. Unlike traditional financial systems controlled by central authorities, blockchains operate on consensus mechanisms such as Proof of Work (PoW) or Proof of Stake (PoS). This decentralization is a key value proposition, offering transparency, immutability, and resistance to censorship.
Bitcoin, the first cryptocurrency, was designed as a peer-to-peer electronic cash system. Ethereum expanded the concept by enabling smart contracts—self-executing programs that run on the blockchain—paving the way for decentralized finance (DeFi), non-fungible tokens (NFTs), and Web3 applications. Understanding these technological foundations is essential before investing, as the value of crypto assets is often tied to their utility, network adoption, and security.
Types of Crypto Assets
Crypto assets can be broadly categorized into several groups. Payment coins like Bitcoin and Litecoin focus on value transfer and store of value. Platform tokens such as Ethereum, Solana, and Avalanche support decentralized applications. Utility tokens grant access to specific services within an ecosystem. Stablecoins are pegged to fiat currencies and aim to reduce volatility. Governance tokens allow holders to vote on protocol decisions. Each category carries different risk and return profiles, making diversification across types an important consideration.
Why People Invest in Crypto
Investors are drawn to crypto for multiple reasons. Some view it as a hedge against inflation and currency devaluation, especially in economies with unstable monetary systems. Others are attracted by the potential for high returns, as early adopters of successful projects have historically seen significant gains. Additionally, crypto offers exposure to cutting-edge innovation in finance, technology, and digital ownership. However, these opportunities come with heightened risks that require careful evaluation.
Investment Strategies in Crypto
Crypto investing strategies range from conservative to highly speculative. Long-term investing (HODLing) involves buying fundamentally strong projects and holding them through market cycles, betting on long-term adoption. Dollar-cost averaging (DCA) reduces timing risk by investing fixed amounts at regular intervals. Active trading focuses on short-term price movements using technical analysis but requires experience, discipline, and risk management. Staking and yield farming allow investors to earn passive income by locking assets in networks or DeFi protocols, though they introduce smart contract and liquidity risks.
A disciplined strategy should align with the investor’s risk tolerance, time horizon, and financial goals. Overexposure to a single asset or strategy can significantly increase downside risk.
Fundamental and Technical Analysis
Successful crypto investing relies on analysis. Fundamental analysis examines factors such as the project’s use case, team, tokenomics, roadmap, community support, and real-world adoption. Metrics like active addresses, transaction volume, and total value locked (TVL) provide insights into network health. Technical analysis, on the other hand, studies price charts, trends, support and resistance levels, and indicators like RSI or moving averages to identify potential entry and exit points. Combining both approaches can lead to more balanced decisions.
Risk Management and Volatility
Crypto markets are notoriously volatile, with prices capable of swinging dramatically in short periods. Risk management is therefore critical. Investors should never invest money they cannot afford to lose, use position sizing to limit exposure, and avoid excessive leverage. Setting stop-loss levels, maintaining diversification, and periodically rebalancing portfolios can help manage downside risk. Emotional discipline is equally important, as fear and greed often drive poor decisions during extreme market moves.
Security and Storage
Security is a unique concern in crypto investing. Assets are controlled by private keys, and losing them can mean permanent loss of funds. Investors can store crypto on exchanges, software wallets, or hardware wallets. While exchanges offer convenience, they carry counterparty risk. Hardware wallets provide higher security for long-term holdings. Practicing good security hygiene—such as enabling two-factor authentication, avoiding phishing links, and backing up recovery phrases—is essential.
Regulation and Taxation
Crypto regulations vary widely across countries and are constantly evolving. Some jurisdictions embrace digital assets, while others impose restrictions or bans. Investors must stay informed about local regulations, compliance requirements, and tax obligations. Profits from crypto trading are often subject to capital gains tax, and improper reporting can lead to legal issues. Regulatory clarity can significantly impact market sentiment and asset prices.
Common Mistakes to Avoid
New investors often fall into predictable traps: chasing hype, investing without research, overtrading, or relying solely on social media tips. Another common mistake is ignoring fees, liquidity, and security risks. Patience, education, and a long-term perspective can help avoid costly errors.
Conclusion
Crypto investing offers unique opportunities to participate in a rapidly evolving digital economy, but it is not a guaranteed path to wealth. Success requires a solid understanding of blockchain technology, thoughtful strategy selection, disciplined risk management, and continuous learning. By approaching crypto with a balanced mindset—embracing innovation while respecting risk—investors can navigate this dynamic market more effectively and build a resilient digital asset portfolio over time.

Part 8 Trading Master ClassHow Option Trading Works
Unlike stock trading where you buy shares directly, in option trading you buy contracts. Each contract controls a certain quantity of the underlying asset.
Example:
If NIFTY is trading at 24,000 and you buy a NIFTY 24,000 CE, you are purchasing a call option with strike 24,000. If NIFTY moves above this level before expiry, your call option gains value.
In options, your potential loss is limited to premium paid, but profits can be unlimited for calls and substantial for puts. This limited risk attracts many traders.
