LICI 1 Week View 🔢 Current status
The stock is currently trading around ₹ 911 on the NSE.
Day-range recently: approx ₹ 906.60 to ₹ 920.60.
52-week range: approx ₹ 715.30 to ₹ 1,007.80.
📉 Key levels to watch for the coming week
Support zone: Roughly around ₹ 895-₹ 900 — the recent trading floor is around that area.
Resistance zone: Near ₹ 920-₹ 930 — this is where the recent high end of the day‐ranges have been.
If price breaks above ~₹ 930 with strength, that could open a move toward ~₹ 950 in the short term (assuming favourable market context).
If price falls below ~₹ 895, risk of a slip toward ~₹ 880 or lower until a new base is found.
⚠️ What to Watch / Risks
The 1-week gain is modest; there’s no strong breakout yet.
If broader market or sector weakens (insurance/financials), LICI could get caught in the drift.
Watch news / earnings triggers that could suddenly shift sentiment.
📝 Disclaimer
This is not a recommendation to buy or sell. Viewing over just one week is very short‐term and subject to high uncertainty. Please consider your own risk profile and possibly consult a financial advisor.
Trend Lines

Basics of MCX Trading1. What is MCX?
MCX is a regulated commodity exchange established in 2003 and is supervised by the Securities and Exchange Board of India (SEBI). Its main role is to provide a secure and transparent platform where commodity derivatives are traded. Unlike the stock market, where shares of companies are traded, MCX deals with commodities in financial form—mostly through futures and options contracts rather than physical goods.
MCX provides:
Real-time price data
Clearing and settlement services
Risk management systems
Standardized contracts
2. What Are Commodity Derivatives?
Commodity derivatives are financial instruments whose value depends on the price of an underlying commodity. On MCX, the two main derivatives are:
a) Futures Contracts
A futures contract is an agreement to buy or sell a commodity at a predetermined price on a specific future date. However, most MCX futures are not held until expiry; traders usually square off positions earlier to book profit or cut loss.
b) Options Contracts
In MCX options, the buyer pays a premium to obtain the right, but not the obligation, to buy or sell the commodity futures contract. Options help traders manage risk with controlled loss.
3. Common Commodities Traded on MCX
MCX offers a wide range of commodities across different sectors:
Bullions
Gold
Silver
Energy
Crude Oil
Natural Gas
Base Metals
Copper
Zinc
Lead
Nickel
Aluminum
Agricultural Commodities
Cotton
Crude Palm Oil (CPO)
Mentha Oil (sometimes available)
These commodities are offered in different contract sizes, such as:
Gold (1 kg)
Gold Mini (100 grams)
Silver (5 kg)
Crude Oil (100 barrels)
Natural Gas (1,250 mmBtu)
Mini versions for smaller traders
4. How MCX Trading Works
MCX trading functions just like stock trading, but there are some key differences due to the nature of commodities.
(1) Trading Hours
MCX operates longer hours compared to stock exchanges:
Monday to Friday
9:00 AM to 11:30 PM (or 11:55 PM depending on US daylight saving)
This allows Indian traders to align energy and metal prices with global commodity markets.
5. Margin System in MCX
To trade on MCX, traders must deposit an initial margin—a percentage of the contract value. This makes MCX trading highly leveraged.
Types of Margin:
Initial Margin
Required to open a position.
Exposure Margin
Charged to cover additional volatility risk.
MTM (Mark-to-Market) Margin
Daily profit or loss adjustment to maintain position.
Span Margin
Calculated using SPAN software based on risk.
Because of leverage, traders can control large commodity positions with relatively small capital, but risk also increases.
6. Lot Size and Tick Size
Every MCX contract has:
a) Lot Size
The fixed quantity of commodity in each contract.
Example:
Crude Oil: 100 barrels
Gold Mini: 100 grams
b) Tick Size
The minimum price movement allowed.
Example:
Gold: ₹1 per 10 grams
Crude Oil: ₹1 per barrel
Understanding these is important for calculating profits and stop-loss levels.
7. Settlement Mechanism
MCX contracts typically settle in two ways:
a) Cash Settlement
Most contracts, especially energy and metals, are settled in cash based on final settlement prices.
b) Physical Delivery
Some contracts (like gold and silver) allow physical delivery if the position is held until expiry. Retail traders generally square off positions before expiry to avoid delivery obligations.
8. Key Participants in MCX
Hedgers
Businesses like jewelers or oil companies hedge against price risk.
Speculators
Traders who aim to profit from price movements.
Arbitrageurs
Exploit price differences between markets.
Speculators form the majority, and they contribute to liquidity.
9. Factors Influencing MCX Prices
Commodity prices depend on global and domestic factors. Major ones include:
a) Global Market Prices
MCX follows international commodity price trends (like NYMEX for crude oil and COMEX for gold).
b) USD/INR Exchange Rate
A weaker rupee increases commodity prices in India.
c) Demand and Supply
Economic cycles, industrial demand, and agricultural output affect prices.
d) Geopolitical Events
Wars, sanctions, and oil-exporting countries’ decisions impact energy prices.
e) Inventory Data
Weekly crude oil inventory reports from the US influence energy markets.
10. Types of MCX Trading
MCX traders use different trading styles depending on their experience:
1. Intraday Trading
Squaring off positions within the same day.
High volume
Quick profits (and losses)
Needs charts and indicators
2. Swing Trading
Holding positions for a few days.
Based on trend-following strategies
Lower stress compared to intraday
3. Positional Trading
Long-term holding until contract expiry or for weeks.
Based on macroeconomic factors
11. Tools and Charts for MCX Trading
Successful MCX trading requires studying:
Technical Analysis Tools
Candlestick patterns
Moving averages (MA)
RSI (Relative Strength Index)
MACD
Bollinger Bands
Support & Resistance
Fundamental Analysis
Global market trends
Economic releases
Inventory reports (for crude & natural gas)
MCX traders often combine both analyses for accuracy.
12. Risks in MCX Trading
While MCX offers high profit potential, the risks are equally high:
High Volatility
Energy markets like crude oil move rapidly.
Leverage Risk
Small capital can lead to big losses.
Global News Impact
Prices react instantly to global events.
Over-trading
Beginners often trade too frequently.
Proper stop-loss and risk management are essential.
13. Benefits of MCX Trading
High liquidity
Transparent and regulated market
Low capital requirement due to margin system
Hedging opportunities
Long trading hours
Conclusion
MCX trading is a dynamic and exciting arena where traders can participate in global commodity markets right from India. Whether you trade gold, crude oil, or base metals, understanding the basics—such as contract types, margins, lot sizes, market hours, and global price influences—is crucial to becoming a successful trader. With proper analysis, discipline, and risk management, MCX offers significant opportunities for profit and portfolio diversification.
Intraday Trading vs. Swing Trading1. What Is Intraday Trading?
Intraday trading—also known as day trading—refers to buying and selling financial instruments within the same trading day. All positions are squared off before the market closes. The primary objective is to capitalize on small price movements during the day.
Key Characteristics of Intraday Trading
Time Horizon: A few minutes to a few hours.
Positions: Must close by the end of the session.
Frequency of Trades: High—sometimes dozens of trades per day.
Leverage: Often high, as brokers offer intraday margin.
Market Focus: Stock volatility, liquidity, volume spikes, and news events.
Tools: Charts with 1–15 minute timeframes, technical indicators like VWAP, RSI, MACD, moving averages, and candlestick patterns.
How Intraday Traders Operate
Day traders look for rapid moves caused by:
Opening volatility
Breakouts and breakdowns
Intraday trend reversals
News announcements or corporate actions
Market sentiment shifts
They aim for modest but repeated profits. For example, capturing 0.5%–1% price movements several times a day.
Pros of Intraday Trading
No overnight risk: Prices cannot gap up or down because positions close daily.
Quick profit potential: Traders can compound small gains.
High leverage availability: Amplifies profits (but also losses).
Opportunities daily: Markets always offer short-term moves.
Cons of Intraday Trading
High stress and emotional pressure.
Requires constant screen time (full-time commitment).
High transaction costs due to frequent trades.
Losses can accumulate quickly because of leverage.
It is suitable for traders who enjoy fast decision-making, market analysis, and disciplined risk management.
2. What Is Swing Trading?
Swing trading refers to holding positions for multiple days to a few weeks to capture medium-term price movements. It focuses on identifying “swings” or waves in the market trend.
Key Characteristics of Swing Trading
Time Horizon: 2–20 days typically.
Positions: Held overnight and sometimes over weekends.
Trade Frequency: Lower—maybe 2–10 trades per week.
Tools: 1-day, 4-hour, or hourly charts; indicators like moving averages, Fibonacci levels, RSI, stochastic oscillators, and chart patterns.
Market Focus: Broader market trend, news cycles, earnings impact.
How Swing Traders Operate
Swing traders identify the primary trend—uptrend, downtrend, or consolidation—and position themselves accordingly. They capture portions of bigger moves, such as:
3–10% swing in stocks
Trend continuation patterns like flags or triangles
Support/resistance rebounds
Moving average crossovers
Swing trading balances technical and fundamental analysis, especially when holding positions through news events or earnings announcements.
Pros of Swing Trading
Less screen time: Can be done alongside a full-time job.
Larger profit targets: 3–10% moves vs. small intraday scalps.
Lower stress: Fewer decisions per day.
Reduced transaction costs: Fewer trades → lower brokerage.
Cons of Swing Trading
Overnight risk: Gaps may lead to unexpected losses.
Requires patience and emotional control.
Positions may move slowly compared to intraday trades.
Wider stop losses needed due to longer timeframe volatility.
Swing trading suits individuals who prefer thoughtful, strategic decision-making rather than rapid reactions.
3. Key Differences: Intraday vs. Swing Trading
a. Time Commitment
Intraday: Requires monitoring markets from opening to closing.
Swing: Check markets occasionally—morning, evening, or alerts.
b. Risk Exposure
Intraday: No overnight risk, but higher exposure to rapid intraday volatility.
Swing: Overnight risk exists but overall volatility is smoother.
c. Trade Duration
Intraday: Seconds to hours.
Swing: Days to weeks.
d. Profit Potential
Intraday: Smaller gains per trade, high frequency.
Swing: Larger gains per trade, lower frequency.
e. Required Skills
Intraday: Quick reflexes, strong technical skills, mental stamina.
Swing: Trend analysis, patience, broader market understanding.
f. Leverage Use
Intraday: High leverage available; can increase returns but also risks.
Swing: Lower leverage, more stable risk control.
4. Psychology Behind the Two Styles
Intraday Requires:
Rapid decision making
Ability to stay calm under pressure
Strict discipline
Risk management on every trade
Emotional stability after losses
Because intraday trading involves many quick trades, emotional fatigue is common.
Swing Trading Requires:
Patience to let trades mature
Ability to hold through minor fluctuations
Avoiding fear from overnight gaps
Trust in analysis
Swing traders face psychological challenges when price moves against them temporarily.
5. Which One Is More Suitable for You?
Choose Intraday Trading If:
You can devote full time to monitoring markets.
You enjoy fast-paced trading.
You have high risk tolerance.
You can manage stress and stick to tight stop losses.
You want consistent, daily trading opportunities.
Choose Swing Trading If:
You want to trade part-time.
You prefer larger, less frequent trades.
You don't want constant screen time.
You are comfortable holding positions overnight.
You have a long-term view of market trends.
6. Which One is More Profitable?
Profitability depends on:
Strategy
Discipline
Risk management
Capital size
Consistency
Intraday can give fast profits but also fast losses. Swing trading offers more stability and can provide strong returns with fewer trades.
Many experienced traders prefer swing trading because it reduces emotional strain and trading costs while still delivering meaningful gains. But others achieve high success with intraday strategies by staying disciplined and using strict risk controls.
Conclusion
Intraday trading and swing trading represent two different philosophies of participating in financial markets. Intraday trading focuses on short bursts of volatility within a single trading session, requiring constant attention, sharp reflexes, and tight risk control. Swing trading, on the other hand, seeks to capture multi-day price swings, offering a more relaxed pace and potentially larger profits per trade but with overnight risks.
The better approach depends entirely on your personal style, time availability, risk appetite, and psychological comfort. By understanding their differences, traders can choose the method that fits their goals—and apply the right discipline, planning, and strategy to succeed.
Indian Stock Market1. What Is the Indian Stock Market?
The Indian stock market is a platform where buyers and sellers trade shares of publicly listed companies. It helps companies raise money for growth and expansion, and it allows investors to participate in the wealth creation generated by businesses.
It consists mainly of two major stock exchanges:
Bombay Stock Exchange (BSE) – Established in 1875, one of the oldest exchanges in Asia.
National Stock Exchange (NSE) – Established in 1992, known for its electronic trading system and higher trading volumes.
Both exchanges operate under strict regulation to maintain transparency, fairness, and investor protection.
2. How the Market Works
The Indian stock market operates through an electronic system where trades are matched using advanced technology. When an investor places a buy or sell order, the system matches the order with the opposite party.
Key Components:
a) Primary Market
This is where companies raise money for the first time through an Initial Public Offering (IPO).
Investors buy shares directly from the company.
After listing, the shares become available for trading in the secondary market.
b) Secondary Market
Here, investors buy and sell shares among themselves.
The company does not receive money from these trades.
This is where most trading activity takes place.
3. Major Indices in India
Stock market indices act like barometers that show the overall direction of the market.
a) Sensex (BSE)
Includes 30 of the largest and most established companies.
Represents the overall performance of the BSE.
b) Nifty 50 (NSE)
Includes 50 leading companies from different sectors.
Most widely used benchmark for Indian markets.
Other popular indices include:
Nifty Bank
Nifty IT
Nifty Midcap 100
Nifty Smallcap 100
Sensex Next 50
These indices help investors gauge market trends, sectoral performance, and economic health.
4. Key Participants in the Indian Stock Market
The Indian market is made up of different types of participants, each playing a unique role.
1. Retail Investors
Ordinary individuals investing through brokers or investment apps. Their participation has surged dramatically in recent years.
2. Domestic Institutional Investors (DIIs)
These include:
Mutual funds
Banks
Insurance companies
Pension funds
DIIs play a big role in stabilizing the market during volatile periods.
3. Foreign Institutional Investors (FIIs/FPI)
These are global investors such as hedge funds, pension funds, and foreign asset managers. They bring huge capital flows that influence market direction.
4. Brokers
SEBI-registered intermediaries who execute buy/sell orders for investors.
5. Regulators
Primarily the Securities and Exchange Board of India (SEBI), which ensures:
Fair trading
Transparent pricing
Investor protection
Prevention of fraud and manipulation
5. Types of Financial Instruments Traded
The Indian stock market offers a variety of financial instruments:
a) Equity Shares
Ownership in a company; investors benefit from price appreciation and dividends.
b) Derivatives
Contracts based on future value of assets:
Index futures
Stock futures
Options trading (very popular)
c) Debt Securities
Bonds, government securities, and corporate bonds.
d) Exchange-Traded Funds (ETFs)
Funds that track indices or commodities, traded like shares.
e) Mutual Funds
Professionally managed investment pools that invest in equities, debt, or hybrid assets.
6. Market Timing and Settlement
Market Timings (NSE & BSE):
Pre-open session: 9:00 AM – 9:15 AM
Regular trading: 9:15 AM – 3:30 PM
Post-market session: 3:40 PM – 4:00 PM
Settlement Cycle:
India follows the modern T+1 settlement cycle, meaning trades are settled one business day after the transaction.
7. Why the Indian Stock Market Is Growing Rapidly
1. Economic Growth
India is one of the fastest-growing major economies, attracting global investment.
2. Digitalization of Brokerage
Low-cost mobile trading apps have made investing accessible to everyone.
3. Rising Financial Literacy
More Indians understand the importance of equity investing over traditional savings.
4. Favorable Demographics
India has a young population with increasing disposable income.
5. Strong Corporate Performance
Large Indian companies—IT, banking, energy, pharma—have shown consistent growth.
6. Government Reforms
GST implementation
Insolvency and Bankruptcy Code (IBC)
Digital India push
Make in India
These reforms have strengthened investor confidence.
8. Factors That Influence the Indian Stock Market
a) Economic Indicators
GDP growth
Inflation
Interest rates
Fiscal deficit
b) Global Market Trends
Indian markets often follow trends in global markets like the US, Europe, and Asia.
c) Corporate Earnings
Quarterly results significantly impact stock prices.
d) FII / DII Flows
Large inflows push markets higher; outflows create pressure.
e) Geopolitical Events
War, trade disputes, and international tensions affect market stability.
9. Risks Involved in the Stock Market
Though the stock market provides high returns, it carries risks:
1. Market Risk
Broad market downturns affect all stocks.
2. Volatility
Prices can move quickly due to global news, economic data, or speculation.
3. Liquidity Risk
Some small-cap stocks may not have enough buyers and sellers.
4. Company-Specific Risk
Poor management decisions or scandals can destroy shareholder value.
5. Regulatory Risk
Policy changes can influence sectors like telecom or banking.
Risk management strategies such as diversification, asset allocation, and long-term investing help reduce these risks.
10. Why Investing in the Indian Stock Market Matters
Stock market investing helps individuals build long-term wealth. Historically, Indian equities have provided higher returns than gold, real estate, or fixed deposits over long periods. For example:
Equity returns (long-term average): 12–15%
Gold: 8–10%
Real estate: 6–9%
Fixed deposits: 5–7%
Participation in the stock market empowers citizens and strengthens the economy as companies receive the funds needed to grow, innovate, and create jobs.
Conclusion
The Indian stock market is a dynamic, rapidly evolving financial ecosystem that mirrors the country’s growth story. It offers immense opportunities for wealth creation, provided investors understand how it works and invest wisely. With strong regulatory oversight, technological advancements, and rising participation, the future of the Indian stock market looks extremely promising. Whether you're a beginner or a seasoned investor, the Indian market offers numerous avenues to grow your wealth and participate in India’s economic success.

Is Algo Trading the Future of the Indian Market?1. Growth of Algo Trading in India
Over the last decade, algo trading in India has moved from being a niche activity used only by institutional players to a widely accessible method for retail traders. This growth is supported by:
a. Increased Digitalization
India has one of the world’s most digital-friendly environments—fast internet adoption, UPIs, mobile-first platforms, and advanced trading apps. This infrastructure supports the fast execution speeds required for algos.
b. Rise of Discount Brokers
Platforms like Zerodha, Upstox, Angel One, Shoonya, Dhan, and Fyers are offering:
Low brokerage costs
API-based trading
Backtesting tools
Access to data feeds
Python/JavaScript integration
This has dramatically reduced the entry barrier for retail algo traders.
c. Institutional Participation
Mutual funds, hedge funds, proprietary trading desks, FIIs, and large institutions already use algos for:
High-frequency trading
Arbitrage
Options strategies
Market making
Risk hedging
Institutional demand ensures that algo trading will continue growing regardless of retail trends.
2. Supportive Regulatory Environment
The expansion of algo trading depends heavily on regulations. In India, SEBI has taken a cautious but supportive approach.
SEBI’s Key Steps:
Regulating co-location services to ensure fairness.
Introducing frameworks for API-based trading for retail users.
Monitoring high-frequency trading and latency advantages.
Ensuring brokers cannot mis-sell algos as guaranteed profit tools.
KYC and audit compliance for algo providers.
SEBI is neither fully restricting nor fully liberalizing algos. Instead, it wants a structured environment where technology helps markets—not manipulates them. This balance indicates that algo trading is seen as a legitimate part of the market’s future, provided it operates within transparent and fair guidelines.
3. Why Algo Trading Will Dominate the Future
Several macro trends show that algo trading is not just a temporary phase—it is becoming the financial backbone of India’s markets.
a. Speed and Efficiency
Algorithms can process:
Millions of market data points
News flow
Technical indicators
Price patterns
…in microseconds.
No human can match this efficiency.
b. No Emotion-Based Trading
Human traders suffer from fear, greed, overconfidence, and panic.
Algorithms follow pure logic and strategy.
This makes:
Risk management stronger
Execution more consistent
Performance less volatile
c. Backtesting and Strategy Optimization
Before placing a trade, algorithms can be tested across years of historical data. Traders can check:
Win-loss ratios
Maximum drawdowns
Profit factors
Risk-reward
Market conditions where strategy fails
This scientific approach ensures long-term reliability.
d. Scalability
Algo trading allows traders to handle:
Multiple asset classes
Various timeframes
Parallel strategies
…something impossible manually.
e. Lower Transaction Costs
Because execution is fast and automated, slippages reduce and costs drop—especially in intraday trading.
4. India’s Market Is Ideal for Algo Trading
Even though India is an emerging market, its structure is perfectly suited for algo trading:
a. High Liquidity
Nifty, Bank Nifty, FINNIFTY, MIDCPNIFTY, and most F&O stocks have huge liquidity—perfect for fast execution.
b. Strong Derivatives Market
India already has one of the largest options markets in the world.
Options algos—based on Greeks, volatility, spreads—are becoming extremely popular.
c. Retail Participation Rising
Retail traders contribute over 45% of derivatives volume.
Many of them are switching from manual trading to automated systems.
d. Growth of Fintech & Data Availability
The availability of discounted data feeds, cloud servers, VPS hosting, and API-driven platforms has made automation easy.
5. Future Technologies That Will Boost Algo Trading
The next wave of innovation will push algo trading even further.
a. AI and Machine Learning
AI-based models can learn from market behaviour, analyze patterns, and adapt strategies automatically.
b. Natural Language Processing (NLP)
AI models will read:
News headlines
Social media sentiment
Economic announcements
…and instantly react to changes.
c. Quantum Computing (Long-Term)
India is developing quantum research.
In the future, quantum computing may revolutionize complex market simulations.
d. Cloud-Based Trading Infrastructure
Servers hosted close to exchanges will reduce latency.
Retail traders can rent cloud-based algo engines instead of building their own.
6. Challenges and Risks in Algo Trading
Despite its potential, algo trading is not risk-free.
a. Over-Optimization
Backtests may look great but fail in live markets.
b. Technical Failures
Server downtime, API failure, or coding bugs can cause losses.
c. Lack of Market Understanding
Many new traders run algos without understanding risk management.
d. Competition
As more algos enter the market, older strategies stop working.
e. Regulatory Risks
SEBI keeps tightening rules to prevent misuse.
f. Potential for Flash Crashes
If many algos react simultaneously, markets may move violently.
7. The Role of Human Traders in the Future
Algo trading will grow, but human traders are not going away.
Instead, their role will shift from manual execution to:
Strategy design
Risk management
System optimization
Market research
Parameter tuning
Humans and machines will work together.
8. Final Verdict: Is Algo Trading the Future of the Indian Market?
Yes—algo trading is undoubtedly the future of the Indian financial markets.
The trend is clear:
More liquidity
More automation
Increased retail access
Data-driven decisions
Lower transaction costs
Expanding derivatives market
Supportive regulatory evolution
India is moving in the same direction as global markets where 70–80% of trades are algorithmic. Retail algo adoption will increase significantly in the next 5–10 years as technology becomes cheaper and easier to use.
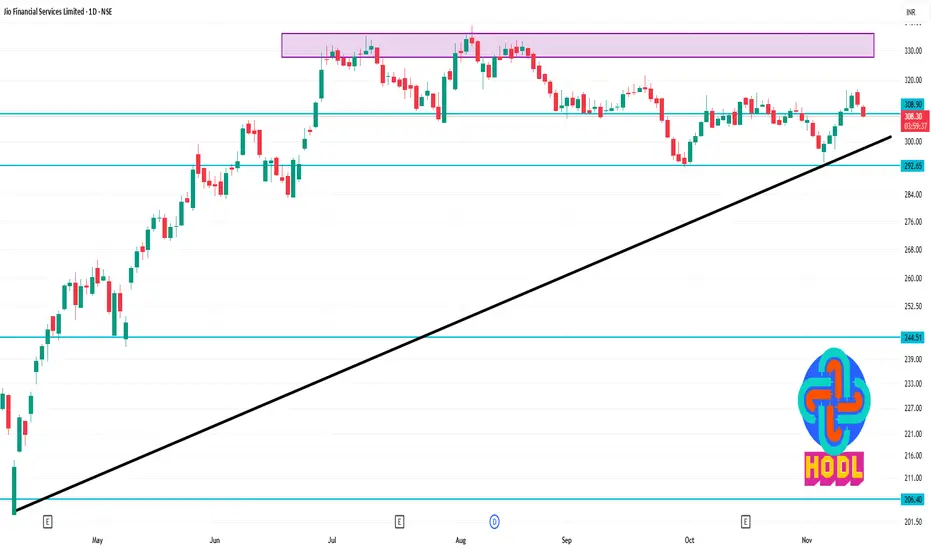
JIOFIN 1 Day Time Frame 📊 Key Daily Levels (1-Day Timeframe)
1. Support Levels
~ ₹309.8 — identified by Research360 as a support.
~ ₹307.6 — second support per Research360.
~ ₹304.1 — a lower support per pivot-point analysis.
Broader support zone (per some analysts) lies around ₹305–325, but for day trading, the ~304–310 area is more relevant.
2. Resistance Levels
~ ₹315.5 — first resistance per pivot analysis.
~ ₹319.0 — second resistance point per the same.
~ ₹321.2 — third resistance.
3. Pivot / Reference
Daily central pivot is ~ ₹313.3 (from pivot-point analysis).
Motilal Oswal’s pivot point (daily) is ~ ₹308.
4. Trend and Indicators
According to Investing.com, the technical indicators on daily chart lean strong buy.
On Research360, the RSI is around ~56 (neutral-bullish).
5. Larger View / Risk Zone
According to a TradingView analysis, there's a potential short-term dip toward ₹285–290 area if the current structure breaks down.
On the upside, that same analysis believes medium-term targets could go to ₹335+ if a breakout happens.
Part 1 Support and Resistance How Option Contracts Work
Every option has three basic components:
1. Strike Price
The fixed price at which you can buy (call) or sell (put) the asset.
2. Expiry Date
The date when the option contract ends. In India:
Index options: weekly & monthly expiry
Stock options: monthly expiry (with recent additions of weekly expiries)
3. Premium
The price you pay (or receive) to buy (or sell) the option.
Premium depends on:
Current price of underlying
Time left to expiry (time decay)
Volatility
Demand & supply

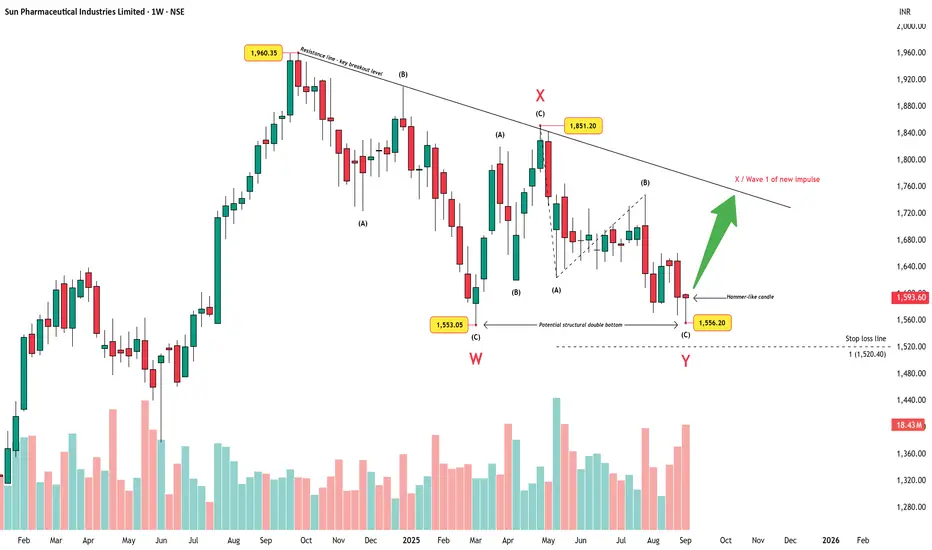
Sun Pharma – Double Bottom and Trendline Test AheadChart Summary
Sun Pharma’s weekly chart shows a completed W–X–Y corrective structure. Wave W bottomed near ₹1,553.05, followed by a corrective X at ₹1,851.20, and Wave Y terminating at ₹1,556.20. This final Y-leg has unfolded as an abc zigzag, respecting the larger corrective framework.
Price Action Highlights
A potential structural double bottom has formed around the ₹1,553–₹1,556 zone, hinting at possible exhaustion of the correction.
The latest candle is a hammer-like bar, suggesting demand stepped in around support levels.
Overhead, a major downtrend resistance line connecting the highs (₹1,960.35) to the swing X (₹1,851.20) remains the decisive breakout level.
A clear stop-loss line sits near ₹1,520.40, aligned with the 100% extension of Wave A inside Y. A break below this level invalidates the bullish case.
Volume Perspective
Recent selling has come with a volume spike, often seen during exhausation selling phases. If volume eases on follow-up candles while price holds above the support zone, it strengthens the case for a reversal.
Outlook
If price can sustain above the ₹1,553–₹1,556 support cluster and eventually break the trendline resistance, it may confirm the end of the corrective phase and open the door for a new impulsive sequence higher. Failure to hold the stop-loss zone, however, would negate this view and suggest further downside.
Disclaimer: This analysis is for educational purposes only and does not constitute investment advice. Please do your own research (DYOR) before making any trading decisions.
XAUUSDFinally the wait is over. From morning I was on sell side for gold and everyone was waiting for the breakout finally it happened booked good profit after so many fakeouts.

BTCEarlier I shared potential buy but it hit sl no worries I went against the trend so it's always a risk. Anyways found this beautiful breakout and entered sniper entry

Did NIFTY just turned bullish!? As we can see NIFTY managed to close itself above 26000 showing a bullish bias. Moreover, we can see NIFTY forming more like an inverted head and shoulders pattern in bigger time frame which is a strong bullish signal as this level has been tested multiple time making it weaker hence any closing above previous swing can show strong upmove! So plan your trades accordingly and keep watching everyone.

Rico Auto (D): Strongly Bullish, 20-Year BreakoutThis is a high-conviction, "blue-sky" breakout setup. The stock has shattered a resistance confluence that includes a 20-year-old horizontal ceiling . This technical move is powered by a massive fundamental turnaround in the recent quarter.
🚀 1. The Fundamental Catalyst (The "Why")
The breakout is not random; it is a direct reaction to the company's Q2 FY26 Earnings report (announced recently):
- Net Profit: Nearly tripled (surged ~200-300%) compared to the previous year.
- Revenue: Showed healthy growth despite sector headwinds.
- Impact: This strong fundamental performance provided the volume and momentum needed to break the multi-decade resistance.
📈 2. The "Confluence" Breakout (The Setup)
The stock faced two formidable barriers at the **₹108** level:
1. The 20-Year Resistance: A horizontal "lid" formed at the major peak in September 2005 (approx. ₹106-₹108). Breaking a 20-year resistance is a sign of a significant structural shift.
2. The Angular Resistance: The downward trendline from the April 2024 ATH (₹157).
💥 3. Today's Price Action (Confirmation)
- The Surge: The stock surged +11.93% today, closing decisively above the ₹108 confluence zone.
- The Volume: The move was backed by 37.23 Million in volume—a massive spike compared to the "drying volume" seen during the consolidation. This confirms institutional participation.
📊 4. Key Technical Indicators
Indicator analysis confirms the momentum across all timeframes:
- RSI: Rising in Daily, Weekly, and Monthly charts, showing synchronized bullish momentum.
- EMAs: Short-term EMAs are in a PCO (Price Crossover) state across all three timeframes, signaling a strong trend alignment.
🎯 5. Future Scenarios & Targets
With the 20-year resistance broken, the stock has room to run.
- 🐂 Target 1: ₹127 (Immediate technical extension).
- 🛑 Support (The Safety Net): The breakout level at ₹108 is now critical. If the stock pulls back, this "resistance-turned-support" must hold to keep the breakout valid. A successful re-test here would be a textbook entry opportunity.

Trade Best With These Premium Charts PatternsChart patterns form the visual language of financial markets. They compress the psychology of buyers and sellers into a structure that traders can read, interpret, and act upon. Among the numerous patterns that appear on charts, a special set falls into the category of premium chart patterns—high-probability, high-confidence structures that institutions respect and smart traders rely on.
These patterns work across:
Equities (NSE, BSE)
Index futures (Nifty, Bank Nifty, GIFT Nifty)
Commodities and Forex
Crypto markets
They are especially powerful when combined with:
Volume Profile
Order Flow
Market Structure (BOS, CHoCH, Liquidity)
Fibonacci
Supply & Demand zones

BUY TODAY SELL TOMORROW for 5%DON’T HAVE TIME TO MANAGE YOUR TRADES?
- Take BTST trades at 3:25 pm every day
- Try to exit by taking 4-7% profit of each trade
- SL can also be maintained as closing below the low of the breakout candle
Now, why do I prefer BTST over swing trades? The primary reason is that I have observed that 90% of the stocks give most of the movement in just 1-2 days and the rest of the time they either consolidate or fall
Trendline Breakout in SAKSOFT
BUY TODAY SELL TOMORROW for 5%

BUY TODAY SELL TOMORROW for 5%DON’T HAVE TIME TO MANAGE YOUR TRADES?
- Take BTST trades at 3:25 pm every day
- Try to exit by taking 4-7% profit of each trade
- SL can also be maintained as closing below the low of the breakout candle
Now, why do I prefer BTST over swing trades? The primary reason is that I have observed that 90% of the stocks give most of the movement in just 1-2 days and the rest of the time they either consolidate or fall
Trendline Breakout in MRPL
BUY TODAY SELL TOMORROW for 5%

BUY TODAY SELL TOMORROW for 5%DON’T HAVE TIME TO MANAGE YOUR TRADES?
- Take BTST trades at 3:25 pm every day
- Try to exit by taking 4-7% profit of each trade
- SL can also be maintained as closing below the low of the breakout candle
Now, why do I prefer BTST over swing trades? The primary reason is that I have observed that 90% of the stocks give most of the movement in just 1-2 days and the rest of the time they either consolidate or fall
Trendline Breakout in BHAGYANGR
BUY TODAY SELL TOMORROW for 5%

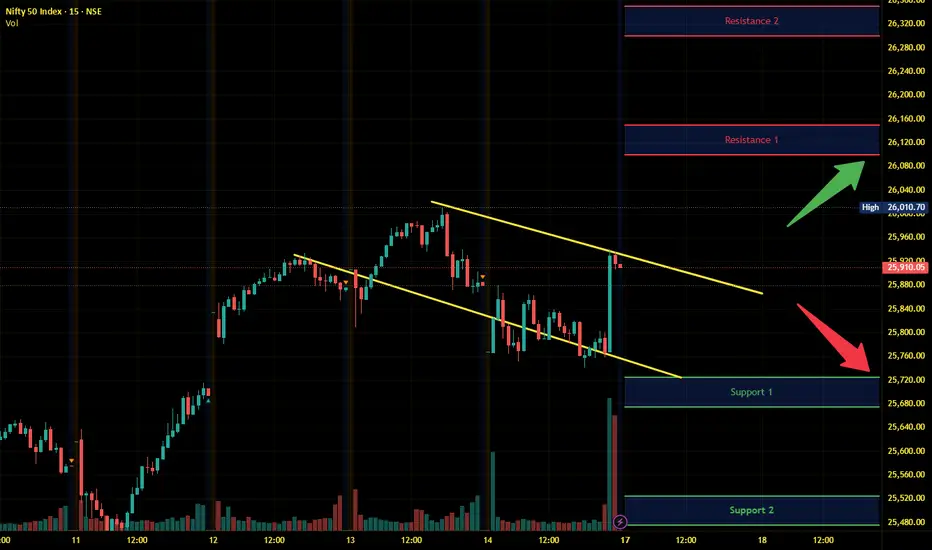
Nifty Intraday Analysis for 17th November 2025NSE:NIFTY
Index has resistance near 26100 – 26150 range and if index crosses and sustains above this level then may reach near 26300 – 26350 range.
Nifty has immediate support near 25725 – 25675 range and if this support is broken then index may tank near 25525 – 25475 range.
Banknifty Intraday Analysis for 17th November 2025NSE:BANKNIFTY
Index has resistance near 58900 – 59000 range and if index crosses and sustains above this level then may reach near 59400 – 59500 range.
Banknifty has immediate support near 58100 - 58000 range and if this support is broken then index may tank near 57600 - 57500 range.

Finnifty Intraday Analysis for 17th November 2025 NSE:CNXFINANCE
Index has resistance near 27700 - 27750 range and if index crosses and sustains above this level then may reach near 27950 - 28000 range.
Finnifty has immediate support near 27300 – 27250 range and if this support is broken then index may tank near 27050 – 27000 range.

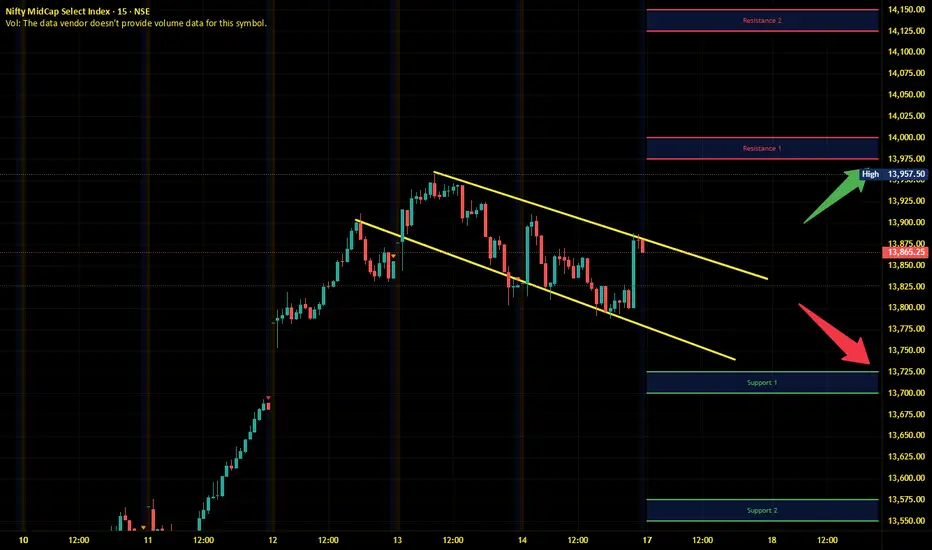
Midnifty Intraday Analysis for 17th November 2025NSE:NIFTY_MID_SELECT
Index has immediate resistance near 13975 – 14000 range and if index crosses and sustains above this level then may reach 14125 – 14150 range.
Midnifty has immediate support near 13725 – 13700 range and if this support is broken then index may tank near 13575 – 13550 range.
Option Trading Strategies How Option Buyers Make Money
Option buyers profit when:
The price moves strongly in their direction
The move happens quickly
Volatility increases
Time remains before expiry
However, buyers can lose 100% of their premium if expectations do not play out.

Part 2 Candle Stick PatternsThe Role of Time in Options
Time value is one of the most important elements.
Unlike stocks, options lose value as they approach expiry. This is known as time decay (theta).
Option BUYERS are hurt by time decay.
Option SELLERS benefit from it.
This is one reason why selling options is a common strategy for generating income.

Part 1 Candle Stick Patterns Why Trade Options?
Options are used for three primary purposes:
(A) Hedging (Risk Protection)
Just like insurance protects your car or house, options can protect your portfolio from losses.
Example:
If you own a stock and are worried it might fall, buying a Put option can limit your downside risk.
(B) Speculation (Profit from Movements)
Options allow traders to profit from:
Rising markets (buy calls)
Falling markets (buy puts)
Sideways markets (sell options or use spreads)
(C) Income Generation
Through option selling (writing), traders earn premium income. For example, selling call or put options can generate regular cash flow.
