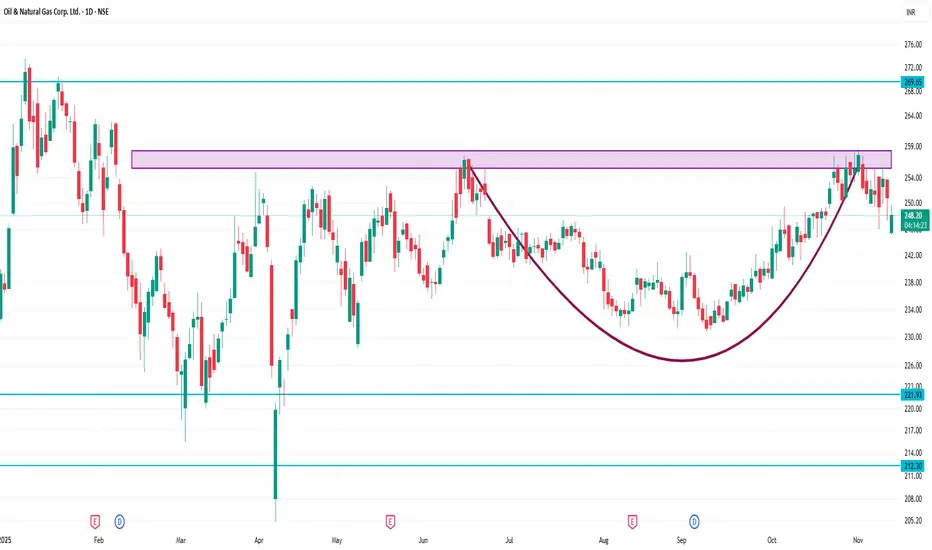
ONGC 1 Day Time Frame 🎯 Key levels to watch on the 1-day chart
Support zone: ~ ₹ 245-243 region (falls in line with support zones and moving average base)
Near support: ~ ₹ 248-250 (if price returns toward pivot/support)
Resistance zone: ~ ₹ 253-257 region (prior resistance, pivot R1, chart resistance).
If ONGC breaks above ~₹ 257 with conviction, next higher resistance might be ~ ₹ 260+ (depending on trend).
If ONGC breaks down below ~₹ 243 (support zone) with volume, possible further drop toward ~₹ 241 or ~₹ 225 in longer term.
Trend Lines
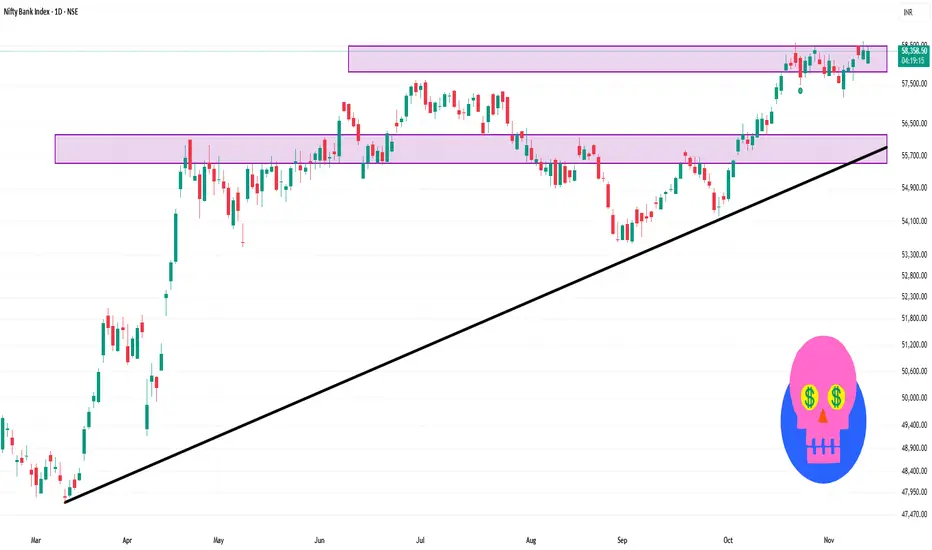
Bank Nifty 1 Day Time Frame 🔍 Current snapshot
Index value: ~ ₹ 58,380.
Recent daily range: approx ₹ 58,050 to ₹ 58,467.
Technical momentum indicators: On the daily timeframe, moving averages are all signalling “outperform”.
📈 Key support & resistance levels
From recent technical commentary:
Resistance 1: ~ ₹ 58,467
Resistance 2: ~ ₹ 58,613.80
Support 1: ~ ₹ 58,188.10
Support 2: ~ ₹ 57,611.50
Additional broader support zone: ~ ₹ 58,000-58,150; a break below opens risk to ~ ₹ 57,700.
NYKAA 1 Day Time Frame ✅ Current price & basic data
Last close ~ ₹256.95.
Intraday range: ~ ₹255.03 to ₹258.60 (based on current session)
52-week range: ~ ₹154.90 (low) to ₹268.25 (high).
🎯 My 1-Day level suggestion
Resistance: ~ ₹260 to ₹265 (if price rises above ~₹257-₹258 today)
Support: ~ ₹250 to ₹252 (if price falls from current)
If I were trading intraday: I’d wait for a clear breakout above ~₹260 with volume for a long, or breakdown below ~₹250 for a short/exit.

Part 9 Trading Master Class With Experts What Are Options?
Options are financial contracts that give a trader the right, but not the obligation, to buy or sell an asset at a fixed price (called the strike price) before or on a specific date (called the expiry).
The underlying asset could be a stock, index, commodity, or currency.
Because options provide choice (whether to exercise or not), they are called “options.”
There are two main types:
Call Option – gives you the right to buy at a fixed price.
Put Option – gives you the right to sell at a fixed price.
In both cases, you pay a premium (price of the option). This is the maximum loss for option buyers.

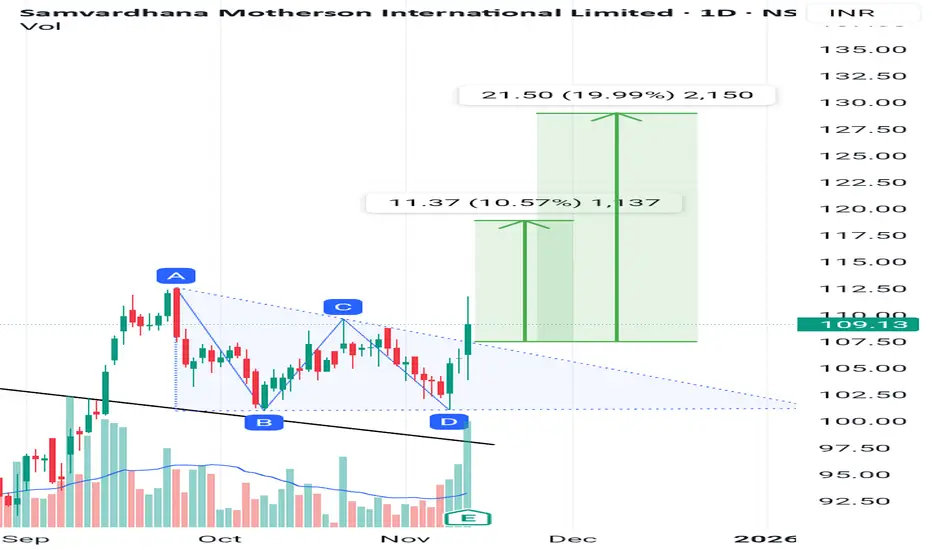
Samvardhana Motherson just made a triangle breakout.will it sustJust broke out of triangle pattern with good volume spike. Volumes are 3 times the average.
It brokeout of treandline on 12 September and gave a move of 10% before entring into consolidation of triangle pattern.
It just broke out of the pattern giving bullish signal.
Indicators
RSI is >60 which is a bullish signal
ADX is still weak at 13.38 although rising when compared to day before when it was 10.9
Entry at 110 looks safe
Might retrace till 100
SL at 95
Target at 119--130
EXACT rejection from 26000!! What's next!?As we can see NIFTY did achieve our target of 26000 as expected and got rejected exactly from there which was well analysed in our previous post about the possible rejection being both a psychological level and important supply zone. Now that we have seen strong rejection, we can expect NIFTY to remain negative in coming trading sessions unless it manages to sustain itself above 26000 levels so plan your trades cautiously.

Candle Patterns Explained Doji Candle – Indicates market indecision where opening and closing prices are almost equal.
Hammer Candle – A bullish reversal signal appearing after a downtrend with a long lower wick.
Shooting Star – A bearish reversal pattern with a small body and a long upper shadow at the top of an uptrend.
Bullish Engulfing – A large bullish candle fully engulfs the previous bearish candle, signaling potential trend reversal upward.
Bearish Engulfing – A large bearish candle fully engulfs the previous bullish candle, hinting at a possible downward reversal.

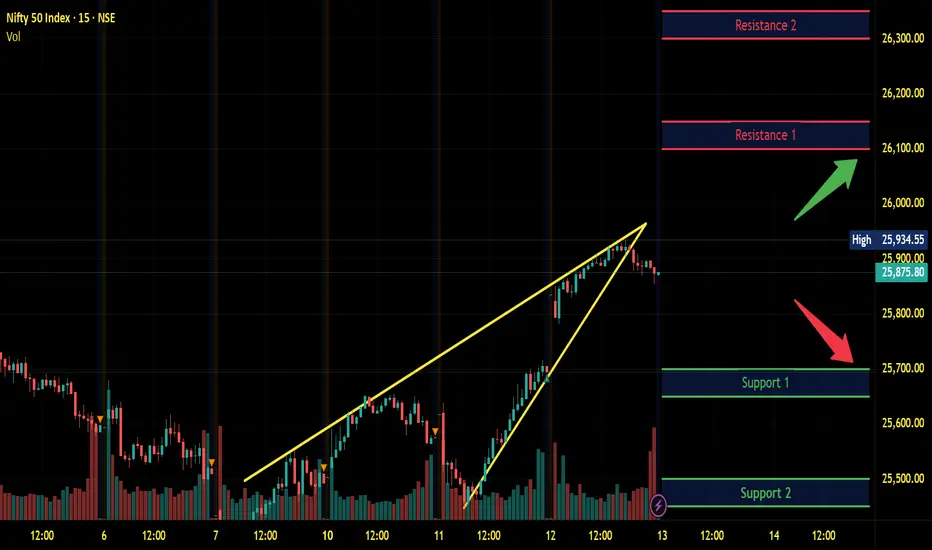
Nifty Intraday Analysis for 13th November 2025NSE:NIFTY
Index has resistance near 26100 – 26150 range and if index crosses and sustains above this level then may reach near 26300 – 26350 range.
Nifty has immediate support near 25700 – 25650 range and if this support is broken then index may tank near 25500 – 25550 range.
Banknifty Intraday Analysis for 13th November 2025NSE:BANKNIFTY
Index has resistance near 58700 – 58800 range and if index crosses and sustains above this level then may reach near 59200 – 59300 range.
Banknifty has immediate support near 57900 - 57800 range and if this support is broken then index may tank near 57400 - 57300 range.

Finnifty Intraday Analysis for 13th November 2025 NSE:CNXFINANCE
Index has resistance near 27550 - 27600 range and if index crosses and sustains above this level then may reach near 27800 - 27850 range.
Finnifty has immediate support near 27150 – 27100 range and if this support is broken then index may tank near 26950 – 26900 range.

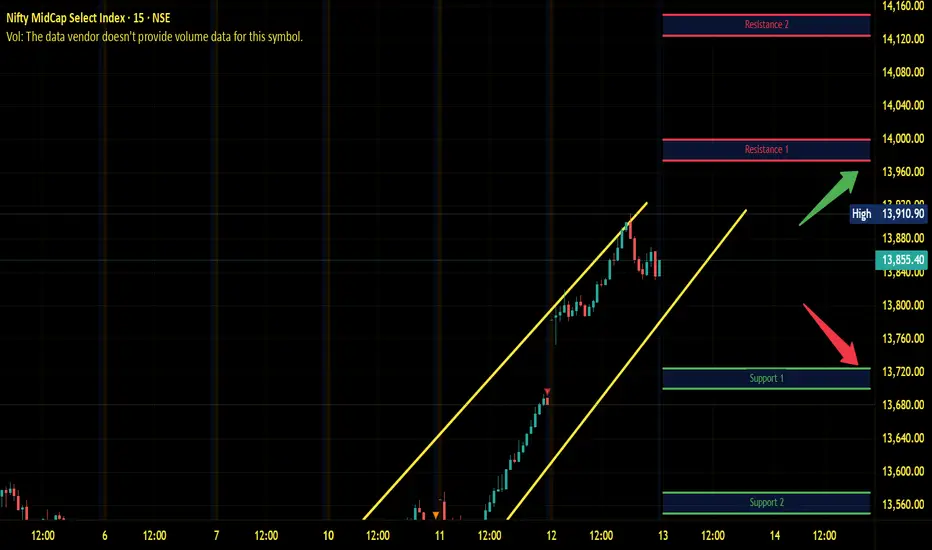
Midnifty Intraday Analysis for 13th November 2025NSE:NIFTY_MID_SELECT
Index has immediate resistance near 13975 – 14000 range and if index crosses and sustains above this level then may reach 14125 – 14150 range.
Midnifty has immediate support near 13725 – 13700 range and if this support is broken then index may tank near 13575 – 13550 range.
Premium Chart AnalysisHow to Trade Chart Patterns
To effectively trade chart patterns, follow these steps:
Identify the Pattern Early
Use clear trendlines to mark support and resistance zones.
Confirm shape and symmetry before assuming a pattern.
Wait for Breakout Confirmation
A breakout should be supported by volume expansion—this validates the move.
Avoid acting before confirmation; false breakouts are common.
Set Entry and Exit Points
Enter after a confirmed breakout (preferably with candle close beyond resistance/support).
Target = Height of pattern projected from breakout point.
Stop-loss = Just below (for bullish) or above (for bearish) the breakout level.
Use Multiple Timeframe Analysis
Confirm pattern on higher timeframes to avoid false signals.
Align short-term setups with long-term trends for stronger conviction.

Part 8 Trading Master Class With ExpertsRisks in Option Trading
While options offer great potential, they also come with risks, especially for sellers.
Time Decay: The value of an option decreases as it nears expiry.
Volatility Risk: Unexpected drops in volatility can reduce premium value.
Unlimited Loss (for Writers): Option sellers can face huge losses if the market moves sharply against them.
Complexity: Understanding option behavior and Greeks requires knowledge and experience.
Therefore, beginners should start small and practice on demo accounts or low-risk strategies before committing large capital.

Part 7 Trading Master Class With Experts Types of Option Strategies
Option trading is not just about buying calls or puts; it involves strategic combinations to profit under various market conditions. Some popular strategies include:
a) Bullish Strategies
Bull Call Spread: Buying a lower strike call and selling a higher strike call.
Bull Put Spread: Selling a higher strike put and buying a lower strike put.
b) Bearish Strategies
Bear Call Spread: Selling a lower strike call and buying a higher strike call.
Bear Put Spread: Buying a higher strike put and selling a lower strike put.
c) Neutral Strategies
Iron Condor: Selling one call and one put at close strikes while buying further out-of-the-money options.
Straddle: Buying both a call and put at the same strike to profit from big moves in either direction.
Strangle: Buying a call and a put at different strikes to benefit from volatility.
These strategies allow traders to earn consistent returns by managing risk rather than relying purely on market direction.

Part 6 Learn Institutional Trading
Option Greeks
Option traders use “Greeks” to measure how different factors affect the price of an option:
Delta: Measures how much the option price changes with a ₹1 change in the underlying.
Gamma: Measures the rate of change of Delta.
Theta: Measures time decay – how much value an option loses each day as expiry approaches.
Vega: Measures sensitivity to volatility.
Rho: Measures sensitivity to interest rates.
Understanding Greeks helps traders manage risk and make informed decisions.

Part 4 Learn Institutional Trading Participants in the Options Market
There are four types of participants in the options market:
Buyers of Call Options – Expect the price to go up.
Sellers of Call Options – Expect the price to stay the same or fall.
Buyers of Put Options – Expect the price to fall.
Sellers of Put Options – Expect the price to stay the same or rise.
Buyers take limited risk (the premium) with unlimited profit potential, while sellers take limited profit (the premium received) but unlimited risk.

Part 3 Learn Institutional Trading How Option Trading Works
When you trade options, you’re speculating on how the price of the underlying asset will move within a specific time frame. Here’s how it works for both types of options:
a) Call Option Example
Suppose Reliance stock is trading at ₹2,500. You buy a Call Option with a strike price of ₹2,520, paying a premium of ₹20.
b) Put Option Example
You buy a Put Option on Reliance with a strike price of ₹2,480 and pay a ₹15 premium.

Part 2 Ride The Big Moves Key Terminology in Option Trading
To understand option trading, you must be familiar with a few important terms:
Underlying Asset: The financial instrument (e.g., NIFTY, Bank NIFTY, Reliance Industries) on which the option is based.
Strike Price: The fixed price at which the underlying can be bought or sold.
Premium: The price paid by the buyer to the seller for owning the option contract.
Expiry Date: The last day on which the option can be exercised. In India, index options usually expire weekly or monthly.
Lot Size: The minimum quantity of the underlying asset that can be traded per option contract.
In the Money (ITM): When exercising the option gives a profit.
At the Money (ATM): When the strike price equals the current market price.
Out of the Money (OTM): When exercising the option gives no profit.

ANGELONE 1 Day Time Frame 📌 Key Levels (Daily)
Pivot (Classic): ≈ ₹2,675.77.
Resistance zones:
R1 (Classic): ~ ₹2,713.73
R2: ~ ₹2,747.97
Support zones:
S1 (Classic): ~ ₹2,641.53
S2: ~ ₹2,603.57
⚠️ Important Caveats
These levels are calculated from daily data — they do not guarantee the stock will only move within these ranges or behave exactly as outlined.
Market conditions, news, F&O flows, and broader sector moves can invalidate these levels rapidly.
Use these levels along with your own risk management: stop-losses, position size, and timeframe.
The data may have a delay or slight inaccuracy — always cross-verify with live quotes.

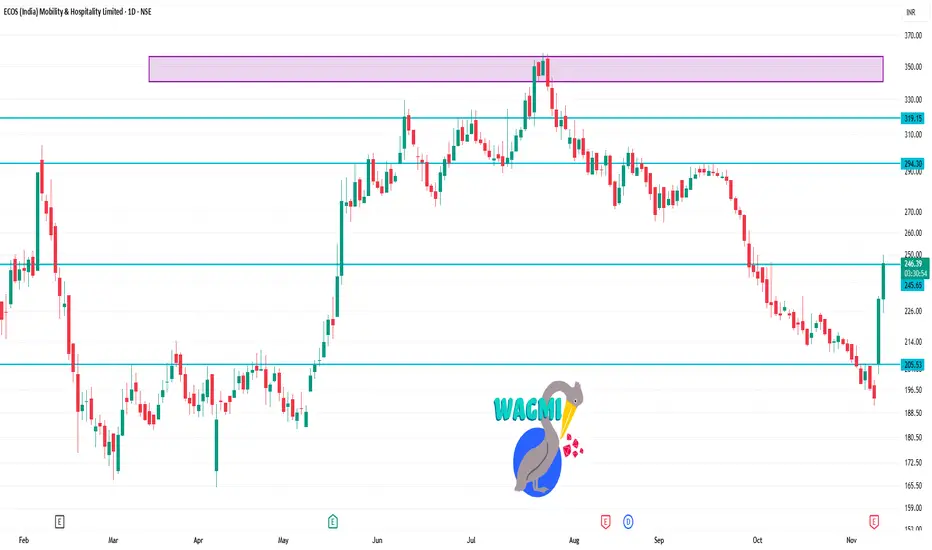
ECOSMOBLTY 1 Day Time Frame Last traded price: ₹ 246.55 (up ~6.69% today)
Day’s range: Low ~ ₹ 225.20, High ~ ₹ 248.50
52-week range: Low ~ ₹ 165.00, High ~ ₹ 361.40
⚠️ Caveats
Technical outlook alone doesn’t account for fundamental news, upcoming earnings, macro factors. For example, their upcoming board meeting/earnings may influence price sharply.
The “oversold” RSI does not guarantee a reversal — especially in a strong downtrend, oversold can persist.
Trading on a 1-day time-frame is riskier (higher volatility, noise) — keep tight risk control.
Part 1 Ride The Big Moves What is an Option?
An option is a financial derivative whose value is derived from an underlying asset such as a stock, index, or commodity. Options come in two primary forms:
Call Option: It gives the holder the right to buy the underlying asset at a predetermined price (known as the strike price) before or on the expiry date.
Put Option: It gives the holder the right to sell the underlying asset at a predetermined strike price before or on the expiry date.
The buyer of an option pays a premium to the seller (also called the writer) for this right. The seller receives the premium as income but takes on the obligation to buy or sell the asset if the buyer chooses to exercise the option.

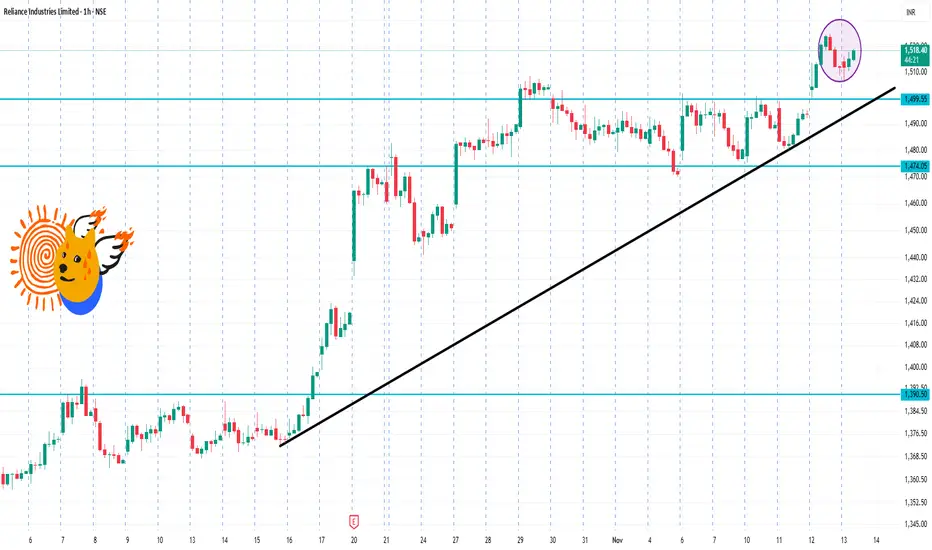
RIL 1 Hour Time Frame🔍 Current basics
Latest traded price: ~ ₹1,518 on NSE.
52-week range: Low ~ ₹1,114.85, High ~ ₹1,551.00.
Technical indicator summary (on 1-hour/higher timeframes) shows a “Strong Buy” bias.
⚠️ Risks / Caveats
Even though the technicals are bullish, the stock is close to its 52-week high (~ ₹1,551). Highs often mean less “room” for upside without some pullback.
Intraday patterns can change quickly with macro news or sector moves (eg: oil & gas, regulatory).
Support at ~₹1,500 is fairly close to current; a break could expose the ₹1,470–₹1,480 region.
Because this is a large-cap and widely held stock, institutional moves and volume matter a lot.
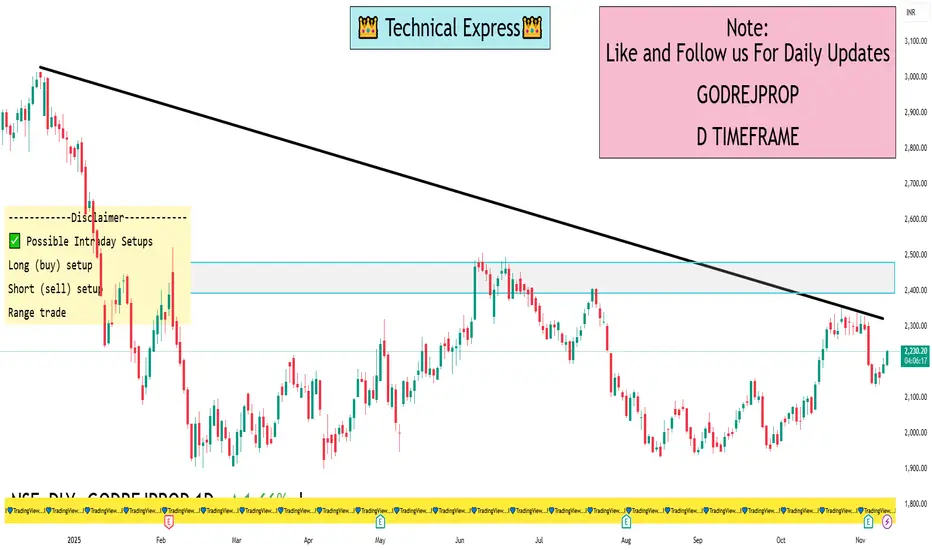
GODREJPROP 1 Day Time Frame📊 Current Intraday Snapshot
Day’s range: approx ₹ 2,187.10 (low) to ₹ 2,225.90 (high).
Recent price hovering around ₹ 2,213-2,225 region.
52-week range: ~ ₹ 1,900 (low) to ₹ 3,015.90 (high).
🔍 Key Levels to Watch (1-Day)
Support zone: The lower end of today’s range (~ ₹ 2,187) acts as immediate support. If price falls below this, short-term weakness may show up.
Resistance zone: The upper end (~ ₹ 2,225-2,226) is the immediate intraday resistance. A clean breakout above this with volume could open a momentum leg.
Mid-range pivot: Around ~ ₹ 2,210-2,220 could act as a pivot region — price consolidating here may indicate indecision before a directional move.
If breakout up: If price breaks above ~ ₹ 2,225 with conviction, next upside may target maybe ~ ₹ 2,250-2,270 (intraday extension zone) though this requires confirmation.
If breakdown: If price drops below ~ ₹ 2,187, downside could test prior support zones (which might lie closer to ~ ₹ 2,150-2,160 based on recent history) though I don’t have that exact level today.
✅ Possible Intraday Setups
Long (buy) setup: Wait for price to break above resistance (~ ₹ 2,225) with strong volume → enter long with stop just below pivot (~ ₹ 2,210) → target near ~ ₹ 2,250-2,270.
Short (sell) setup: If price drops and closes below support (~ ₹ 2,187) and shows weakness → enter short with stop just above pivot (~ ₹ 2,210) → target maybe ~ ₹ 2,150-2,160.
Range trade: If price stays between support and resistance (₹ 2,187-₹ 2,225) → consider trading the range: buy near support, sell near resistance, with tight risk control.