Divergence Secrets How Option Pricing Works
The price (premium) of an option is influenced by several factors, collectively known as the “Option Greeks”:
Delta: Measures how much the option price changes with a ₹1 change in the underlying asset.
Gamma: Indicates the rate of change of Delta.
Theta: Represents the time decay of the option’s value as it approaches expiry.
Vega: Measures sensitivity to volatility.
Rho: Indicates sensitivity to interest rate changes.
Additionally, the volatility of the underlying asset and time to expiry play crucial roles in determining option prices. Higher volatility increases the premium, as uncertainty boosts the potential for profit.
Trend Lines

Option TradingTypes of Options: Calls and Puts
Options are divided into two main categories:
Call Options: The buyer of a call expects the underlying asset’s price to rise. For example, if a trader buys a call option on Reliance stock with a strike price of ₹2500, and the stock rises to ₹2600 before expiry, the trader can exercise the option and profit from the difference.
Put Options: The buyer of a put expects the asset’s price to fall. If the same Reliance stock falls to ₹2400, the put option buyer profits by selling at ₹2500 (the strike price).
Call and put options can be used separately or in combination to create complex strategies based on different market conditions.

Part 2 Support and Resistance Key Terminologies in Option Trading
To understand options, it’s important to know certain key terms:
Underlying Asset: The financial instrument on which the option is based (e.g., a stock like TCS or an index like NIFTY50).
Strike Price: The price at which the holder can buy (call) or sell (put) the asset.
Premium: The price paid by the buyer to acquire the option contract.
Expiry Date: The last date on which the option can be exercised.
In the Money (ITM): When exercising the option is profitable (e.g., for a call option, when the market price is above the strike price).
Out of the Money (OTM): When exercising the option would not be profitable.
At the Money (ATM): When the strike price and market price are almost equal.
Understanding these terms is essential for evaluating an option’s value and potential profit or loss.

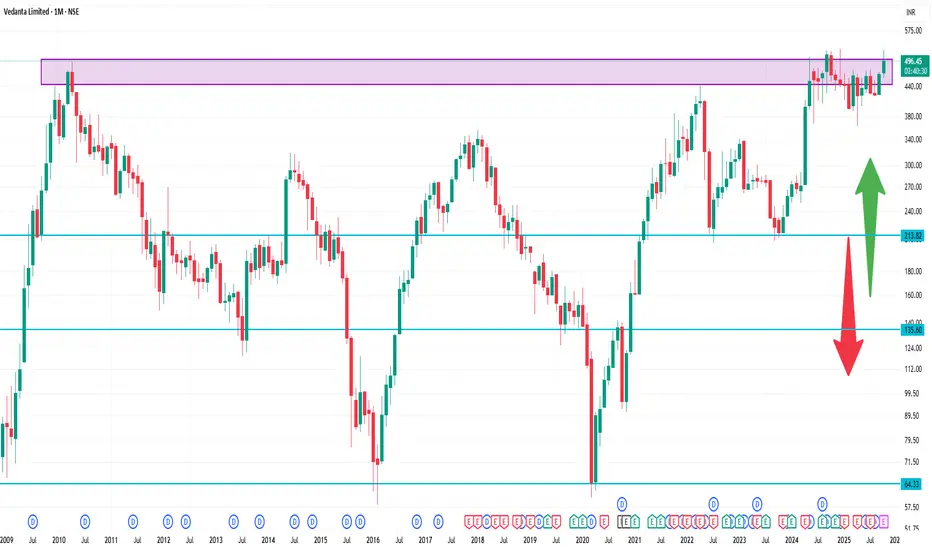
VEDL 1 Month Time Frame 🧭 Key levels to watch in the next ~4-5 weeks
Here are support and resistance levels relevant for the 1-month horizon:
🔷 Resistance
~ ₹501.40 — Monthly pivot/standard resistance level.
More immediate short-term resistance around ~ ₹497-₹500 zone based on recent highs.
🔻 Support
First key support around ~ ₹473.90 (short-term support) per technical charting site.
Secondary support near ~ ₹447.95 zone (medium term) per same source.
On a deeper drop scenario, support near ~ ₹380.15 (longer-term major support) is listed.
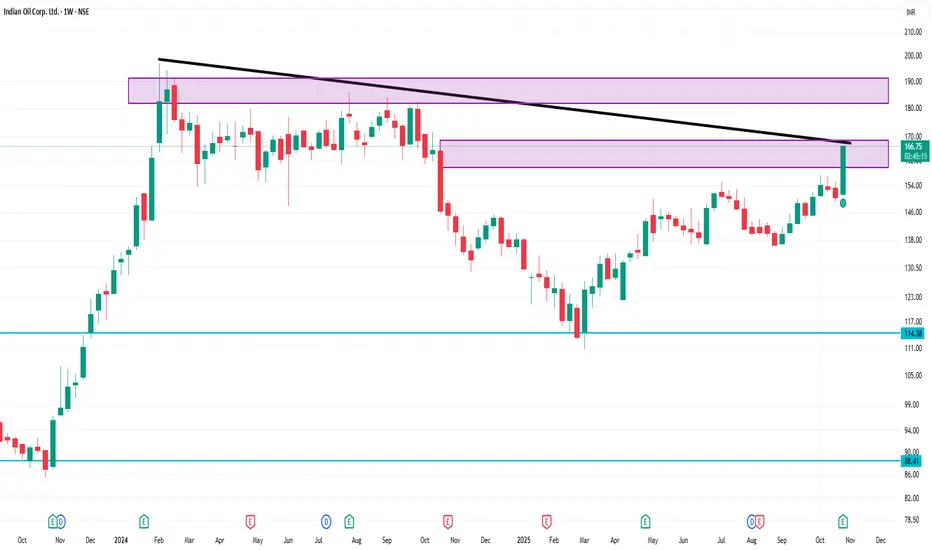
IOC 1 Week Time Frame 📍 Key Levels to Monitor (weekly chart)
Support zone: ~ ₹150-155. This is a region where past moving averages / consolidation occurred (also near 200-week MA).
Near-term support: ~ ₹160. If price dips, watch for reaction around this level.
Resistance / breakout area: ~ ₹166-170. Past highs / pivot region. If price convincingly breaks above this with volume, higher targets could be triggered. In the daily technicals, pivot-classic R1 ~ ₹166.54.
Next upside potential: If breakout happens, next zone maybe ~ ₹175-180 (psychological+historic highs) — but only once structure is confirmed.
Risk trigger: A close below ~ ₹150 might shift trend bias to more neutral/weak.
LUPIN 1 Hour Time Frame📊 Key Levels (1-Hour Timeframe)
Here are rough levels to watch on an intraday/trading base:
Resistance / supply zone: ~ ₹1,970 to ₹2,000
Immediate resistance: ~ ₹1,955 to ₹1,970
Pivot–mid zone: ~ ₹1,920 to ₹1,940
Support / demand zone: ~ ₹1,880 to ₹1,900
Stronger support: ~ ₹1,850 to ₹1,870

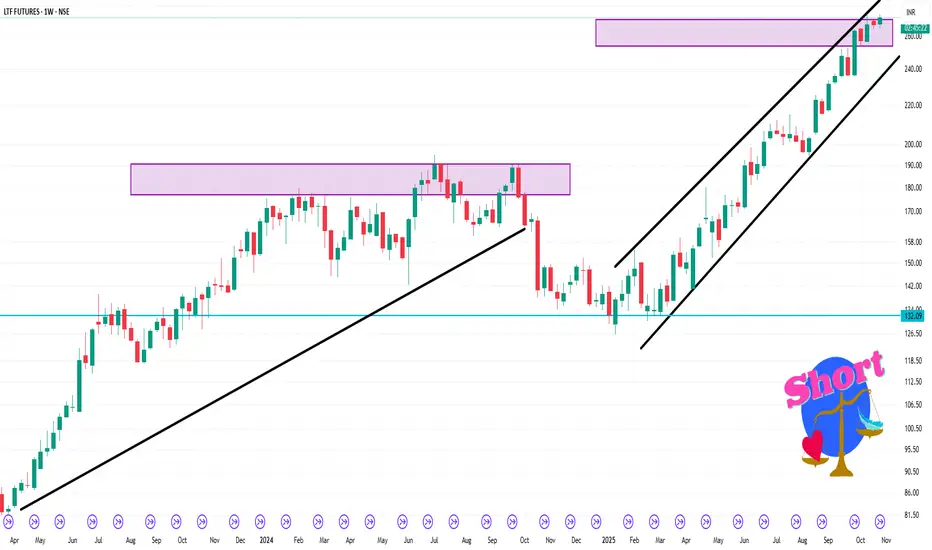
LTF 1 Week Time Frame ✅ Key Levels to Watch
Support around ₹ 265-270, which has been noted as a level where price “is above … and as long as price remains above this level, the up-trend … might continue.”
Current futures price in the recent contract is approximately ₹ 271-273.
A potential upside breakout target (if momentum continues) could be near its 52-week high of ~ ₹ 273.57.
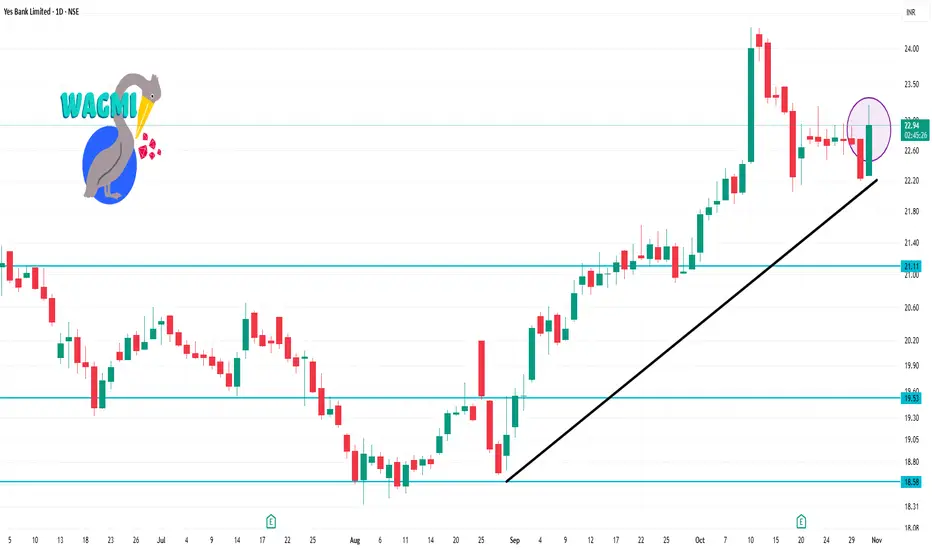
YESBANK 1 Day Time Frame ✅ Key Technical Levels & Indicators
Recent price around ₹22.60–₹22.70.
Support zones: ~ ₹22.22 (short term) and ~ ₹20.97 (medium term) according to MarketScreener.
Resistance: ~ ₹24.03 region.
Pivot (classic) for the day: ~ ₹22.58.
Daily technical indicator summary: Many moving averages show bullish (price above SMA/EMA) for 20/50/200 day on some sites.
Oscillators: RSI in mid-range (~46.6) signalling neither strongly overbought nor oversold.
Short-term trend: Many tools flag “bullish” in short, medium and long term.
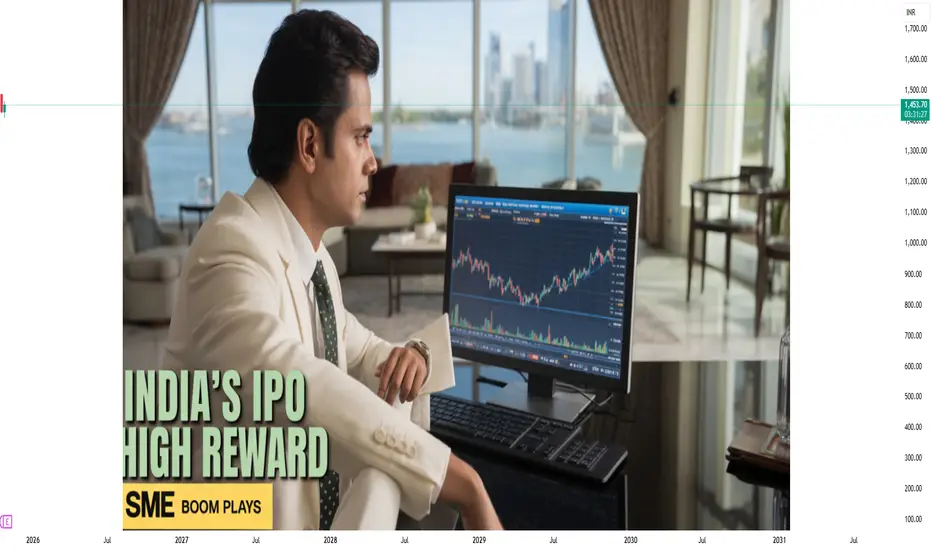
Future Outlook: Sustaining the IPO and SME Momentum1. The Current Landscape: A Golden Era of Listings
Over the last few years, India’s IPO market has seen an unprecedented rise in activity. From digital-first startups to traditional manufacturers, companies of all sizes have turned to public markets to raise growth capital. The mainboard has been dominated by big-ticket issues from established corporations, while the SME segment—once overlooked—has emerged as a thriving hub of entrepreneurial listings.
According to data from stock exchanges, the SME IPO segment alone has outperformed expectations, with subscription levels often reaching several hundred times the offer size. The growing investor base, increased participation of retail and HNI investors, and digital platforms simplifying IPO applications have all contributed to this boom.
For SMEs, going public is not just about capital—it is a signal of credibility and stability. Listing on the NSE Emerge or BSE SME platforms allows smaller firms to attract investors, improve transparency, and access long-term funding that can drive business expansion.
2. Drivers Behind the IPO and SME Boom
Several macroeconomic and structural factors have contributed to the ongoing surge:
a. Economic Growth and Confidence
India’s steady GDP growth, expanding middle class, and digital transformation have fostered an environment where both investors and businesses feel optimistic about the future. Companies view the stock market as a vital source of capital, while investors see it as a means to participate in the nation’s growth story.
b. Regulatory Support
The Securities and Exchange Board of India (SEBI) has played a pivotal role by introducing reforms to streamline IPO processes, enhance disclosure norms, and strengthen investor protection. The SME platform, in particular, was designed to give smaller businesses a simplified path to listing without the burden of excessive compliance.
c. Retail Investor Participation
A massive influx of new retail investors, driven by fintech innovations and easy access to trading apps, has transformed the market landscape. The democratization of stock investing has increased demand for new IPOs, especially those offering early-stage growth potential.
d. Favorable Liquidity and Low Interest Rates
In recent years, global liquidity and relatively low domestic interest rates have made equities a preferred asset class. Investors, in search of better returns, have flocked to IPOs—especially those showing strong fundamentals and growth prospects.
e. Rise of Domestic Institutional Investors
Domestic mutual funds, insurance companies, and pension funds have become significant participants in IPOs, lending stability and depth to the market. Their involvement ensures that quality issues receive sustained institutional backing.
3. The SME Edge: Empowering Grassroots Entrepreneurship
The SME platform is not just a mini version of the mainboard—it is a catalyst for grassroots economic growth. For small and medium enterprises, traditional financing options like bank loans are often limited due to lack of collateral or credit history. IPOs provide an alternative route to raise equity without diluting too much control or taking on debt.
Moreover, SMEs listed on the exchange gain visibility, attract partnerships, and establish brand credibility. Sectors such as manufacturing, IT services, pharmaceuticals, textiles, and renewable energy have been particularly active in this space.
The success of SME IPOs also reflects a shift in investor mindset. Investors are no longer solely focused on large-cap blue chips—they are now looking for early-stage growth stories that can multiply wealth over time. This behavioral change is instrumental in sustaining the SME ecosystem.
4. Challenges That Could Test the Momentum
While the outlook appears promising, sustaining the current momentum will not be without challenges.
a. Market Overvaluation
A surge in IPOs often brings with it concerns about inflated valuations. Companies may take advantage of bullish sentiment to price their offerings aggressively, leaving little room for post-listing gains. If too many IPOs underperform after listing, investor confidence can quickly erode.
b. Quality and Governance Concerns
Not all SMEs meet high corporate governance standards. Weak accounting practices, lack of transparency, or promoter-driven decision-making can hurt long-term investor trust. Regulators and exchanges need to ensure strict eligibility norms and monitoring.
c. Investor Overexuberance
Retail investors sometimes chase IPOs purely for short-term listing gains rather than evaluating fundamentals. This speculative behavior can lead to volatility and mispricing, potentially distorting the true value of companies.
d. Global Economic Uncertainty
External shocks—like rising oil prices, interest rate hikes in developed markets, or geopolitical tensions—can impact foreign inflows and dampen market sentiment. The IPO market, being sentiment-driven, is highly sensitive to such macro events.
e. Liquidity Constraints in SME Segment
Despite high subscription levels, secondary market liquidity in SME stocks remains limited. Thin trading volumes can make price discovery difficult, deterring institutional investors from entering the space.
5. The Role of Policy and Regulation in Sustaining Growth
To maintain the momentum in the IPO and SME markets, regulatory foresight and market discipline are crucial.
a. Strengthening Disclosure Norms
SEBI and stock exchanges must continue refining disclosure requirements, ensuring that companies provide detailed, accurate, and timely information. This helps investors make informed decisions and reduces the risk of mispricing.
b. Enhancing Market Infrastructure
Encouraging more market makers, improving liquidity mechanisms, and enabling seamless migration from SME platforms to the mainboard can sustain investor confidence and ensure market depth.
c. Investor Education
Empowering retail investors through awareness programs about risk management, valuation analysis, and long-term investing can reduce speculative tendencies. Financial literacy is vital for a healthy IPO ecosystem.
d. Supporting SME Ecosystem Development
Beyond listing, SMEs require policy support in areas like taxation, innovation funding, and export facilitation. A holistic ecosystem that nurtures entrepreneurship will naturally feed into the SME IPO pipeline.
6. Technological and Digital Innovations: The New Growth Lever
Technology is transforming how IPOs are managed, subscribed, and analyzed. Online platforms and digital brokers now enable seamless IPO participation with UPI integration, faster refunds, and transparent allotment processes.
Moreover, data analytics and AI-driven investment tools are helping investors assess company fundamentals more efficiently.
In the SME segment, digital transformation is allowing small firms to manage compliance, financial reporting, and investor relations more effectively. Blockchain-based record-keeping and e-KYC systems are further reducing operational risks and increasing trust in market systems.
As India continues to digitalize, technology will remain a cornerstone of the IPO ecosystem—driving transparency, reducing costs, and expanding investor access.
7. The Road Ahead: Building Sustainable Growth
Sustaining the IPO and SME momentum requires balance. A mature market is not one that constantly breaks records in listing numbers—but one that ensures the right companies, backed by solid fundamentals, reach investors at the right valuations.
a. Quality over Quantity
Regulators, underwriters, and exchanges should prioritize quality listings over mere volume. Encouraging companies with strong governance, profitability, and long-term growth potential ensures the integrity of the market.
b. Encouraging Long-Term Investment
Tax incentives or special frameworks for long-term investors in SMEs could encourage patient capital. Such measures can stabilize prices and encourage genuine ownership rather than speculative flipping.
c. ESG and Sustainability Focus
As global investors increasingly emphasize Environmental, Social, and Governance (ESG) factors, Indian IPOs and SMEs must align with these trends. Companies that adopt sustainable practices are more likely to attract foreign institutional capital.
d. Regional and Sectoral Diversification
Encouraging listings from tier-2 and tier-3 cities, as well as from sunrise sectors such as green energy, electric mobility, and digital infrastructure, can diversify the IPO landscape. This not only broadens economic participation but also decentralizes wealth creation.
8. Global Lessons: Learning from Mature Markets
India can draw valuable insights from global markets like the U.S. NASDAQ or Japan’s JASDAQ, where smaller enterprises have long leveraged capital markets for growth. These platforms emphasize strict listing standards, investor transparency, and efficient migration to larger exchanges.
Adopting similar best practices can strengthen India’s SME framework, making it globally competitive. Moreover, cross-border listings or foreign investor participation in SMEs can provide additional depth and capital flow.
9. Investor Sentiment and the Cycle of Confidence
At the heart of every IPO wave lies investor sentiment. Confidence breeds participation, and participation fuels growth. As long as investors continue to see tangible value creation—through robust earnings, transparent management, and steady post-listing performance—the momentum will sustain.
However, maintaining this sentiment requires market discipline. Regulators must curb speculative excesses, companies must deliver on promises, and investors must remain rational and informed.
10. Conclusion: The Path to a Resilient IPO and SME Ecosystem
The future of India’s IPO and SME markets is undoubtedly bright, but sustaining their growth demands maturity and foresight. The foundation has been laid—a dynamic entrepreneurial ecosystem, supportive regulations, and a digitally empowered investor base. The next phase must focus on strengthening fundamentals, promoting transparency, and fostering long-term value creation.
If India continues to blend innovation with discipline, its capital markets could evolve into one of the most robust and inclusive ecosystems globally. The IPO and SME momentum, therefore, is not just a passing phase—it represents the evolution of India’s financial identity, empowering both enterprises and investors to participate in the country’s growth journey.
The challenge ahead lies not in maintaining speed, but in ensuring direction—toward a sustainable, transparent, and inclusive market that stands the test of time.
The New Era of India’s Market BoomIntroduction: India’s Economic Renaissance
India’s financial markets are witnessing a remarkable transformation, marking the beginning of a new era of growth, resilience, and opportunity. From a developing economy once dependent on global cues, India has evolved into one of the world’s most attractive investment destinations. The “New Era” of India’s market boom is not just about record-breaking indices or surging foreign investments; it reflects the nation’s structural strength, demographic power, and digital transformation driving long-term wealth creation.
This boom represents the confluence of policy reforms, entrepreneurial innovation, and investor confidence — a cycle that has redefined how both domestic and international participants view India’s economic potential.
1. The Evolution of India’s Market Landscape
India’s journey from a closed, regulated economy in the 1980s to one of the most vibrant capital markets globally has been extraordinary. Liberalization in 1991 opened the doors to foreign investment, privatization, and global integration. Over the last decade, successive reforms — such as GST, the Insolvency and Bankruptcy Code (IBC), and Make in India — have further streamlined business operations and enhanced transparency.
The equity markets have mirrored this evolution. The BSE Sensex and NSE Nifty have grown exponentially, attracting both institutional and retail investors. Market participation has broadened beyond major cities, with millions of first-time investors joining via digital platforms. India’s financial system now stands on robust pillars of technology, regulation, and liquidity — key ingredients of sustainable growth.
2. Structural Drivers Behind the Boom
Several underlying factors have fueled India’s market resurgence. These are not temporary catalysts but foundational shifts that ensure longevity in growth momentum.
a. Demographic Dividend
India’s young population — with a median age of just 28 — offers a unique consumption and productivity advantage. A growing workforce means more income, savings, and investments, leading to strong domestic demand. As the middle class expands, so does spending on housing, automobiles, insurance, and financial products — creating ripple effects across sectors.
b. Policy Reforms and Governance
Government reforms have created an ecosystem conducive to business expansion and capital formation. Initiatives like “Digital India,” “Atmanirbhar Bharat,” and “Production-Linked Incentive (PLI)” schemes have modernized industries, encouraged manufacturing, and boosted exports. Moreover, greater emphasis on infrastructure spending and fiscal prudence has improved investor trust.
c. Technological Advancement and Fintech Revolution
India’s fintech and digital payment ecosystem is among the most advanced in the world. With platforms like UPI, IndiaStack, and online brokerage systems, access to financial markets has become seamless. This democratization of investing has brought millions of retail investors into the equity and mutual fund space, creating a stable and long-term domestic investor base.
d. Robust Corporate Earnings
Corporate India has shown consistent earnings growth post-pandemic, supported by strong demand recovery, operational efficiency, and deleveraged balance sheets. Key sectors like banking, infrastructure, IT, and energy have recorded record profits, signaling economic health and boosting market confidence.
3. Domestic Liquidity: The Silent Market Force
One of the most powerful trends driving the current market boom is domestic liquidity. Traditionally, India’s markets were heavily influenced by Foreign Institutional Investors (FIIs). However, today, Domestic Institutional Investors (DIIs) and retail investors have become a counterbalancing force.
Mutual funds, insurance companies, and retail investors now account for a large share of market participation. The Systematic Investment Plan (SIP) revolution has created a steady inflow of funds into equities every month, insulating markets from global volatility. As of 2025, India records monthly SIP inflows exceeding ₹20,000 crore — an unprecedented level that showcases the maturity and confidence of domestic investors.
4. India in the Global Investment Map
Global investors increasingly see India as a structural growth story rather than a cyclical opportunity. Amid global economic uncertainty, geopolitical tensions, and slowing growth in China, India stands out as a stable and promising alternative.
Multinational corporations are shifting their supply chains towards India, recognizing it as a key hub for manufacturing, software services, and renewable energy. According to global reports, India is projected to contribute nearly 15% of global GDP growth over the next decade — a testament to its rising influence.
India’s inclusion in global bond indices, strong foreign exchange reserves, and stable macroeconomic indicators further enhance its attractiveness. The country’s financial depth and transparency have reached levels where foreign investors view it as a strategic, not speculative, bet.
5. Sectoral Catalysts Powering the Boom
The market rally is not uniform; it’s powered by diverse sectors that reflect India’s structural evolution.
a. Banking and Financial Services
Banks and NBFCs have emerged stronger after years of consolidation and balance sheet clean-up. With credit growth exceeding 15% annually, financial institutions are well-positioned to drive economic expansion. Digital banking and fintech integration have enhanced efficiency and accessibility.
b. Infrastructure and Real Estate
The government’s focus on roads, logistics, and housing has triggered a boom in infrastructure-related stocks. Real estate, once stagnant, is witnessing a revival fueled by rising incomes, affordable loans, and urbanization. The “Housing for All” and Smart City initiatives continue to boost construction demand.
c. Information Technology and Digital Transformation
Indian IT companies remain global leaders in software services, but the narrative is expanding toward digital transformation, cloud computing, AI, and cybersecurity. The export-driven IT sector provides stability, while emerging startups add dynamism to the digital economy.
d. Manufacturing and Make in India
The PLI scheme has revitalized domestic manufacturing across electronics, automobiles, and defense. India is becoming a preferred base for smartphone assembly, electric vehicle production, and renewable energy components — reducing dependence on imports and creating jobs.
e. Energy and Sustainability
India’s ambitious renewable energy goals — including its target of achieving 500 GW of renewable capacity by 2030 — have created investment opportunities in solar, wind, and green hydrogen. Energy transition is now a central pillar of India’s economic strategy.
6. The Rise of Retail Investors
Perhaps the most defining feature of this new era is the participation of retail investors. Over 13 crore Demat accounts in India signify a paradigm shift in how citizens perceive wealth creation. Digital platforms, financial literacy drives, and social media education have made investing accessible to all.
Retail investors are no longer passive participants. They follow market data, understand technical trends, and use tools like volume profile and market structure analysis to make informed decisions. This behavioral shift has made the market more resilient and diversified.
7. Market Valuations and Sustainability
While valuations in some sectors have stretched due to optimism, the long-term sustainability of India’s market boom lies in its fundamentals. Corporate earnings, policy support, and demographic trends back this growth. Unlike speculative bubbles, this phase is characterized by real economic expansion and disciplined monetary management.
The Reserve Bank of India (RBI) has maintained a balanced stance, ensuring inflation remains within target while supporting credit growth. Fiscal discipline and a focus on infrastructure spending further strengthen the macroeconomic framework.
However, investors must remain cautious of short-term corrections. Market booms often invite volatility, but corrections are natural and healthy in a long-term growth cycle. The key lies in diversification and maintaining a long-term investment perspective.
8. The Digital Edge: A Catalyst for Market Expansion
India’s digital economy — valued at over $200 billion and growing rapidly — acts as a backbone for its market expansion. Online trading apps, mobile banking, and AI-driven analytics have revolutionized how people invest. Data transparency and real-time access to markets have reduced barriers and increased participation.
Artificial intelligence and machine learning tools are now helping investors analyze sentiment, predict price movements, and optimize portfolios — reflecting how technology is reshaping traditional finance. This digital momentum is expected to continue driving market depth and efficiency.
9. Challenges and Global Dependencies
While India’s market boom looks unstoppable, it is not without challenges. Global factors such as oil prices, geopolitical tensions, and currency fluctuations can influence sentiment. A slowdown in exports or global demand may temporarily affect sectors like IT and manufacturing.
Domestically, maintaining inflation control, ensuring job creation, and sustaining credit discipline are crucial. Regulatory oversight will play a vital role in protecting investors and preserving market integrity amid rapid expansion.
10. The Road Ahead: A Decade of Transformation
India’s next decade promises to be transformative. With a GDP growth trajectory expected to average 6.5–7%, India could become the third-largest economy in the world by 2030. This economic ascent will be mirrored in its capital markets — with more IPOs, deeper derivatives markets, and greater global integration.
The ongoing listing of startups and SMEs also reflects India’s entrepreneurial vibrancy. As innovation meets capital, the ecosystem will nurture global-scale companies across tech, renewable energy, and financial services.
Conclusion: The Dawn of a New Financial Future
The new era of India’s market boom is not just a cyclical uptrend — it’s a structural evolution of an economy maturing into a global powerhouse. Driven by reforms, demographics, technology, and investor confidence, India’s markets represent a story of resilience and renewal.
This transformation signifies more than rising indices — it symbolizes India’s emergence as a self-reliant, investment-driven, and globally respected economy. As the world rebalances its economic priorities, India’s capital markets stand tall — not as a follower, but as a leader shaping the next chapter of global financial history.

Impact of Macro Events on Financial MarketsIntroduction
Financial markets are highly sensitive ecosystems that respond to a wide range of macroeconomic events. These events — such as changes in inflation, interest rates, GDP growth, geopolitical tensions, trade policies, or natural disasters — influence the way investors perceive risk and return. In simple terms, macro events set the tone of the market. They shape investor confidence, capital flows, and ultimately determine the direction of asset prices across equities, bonds, currencies, and commodities.
Understanding how macro events move markets is essential for traders, investors, and policymakers. This knowledge allows them to anticipate volatility, manage risk, and make informed decisions in a constantly changing global environment.
1. What Are Macro Events?
Macro events are large-scale economic or geopolitical developments that affect the overall economy rather than individual companies or sectors. These can be economic, political, or environmental in nature. Examples include:
Central bank monetary policy decisions (like interest rate hikes or cuts)
Fiscal policies (government spending and taxation)
Inflation and unemployment data releases
Global trade agreements or disputes
Natural disasters or pandemics
Political instability or wars
Technological disruptions or regulatory reforms
Each of these events sends ripples through financial systems — influencing investor sentiment, liquidity, and valuation across global markets.
2. The Economic Indicators That Drive Market Sentiment
Economic indicators are the heartbeat of financial markets. Investors closely monitor data releases to gauge the health of the economy and anticipate future policy moves. Some key indicators include:
a. Gross Domestic Product (GDP)
GDP growth signals the strength of an economy.
Rising GDP usually means higher corporate profits and stock market optimism.
Falling GDP or recessionary signs can push investors toward safer assets like government bonds or gold.
b. Inflation
Inflation reflects the general rise in prices of goods and services.
High inflation erodes purchasing power and prompts central banks to raise interest rates.
Low inflation can indicate weak demand and slow growth.
Both extremes can unsettle investors, as they affect future earnings and the cost of borrowing.
c. Interest Rates
Interest rate changes are one of the most direct macroeconomic influences on markets.
Rising rates make borrowing costlier and reduce the appeal of riskier assets like equities.
Falling rates encourage investment and consumption, often boosting stock prices.
d. Employment Data
Strong employment reports signal a healthy economy, but they can also increase fears of inflation and potential rate hikes. Weak job data, on the other hand, can trigger fears of slowdown but also raise expectations for policy support.
e. Consumer Confidence
This measures how optimistic consumers are about their financial situation and the overall economy. High confidence supports spending and market growth, while low confidence can lead to declines in demand and market pessimism.
3. Central Banks and Monetary Policy
The role of central banks — such as the U.S. Federal Reserve, European Central Bank (ECB), or the Reserve Bank of India (RBI) — cannot be overstated. Through monetary policy tools, they control liquidity and influence interest rates, inflation, and currency value.
Tight Monetary Policy: When inflation rises, central banks often raise interest rates or reduce liquidity. This makes credit more expensive, curbing excessive speculation. Equity markets typically react negatively as borrowing costs rise and corporate profits shrink.
Loose Monetary Policy: When economic growth slows, central banks lower interest rates or engage in quantitative easing (injecting liquidity into the system). This usually boosts market sentiment, as investors chase higher returns in equities and other risk assets.
For instance, the U.S. Federal Reserve’s aggressive rate hikes in 2022 to combat inflation triggered global stock market corrections and strengthened the U.S. dollar — affecting emerging market currencies and global capital flows.
4. Fiscal Policy and Its Market Impact
While central banks handle monetary policy, governments influence markets through fiscal policy — by adjusting taxation and spending.
Expansionary Fiscal Policy: Increased government spending or tax cuts boost economic activity and corporate earnings, supporting stock markets. However, if excessive, it can cause inflation and fiscal deficits.
Contractionary Fiscal Policy: Higher taxes or reduced spending can slow growth but help control inflation or reduce debt.
For example, massive fiscal stimulus packages during the COVID-19 pandemic (2020–2021) helped economies recover quickly but later contributed to inflationary pressures that shook global markets in 2022.
5. Geopolitical Events and Market Reactions
Political instability, wars, or trade conflicts create uncertainty, one of the biggest enemies of market stability.
Wars and Conflicts: Geopolitical tensions can disrupt global supply chains, raise commodity prices (especially oil), and trigger risk aversion.
Trade Wars: The U.S.-China trade war (2018–2019) is a prime example — tariffs and export restrictions hurt corporate earnings, global trade, and investor confidence.
Elections: Markets often react strongly to election outcomes that could change fiscal or regulatory policies.
Investors usually flock to safe-haven assets such as gold, the U.S. dollar, or government bonds during such uncertain times.
6. The Role of Globalization and Cross-Market Connections
Today’s markets are deeply interconnected. A macro event in one country can quickly spread across borders through trade, investment, and capital flows.
For instance:
A slowdown in China’s manufacturing sector affects global commodity prices, impacting countries like Australia, Brazil, and India.
U.S. Federal Reserve policies influence currency and bond markets worldwide, especially in emerging economies dependent on foreign capital.
This interconnection means that investors must think globally — not just about domestic events — to understand market dynamics.
7. Natural Disasters and Pandemics
Events such as earthquakes, floods, or pandemics can have both short-term shocks and long-term consequences on financial markets.
The COVID-19 pandemic caused one of the fastest global market crashes in March 2020 as lockdowns halted economic activity. However, extraordinary monetary and fiscal support led to one of the strongest bull runs soon after.
Similarly, natural disasters can disrupt industries (like agriculture or energy) and affect insurance, logistics, and infrastructure-related stocks.
These events highlight how market resilience and adaptability are tested in the face of global crises.
8. Commodity Prices and Currency Movements
Commodities and currencies are heavily influenced by macroeconomic events:
Oil Prices: Rising oil prices due to geopolitical tensions or supply shortages increase production costs and inflation, hurting equity markets but benefiting energy stocks.
Gold: Acts as a safe haven during economic or political uncertainty.
Currency Fluctuations: A strong domestic currency can hurt exporters but benefit importers. Conversely, a weak currency boosts exports but raises inflation.
For example, the sharp fall in the Indian rupee during periods of rising U.S. interest rates often leads to foreign outflows from Indian equities as investors seek safety in the dollar.
9. Investor Psychology and Behavioral Shifts
Beyond economic logic, human behavior magnifies the effects of macro events.
Markets are driven by fear and greed. When macro events introduce uncertainty, panic selling or herd behavior can exaggerate price swings.
Overreaction: Investors might sell off stocks excessively during economic shocks.
Euphoria: During periods of economic optimism, investors might ignore risks and inflate asset bubbles.
Understanding behavioral finance helps explain why markets sometimes react irrationally to macro news — moving far more than economic fundamentals justify.
10. Technological and Structural Changes
Technological disruptions and financial innovations also qualify as macro events when they reshape entire industries or economic systems.
Fintech and digital currencies have changed how money flows globally.
AI-driven automation affects employment and productivity patterns.
Energy transitions toward renewables influence oil markets and corporate investments.
Each structural shift creates new winners and losers in financial markets, altering the global investment landscape.
11. Case Studies: Macro Events and Market Impact
a. The 2008 Global Financial Crisis
Triggered by the U.S. housing bubble and subprime mortgage defaults, it caused massive global market crashes. Investors fled risky assets, and central banks worldwide adopted unprecedented stimulus policies. This event reshaped global financial regulation and risk management practices.
b. COVID-19 Pandemic (2020)
Markets plunged amid lockdowns, but aggressive fiscal and monetary stimulus soon led to a historic recovery. It demonstrated how quickly policy responses can stabilize markets during crises.
c. Russia-Ukraine War (2022)
The conflict disrupted global energy and grain supplies, spiking inflation worldwide. This led to tighter monetary policies globally and a volatile year for equities and bonds.
Each of these examples shows that macro events can both destroy and create market opportunities, depending on investor perception and timing.
12. How Traders and Investors Adapt
To navigate macro-driven markets, professionals use several strategies:
Diversification: Spreading investments across asset classes and geographies reduces exposure to single-event shocks.
Hedging: Using derivatives (like futures or options) to protect portfolios against adverse moves.
Top-down Analysis: Starting from macroeconomic trends to identify sectors and stocks likely to perform well.
Safe-haven Allocation: Holding assets like gold, U.S. Treasuries, or defensive stocks during uncertain times.
Understanding macro trends helps investors stay proactive rather than reactive.
13. The Role of Communication and Expectations
Sometimes, markets move not because of actual events, but because of expectations.
For example:
A central bank hinting at future rate hikes can move bond yields and stock prices even before the actual policy change.
Similarly, forward guidance from policymakers shapes how investors position themselves.
This psychological and anticipatory nature of markets means that information — not just action — can be a macro driver.
Conclusion
Macro events are the invisible hands guiding the pulse of global financial markets. Whether it’s a shift in central bank policy, a geopolitical crisis, or a breakthrough in technology, these forces determine how capital flows, how risk is priced, and how investors behave.
The ability to interpret macro signals and their potential ripple effects is what separates informed investors from the rest. In a world where markets are more interconnected than ever, no event occurs in isolation. Each policy decision, conflict, or data release sends waves across borders, influencing billions of dollars in market value within seconds.
Ultimately, understanding macro events is not just about predicting price movements — it’s about grasping how the global financial system breathes, reacts, and evolves in response to the constant rhythm of change.

The Rise of Jane Street in Global Finance1. Origins: A Humble Beginning with a Big Vision
Jane Street was founded in 2000 by a small group of traders — Tim Reynolds, Rob Granieri, Marc Gerstein, and Michael Jenkins — with a bold idea: to apply quantitative methods and technology-driven strategies to global trading. What set them apart from the start was their belief that trading was not just about speculation, but about solving complex mathematical problems efficiently.
Starting from a single office in New York City, the firm initially focused on exchange-traded funds (ETFs) — a market that was then in its infancy. ETFs were relatively new instruments, combining the flexibility of stock trading with the diversification of mutual funds. Many financial institutions did not yet understand their pricing complexities, but Jane Street’s founders recognized a goldmine of opportunity in the arbitrage and market-making potential of ETFs.
Through deep statistical analysis, coding expertise, and mathematical precision, Jane Street became one of the first firms to specialize in ETF arbitrage, helping create fair prices and efficient markets for these instruments.
2. Building the Quantitative Core
While most traditional Wall Street firms relied on intuition, experience, and aggressive speculation, Jane Street built its identity around quantitative rigor. Every trading decision was backed by data, models, and algorithms rather than mere hunches.
The firm recruited heavily from top universities, hiring mathematicians, physicists, and computer scientists instead of traditional finance professionals. This helped create a culture that was more akin to a research lab than a typical trading floor.
The use of probabilistic modeling, machine learning, and statistical arbitrage allowed Jane Street to find small inefficiencies in markets across thousands of instruments — equities, bonds, currencies, and derivatives — and trade them profitably.
What truly distinguished Jane Street was its technology-first philosophy. The company built nearly all its systems in-house, ensuring tight control, low latency, and adaptability. Its trading infrastructure allowed for lightning-fast execution — critical in markets where prices change in microseconds.
3. Mastering ETF Trading and Market Making
Jane Street’s early specialization in ETFs paid off enormously. As ETFs exploded in popularity worldwide, the firm became one of the largest ETF liquidity providers globally.
By constantly quoting buy and sell prices, Jane Street played a key role in ensuring that ETFs traded smoothly, even during volatile market conditions. It became the “invisible hand” behind countless trades — earning small margins but at massive volume.
During major market events, such as the 2008 financial crisis and the COVID-19 pandemic, Jane Street’s market-making capabilities were crucial in maintaining stability and liquidity. While many financial institutions pulled back, Jane Street stepped in — buying when others were fearful, providing prices when markets froze, and helping ensure continuous trading.
Their performance during crises cemented their reputation as a reliable backbone of modern markets.
4. Expansion into Global Markets
After conquering ETF trading, Jane Street expanded aggressively into new asset classes and regions. Offices were established in London, Hong Kong, and Amsterdam, transforming the firm into a truly global powerhouse.
The firm’s trading universe now includes:
Equities and ETFs across every major exchange
Fixed income instruments such as bonds and treasuries
Commodities and energy derivatives
Currencies (FX) and cryptocurrencies
Options and futures across various asset classes
Despite this diversification, Jane Street maintained a disciplined approach — only entering markets where its data-driven methods could yield a sustainable edge.
The company also became known for its cross-asset trading strategies — using correlations between asset classes to identify opportunities. For instance, changes in bond yields could signal moves in currencies or equity sectors, allowing Jane Street to capture value across interconnected markets.
5. The Technology Advantage
Technology is the beating heart of Jane Street’s rise. The firm’s internal systems are highly sophisticated, capable of handling massive data volumes in real-time. Every aspect — from pricing models and risk management to communication tools — is custom-built.
Jane Street uses the programming language OCaml for most of its systems, which is unusual in finance. OCaml allows for functional programming, helping the firm maintain robust, error-resistant, and efficient codebases. This gives them a stability advantage over competitors using more traditional financial software stacks.
Moreover, the firm’s automation and low-latency trading systems enable it to make decisions and execute orders faster than the human eye can blink. Yet, unlike many high-frequency trading (HFT) firms, Jane Street avoids reckless speed races. Instead, it uses technology strategically — focusing on smart execution, risk-adjusted returns, and long-term sustainability rather than pure velocity.
6. Culture: Collaboration and Intellectual Rigor
One of Jane Street’s most defining characteristics is its culture. Unlike the cutthroat environment typical of Wall Street, Jane Street emphasizes collaboration, transparency, and intellectual curiosity.
There are no large egos or “star traders” — everyone is encouraged to question, debate, and improve processes collectively. Meetings are analytical discussions rather than emotional arguments. Success is attributed to teams, not individuals.
The firm also has a flat organizational structure, where even junior employees are encouraged to contribute ideas. This approach fosters creativity and innovation — allowing new strategies to emerge from any level of the company.
Employees describe the culture as “academic yet pragmatic,” where curiosity is celebrated, and errors are treated as learning opportunities. This philosophy has helped Jane Street maintain consistency even as it scaled into a global enterprise.
7. The Role in Modern Market Liquidity
In today’s interconnected global markets, liquidity providers like Jane Street play an indispensable role. They ensure that buyers and sellers can transact efficiently without large price disruptions.
Jane Street’s algorithms continuously analyze order books, macroeconomic trends, and microstructure signals to offer tight bid-ask spreads — meaning better pricing for all market participants.
As markets have become more fragmented, with trades spread across dozens of exchanges, Jane Street’s ability to aggregate and balance liquidity across them gives it an enormous competitive advantage.
It’s estimated that the firm now trades trillions of dollars’ worth of securities annually, often accounting for a significant share of ETF trading volume globally.
8. Moving into Fixed Income and Cryptocurrencies
While equities and ETFs remain its backbone, Jane Street has successfully diversified into fixed income and digital assets — two of the most complex trading domains.
In fixed income markets, the firm became a major player in US Treasuries, corporate bonds, and interest rate derivatives. Its data-driven methods allow it to handle the opacity and illiquidity typical of bond markets more efficiently than many traditional banks.
Jane Street’s move into cryptocurrencies was another milestone. Unlike many firms that viewed crypto as speculative, Jane Street approached it with the same quantitative precision it applies to any asset. By becoming an early market maker for Bitcoin ETFs and crypto derivatives, it helped bring institutional stability to digital asset markets.
This adaptability — the ability to understand and trade emerging asset classes — showcases why Jane Street continues to stay ahead of the curve.
9. Risk Management and Discipline
For all its success, Jane Street’s longevity is built on one thing above all: risk control.
The firm operates on the principle that surviving bad days is more important than maximizing profits on good ones. Every trade is evaluated not just for potential return, but for its risk-adjusted value.
Sophisticated real-time risk management systems continuously monitor the firm’s positions across all markets, ensuring exposure stays within carefully defined limits.
Jane Street famously avoids “directional bets.” It doesn’t try to predict where markets will go — instead, it focuses on relative value trading, capturing small inefficiencies that exist between related securities. This disciplined, non-speculative philosophy has kept the firm stable even during turbulent times.
10. Jane Street’s Role in the 21st-Century Market Ecosystem
Today, Jane Street is more than a trading firm — it is a systemic player in global finance. Its algorithms help maintain efficient pricing across continents, its liquidity keeps ETFs and bonds flowing smoothly, and its risk discipline serves as a model for modern financial engineering.
Unlike investment banks, Jane Street doesn’t advise clients or manage portfolios; its business model is purely trading-based. Yet its impact rivals that of major banks.
As markets become increasingly electronic, data-driven, and cross-asset, firms like Jane Street are shaping the future architecture of global finance — where human intuition and machine intelligence coexist in harmony.
11. The Legacy and the Road Ahead
Jane Street’s rise reflects a broader transformation in finance — the shift from intuition-driven trading to algorithmic precision. It represents how intellectual humility, technological excellence, and a focus on long-term sustainability can outperform greed and speculation.
As artificial intelligence, blockchain, and decentralized finance (DeFi) evolve, Jane Street’s future will likely involve deeper integration of AI-powered models, quantum computing simulations, and global regulatory engagement.
But if its history is any guide, the firm will continue to adapt — quietly, intelligently, and effectively — without the need for flashy publicity or loud declarations.
Conclusion
The story of Jane Street is not just the story of a trading firm; it’s a story about the evolution of modern finance itself.
From its origins in ETF arbitrage to becoming one of the most dominant forces in global liquidity, Jane Street has shown that success in markets today comes not from speculation but from discipline, technology, collaboration, and continuous learning.
It stands as a testament to what finance can achieve when math meets markets, when data meets discipline, and when humility meets innovation.
In a world that often celebrates noise, Jane Street thrives in silence — executing billions in trades daily, quietly shaping the very structure of the global financial system.

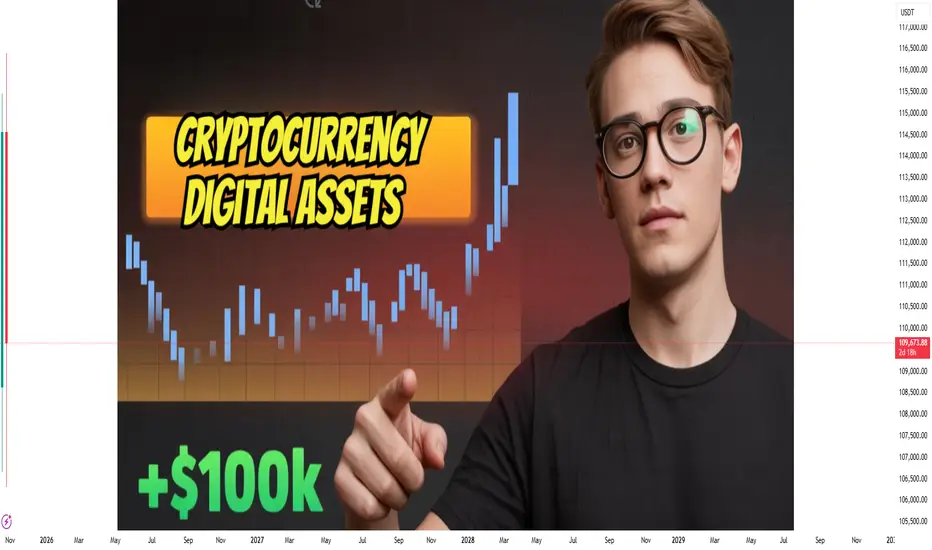
What Are Cryptocurrencies? A Simplified Overview1. The Basic Definition: What Is a Cryptocurrency?
A cryptocurrency is a digital or virtual form of money that uses cryptography (a method of securing information) to ensure secure transactions. Unlike traditional currencies such as the rupee, dollar, or euro — which are issued and controlled by governments or central banks — cryptocurrencies operate on decentralized networks, usually based on blockchain technology.
This means no single authority, like a bank or government, controls cryptocurrency. Instead, users themselves verify and record transactions through computer networks spread across the globe.
In short: Cryptocurrency = Digital Money + Cryptography + Decentralization
2. The Birth of Cryptocurrency: A Revolution in Digital Money
The idea of digital money isn’t entirely new. Efforts to create online currencies started as early as the 1980s and 1990s. But these early systems failed because they depended on a central authority, which made them vulnerable to fraud and manipulation.
The real breakthrough came in 2009, when a mysterious individual (or group) under the name Satoshi Nakamoto introduced Bitcoin — the first successful decentralized cryptocurrency.
Bitcoin solved two major problems that earlier attempts couldn’t:
Double-spending problem – ensuring digital money couldn’t be copied or spent twice.
Trust problem – enabling users to transact without needing to trust a middleman or central authority.
The launch of Bitcoin marked the beginning of a new financial era — one where money could move freely and securely on the internet.
3. How Cryptocurrencies Work
At the heart of every cryptocurrency lies a technology called the blockchain.
Think of a blockchain as a public digital ledger — a kind of record book that’s accessible to everyone but can’t be changed or tampered with.
Here’s how it works step by step:
Transaction Creation:
When someone sends cryptocurrency to another person (say, sending Bitcoin to a friend), that transaction is broadcast to a network of computers.
Verification:
These computers (called nodes) verify the transaction details — ensuring the sender actually has enough funds and that there’s no duplication.
Block Formation:
Verified transactions are grouped together into a “block”.
Blockchain Addition:
Once verified, this block is added to the existing chain of previous transactions — forming a continuous and secure “blockchain”.
Immutability:
Once a block is added, it cannot be altered. This makes blockchain systems highly secure and transparent.
Every participant in the network can view the transactions, but nobody can modify them. This creates a trustless system, meaning people don’t need to trust each other — they only need to trust the system’s mathematics and cryptography.
4. Mining: The Backbone of Cryptocurrency Creation
Most cryptocurrencies (like Bitcoin) are “mined” rather than printed. Mining refers to the process of using powerful computers to solve complex mathematical problems that validate transactions and create new coins.
When miners solve these problems, they add new blocks to the blockchain.
As a reward for their effort and energy, they receive new cryptocurrency coins.
This process not only issues new coins into circulation but also keeps the network secure and decentralized.
However, mining requires significant computing power and electricity. As a result, it has raised environmental concerns, leading newer cryptocurrencies to adopt more energy-efficient methods such as Proof of Stake (PoS) instead of Proof of Work (PoW) used by Bitcoin.
5. Types of Cryptocurrencies
While Bitcoin was the pioneer, thousands of other cryptocurrencies have since emerged, each with unique purposes and features. Some popular examples include:
Bitcoin (BTC):
The original and most valuable cryptocurrency. Often referred to as “digital gold”.
Ethereum (ETH):
Introduced the concept of smart contracts — programmable digital agreements that execute automatically when conditions are met.
Ripple (XRP):
Designed to make international payments faster and cheaper, especially for banks and financial institutions.
Litecoin (LTC):
A lighter, faster version of Bitcoin, often used for smaller transactions.
Cardano (ADA) and Solana (SOL):
Focus on scalability and energy efficiency for decentralized applications (DApps).
Stablecoins (like USDT, USDC):
These are cryptocurrencies pegged to stable assets like the US dollar to reduce volatility.
Meme coins (like Dogecoin, Shiba Inu):
Created for fun or community engagement, though some gained massive popularity.
The cryptocurrency ecosystem continues to expand, with coins serving purposes from gaming and supply chain management to healthcare and finance.
6. Why Are Cryptocurrencies So Popular?
Several reasons explain why cryptocurrencies have gained such massive popularity worldwide:
Decentralization and Independence:
People are drawn to the idea of money that isn’t controlled by banks or governments.
High Return Potential:
Early investors in Bitcoin and other cryptocurrencies saw extraordinary gains, inspiring millions to invest.
Transparency and Security:
Blockchain records are public and cannot be altered, which increases trust.
Borderless Transactions:
You can send money across countries instantly, with minimal fees and no need for conversion.
Financial Inclusion:
Cryptocurrencies can provide banking access to people in remote areas who lack traditional financial infrastructure.
Technological Innovation:
Blockchain technology opened the door for smart contracts, NFTs, and decentralized finance (DeFi), reshaping industries.
7. Risks and Challenges of Cryptocurrencies
Despite their promise, cryptocurrencies also come with significant challenges and risks:
Volatility:
Prices of cryptocurrencies can fluctuate dramatically. Bitcoin, for example, can gain or lose thousands of dollars in a single day.
Regulatory Uncertainty:
Governments worldwide are still developing laws to regulate crypto trading, taxation, and consumer protection.
Security Risks:
While blockchains are secure, cryptocurrency exchanges and wallets can be hacked if users are careless.
Environmental Concerns:
Mining consumes large amounts of electricity, raising questions about sustainability.
Lack of Understanding:
Many people invest without fully understanding the technology, leading to poor financial decisions.
Scams and Fraud:
Fake coins, Ponzi schemes, and rug pulls have caused investors to lose billions globally.
These issues show that while crypto offers freedom and innovation, it also demands responsibility, education, and regulation.
8. The Role of Blockchain: The Foundation of Crypto
Blockchain is the real hero behind cryptocurrencies. It ensures transparency, security, and decentralization.
Each block in the blockchain contains:
A list of transactions
A timestamp
A unique code (hash)
A reference to the previous block
This interconnected system prevents tampering and creates a permanent record of all transactions.
Beyond cryptocurrencies, blockchain is now being adopted in industries like:
Banking (for fast settlements)
Supply Chain Management (to track goods)
Healthcare (for secure patient data)
Voting Systems (to prevent fraud)
Real Estate (for transparent ownership records)
This shows that blockchain’s potential goes far beyond digital money — it can revolutionize how trust and information are managed in society.
9. The Legal and Regulatory Landscape
Different countries view cryptocurrencies differently:
El Salvador became the first nation to adopt Bitcoin as legal tender in 2021.
India, the U.S., and the European Union allow crypto trading but are working on stricter rules for taxation and anti-money laundering.
Some countries like China have banned crypto transactions altogether.
In India, the government does not recognize crypto as legal tender but allows its trading and taxes it at 30% on profits, similar to gambling or speculative income. This reflects a cautious but open approach.
Over time, global regulation is expected to bring more clarity, investor protection, and institutional participation in the crypto market.
10. The Future of Cryptocurrencies
The future of cryptocurrencies is still being written. Some believe crypto will replace traditional banking systems, while others see it as a speculative bubble. However, one thing is certain — the underlying technology is here to stay.
Here are a few emerging trends shaping the future:
Central Bank Digital Currencies (CBDCs):
Many countries are launching their own digital versions of national currencies (like India’s Digital Rupee) to combine the benefits of crypto with government control.
Decentralized Finance (DeFi):
Platforms allowing people to lend, borrow, and trade without banks are gaining massive popularity.
Tokenization of Assets:
Real-world assets like real estate, gold, or art are being represented digitally through blockchain tokens.
Mainstream Adoption:
Companies like Tesla, PayPal, and Visa are integrating cryptocurrencies into their payment systems.
Regulated Crypto Ecosystems:
With better laws and security, institutional investors (like mutual funds and pension funds) are entering the market, bringing legitimacy and stability.
Despite challenges, crypto continues to evolve, pushing the boundaries of how we define money and value.
11. The Human Side: A Shift in Financial Power
Beyond technology, cryptocurrencies represent a philosophical and social shift.
For centuries, financial systems have been controlled by powerful intermediaries — banks, governments, and corporations. Crypto challenges this by empowering individuals directly.
It promotes:
Financial freedom
Transparency
Equal access
Innovation through collaboration
In this sense, cryptocurrencies are not just a new asset class — they symbolize a movement toward democratizing finance.
12. Conclusion: The Evolution of Money
Cryptocurrencies began as a simple idea — to create digital money independent of centralized control. In just over a decade, they have transformed into a global financial revolution influencing technology, policy, and economics.
They are more than an investment trend; they represent the next evolution of how humans exchange value, trust systems, and manage wealth. Yet, as with all powerful innovations, they require understanding, caution, and responsibility.
As the world continues to embrace digital transformation, cryptocurrencies will likely play an essential role — whether as alternative investments, technology enablers, or the foundation of the next-generation financial system.
The Need for a Consistent Trading PlanIntroduction
Trading in financial markets—whether in equities, commodities, forex, or derivatives—is often perceived as an exciting path to wealth creation. However, behind the scenes of every successful trader lies one defining trait: consistency. Consistency is not born out of luck or intuition—it is the result of a well-structured, disciplined, and thoroughly tested trading plan. A consistent trading plan acts as the trader’s compass, providing clarity, direction, and control in an environment that is inherently uncertain and volatile.
Without a trading plan, traders often operate based on emotions, market noise, or impulse decisions, which inevitably leads to losses. On the other hand, a well-defined and consistently executed trading plan transforms randomness into a structured process. It allows traders to manage risk, measure performance, and refine strategies over time. This essay explores the concept of a consistent trading plan, its importance, components, and the discipline required to execute it effectively.
1. What is a Trading Plan?
A trading plan is a detailed, rule-based framework that defines how a trader approaches the market. It includes the criteria for identifying trade opportunities, entry and exit rules, position sizing, risk management strategies, and post-trade evaluation procedures.
Think of it as a business plan for trading. Just as a business outlines its goals, market strategy, and risk controls, a trader’s plan defines how they will interact with the market to achieve consistent profitability.
A good trading plan answers key questions such as:
What markets and instruments will I trade?
What is my risk per trade and overall capital exposure?
What are my entry and exit signals?
How will I track my performance and learn from my mistakes?
By answering these questions in advance, traders avoid making impulsive decisions in the heat of the moment.
2. Why Consistency Matters in Trading
In trading, success is not measured by one or two profitable trades, but by long-term, repeatable performance. Market conditions constantly change—bullish trends, bearish phases, sideways consolidations, or high-volatility spikes. A consistent trading plan helps traders adapt to these variations while keeping their emotions under control.
Consistency offers several key benefits:
Reduces Emotional Trading:
Fear and greed are the two biggest enemies of traders. A consistent plan acts as a stabilizer, ensuring decisions are based on predefined logic rather than emotional reactions.
Enables Objective Decision-Making:
Without a plan, traders may chase market noise or react to every piece of news. A trading plan enforces objectivity—each trade is taken based on established criteria.
Improves Risk Management:
Consistent execution ensures that traders control losses and protect their capital through stop-loss levels and position sizing rules.
Enhances Learning and Refinement:
When trades follow a structured plan, it becomes easier to review results, identify strengths and weaknesses, and make data-driven improvements.
Builds Long-Term Confidence:
Confidence in trading doesn’t come from winning trades—it comes from knowing you’re following a system that works over time. Consistency breeds trust in one’s process.
3. Components of a Consistent Trading Plan
To build a consistent trading plan, traders must focus on certain core components that collectively define their market approach:
a. Trading Goals and Objectives
Every plan begins with clear, measurable goals. These may include monthly return targets, maximum drawdown limits, or growth percentages. Goals must be realistic and aligned with one’s risk tolerance, time availability, and experience level.
For example, a goal like “I aim for 2–3% monthly returns while limiting losses to 1% per trade” gives structure to performance evaluation.
b. Market and Timeframe Selection
Consistency requires focus. A trader cannot master every market at once. Choosing a few instruments (like NIFTY, BANKNIFTY, or gold futures) and timeframes (1-day, 1-hour, or 15-minute charts) helps maintain clarity and specialization.
c. Entry and Exit Criteria
This section defines when to buy or sell. Traders may use technical indicators (e.g., moving averages, RSI, MACD), chart patterns (e.g., breakouts, pullbacks), or price action setups. The entry must be rule-based, not guesswork. Similarly, exits should be pre-planned—whether taking profits at a target level or cutting losses with a stop-loss.
d. Risk Management and Position Sizing
No plan is complete without robust risk management. Professional traders prioritize capital preservation above profit. A common rule is to risk only 1–2% of total capital per trade.
Position sizing—how many shares or contracts to buy—should be determined mathematically, based on account size and stop-loss distance.
e. Trade Management Rules
A consistent trader doesn’t simply “enter and hope.” Trade management involves adjusting stop-loss levels, booking partial profits, or trailing positions as the market evolves. This keeps risk and reward balanced throughout the trade.
f. Record-Keeping and Journaling
Every trade should be documented: the reasoning, entry and exit points, emotional state, and outcome. Reviewing this journal regularly provides invaluable insights into behavioral patterns and strategy performance.
g. Review and Improvement Cycle
A consistent trading plan is dynamic. Markets evolve, and so must the plan. Regular performance reviews help identify areas for improvement. The key is evolution, not random changes—adjustments should be data-driven.
4. The Psychological Edge of Consistency
A consistent trading plan doesn’t just enhance strategy—it strengthens psychology. The emotional rollercoaster of trading—fear of missing out (FOMO), revenge trading, overconfidence after wins, panic after losses—can destroy discipline.
Consistency offers psychological stability by turning trading into a structured process rather than an emotional gamble.
Here’s how:
Reduces Anxiety: Knowing you have clear rules removes uncertainty and decision fatigue.
Builds Patience: Traders wait for valid setups instead of forcing trades.
Encourages Discipline: You learn to follow the plan, not market noise.
Manages Expectations: When you know your system’s average win rate and risk-reward ratio, you stop chasing unrealistic profits.
In essence, consistency transforms trading from a game of luck into a business of probability and process.
5. The Dangers of Trading Without a Plan
Many traders enter markets driven by excitement, social media influence, or quick-profit fantasies. Without a plan, they rely on instincts, tips, or random indicators—eventually leading to repeated losses.
Here’s what happens without consistency:
Emotional Trading: Decisions are based on fear, greed, or impatience.
Overtrading: Jumping into multiple trades without strategy or confirmation.
Lack of Risk Control: Traders often hold onto losing trades, hoping for reversal.
No Learning Path: Without tracking and review, mistakes are repeated endlessly.
Statistics suggest that over 90% of retail traders lose money, not because the markets are unfair, but because they lack a structured, consistent plan.
6. Building Consistency Through Testing and Backtesting
Before going live with any plan, traders must test their strategies on historical data (backtesting) and real-time demo trading (forward testing). This process validates whether the plan has a statistical edge.
For example, if a swing trader tests a breakout strategy on the NIFTY 50 index and finds it profitable across multiple time periods, they gain confidence in executing it consistently. Testing filters out randomness and reveals realistic performance expectations—win rates, drawdowns, and average returns.
7. Adapting Consistency to Market Conditions
While consistency is vital, rigidity can be harmful. A consistent trading plan doesn’t mean never changing—it means changing systematically.
For instance, in volatile markets, a trader might widen stop-loss levels or reduce position size. During low-volatility phases, they might switch to mean-reversion strategies. The key is to maintain the same disciplined process even when strategies are adjusted.
8. Consistency in Risk and Money Management
Consistency extends beyond strategy execution—it must also apply to money management. Traders who randomly change lot sizes, risk percentages, or capital allocation undermine their own progress.
A consistent approach ensures:
Stable risk per trade.
Balanced portfolio exposure.
Protection against large drawdowns.
Even with a 60% win rate, consistent risk control ensures long-term profitability.
9. The Role of Patience and Discipline
Two pillars support every consistent trading plan: patience and discipline.
Patience allows traders to wait for the right setups; discipline ensures they act according to the plan, even when tempted to deviate. The best traders are not those who predict markets perfectly, but those who execute consistently under all conditions.
10. Case Study Example
Consider two traders, A and B.
Trader A follows a defined swing trading plan: trades only NIFTY and BANKNIFTY, risks 1% per trade, uses a 2:1 risk-reward ratio, and journals every trade.
Trader B trades based on social media tips, changes indicators weekly, and risks variable amounts based on “gut feeling.”
Over a year, Trader A may have losing streaks but will likely grow steadily. Trader B, despite some big wins, will end up inconsistent and likely lose capital. The difference is not skill—it’s discipline and consistency.
11. Conclusion
In the world of trading, consistency is the bridge between knowledge and success. The market rewards those who operate with structure, patience, and emotional control—qualities only a consistent trading plan can instill.
A trading plan does not guarantee profits in every trade, but it guarantees process integrity—a structured way to manage uncertainty. With a consistent plan, traders can measure progress, adapt intelligently, and sustain longevity in the markets.
Ultimately, trading is not about predicting every market move—it’s about preparing for every possibility. And that preparation begins with one essential tool: a consistent trading plan.

Part 1 Support and Resistance Introduction to Option Trading
Option trading is a type of derivative trading where investors buy and sell contracts that give them the right—but not the obligation—to buy or sell an underlying asset (such as stocks, indices, or commodities) at a predetermined price within a specified period. The two basic types of options are Call Options and Put Options. A Call Option gives the holder the right to buy an asset, while a Put Option gives the holder the right to sell. Unlike futures, options provide flexibility and limited risk for buyers because they can choose not to exercise the contract if the market moves against them. This characteristic makes options one of the most versatile financial instruments in modern markets.

The Role of Sub-Brokers in India’s Financial MarketIntroduction
India’s financial market is one of the fastest-growing in the world, driven by rising participation from retail investors, a robust regulatory framework, and increasing digitalization. Within this ecosystem, sub-brokers have historically played a vital role as intermediaries who connect investors to the stock market through registered stockbrokers.
Although technological advancements and new regulatory norms have transformed their traditional role, sub-brokers continue to be significant, especially in expanding the reach of capital markets into smaller towns and rural areas. Their contribution lies not only in client acquisition but also in investor education, market accessibility, and financial inclusion.
Who is a Sub-Broker?
A sub-broker is an individual or entity who acts as an agent on behalf of a stockbroker to facilitate buying, selling, and trading of securities for clients. They do not hold direct membership of a stock exchange but work under a registered stockbroker who has that membership.
Essentially, a sub-broker serves as a bridge between the investor and the main broker. Before 2018, sub-brokers were directly registered with the Securities and Exchange Board of India (SEBI). However, SEBI later discontinued new registrations under this category, directing intermediaries to register instead as Authorised Persons (APs) under brokers.
Evolution of Sub-Brokers in India
The journey of sub-brokers in India is tied closely to the growth of the Indian stock market.
1. Pre-Demat Era
Before the introduction of electronic trading in the 1990s, the stock market was largely paper-based and operated through physical share certificates. Investors relied heavily on personal connections and local agents—who acted as early sub-brokers—to execute trades and manage portfolios.
2. Post-Demat and Online Trading
With the establishment of National Stock Exchange (NSE) and Central Depository Services (CDSL) in the 1990s, trading moved online. Sub-brokers began using digital platforms provided by brokers to execute client trades more efficiently, allowing them to serve a wider base of investors.
3. SEBI’s Regulatory Transformation
SEBI introduced strict norms to bring transparency to sub-broker operations. However, as technology simplified client onboarding, SEBI decided in 2018 to merge the “sub-broker” category into Authorised Persons to streamline supervision and compliance under brokers. Despite the name change, the function remains nearly identical — connecting clients to brokers and markets.
Registration and Compliance Framework
A sub-broker (or now an Authorised Person) must be associated with a SEBI-registered trading member or broker.
Key Requirements:
Broker Association: Must have a written agreement with a SEBI-registered broker.
Education and Experience: Generally, a graduate with sound knowledge of the stock market is preferred.
Infrastructure: Should have office space, internet access, and client service capacity.
KYC and AML Compliance: Must ensure all clients undergo Know-Your-Customer verification and follow Anti-Money Laundering norms.
Revenue Sharing Agreement: Income is typically commission-based, agreed mutually between the sub-broker and the broker.
Transition to Authorised Persons (APs):
After SEBI discontinued the sub-broker category, all existing sub-brokers were required to migrate to the AP model. This made regulatory control more streamlined and reduced duplication in supervision.
Functions of Sub-Brokers in the Financial Market
Sub-brokers perform several crucial functions that contribute to the health and expansion of India’s capital markets.
1. Client Acquisition and Onboarding
One of the most vital roles of sub-brokers is identifying potential investors, guiding them through account opening procedures, and ensuring compliance with KYC requirements. They help new investors, especially in smaller cities, understand trading basics and invest safely.
2. Trade Execution Support
Sub-brokers assist clients in executing trades through the broker’s platform. They explain market orders, stop-loss mechanisms, and portfolio diversification strategies, ensuring investors make informed decisions.
3. Investor Education
For many first-time investors, the sub-broker acts as a teacher. They provide insights into how the stock market works, how to interpret trends, and how to avoid common pitfalls. Their role as educators has been crucial in spreading market literacy across semi-urban and rural regions.
4. Advisory and Relationship Management
Sub-brokers often offer personalized guidance on stock selection, mutual funds, derivatives, or IPOs based on client risk profiles. They maintain long-term relationships by providing continuous portfolio updates and market insights.
5. Expanding Market Reach
Sub-brokers are instrumental in expanding the capital market’s reach. Many investors in Tier II and Tier III cities access stock markets for the first time through local sub-brokers, bridging the urban-rural investment gap.
6. After-Sales and Customer Service
Beyond trade execution, sub-brokers handle client grievances, documentation, and other service issues. Their local presence ensures clients receive quick and reliable support.
Revenue Model of Sub-Brokers
Sub-brokers primarily earn through commission-sharing with the broker. The typical structure involves:
Brokerage Sharing: A certain percentage (ranging from 40% to 80%) of the brokerage charged to clients is shared with the sub-broker.
Incentives: Brokers may offer incentives for achieving higher trading volumes or for onboarding a specific number of clients.
Advisory Fees: In some cases, sub-brokers may charge clients directly for financial advisory or portfolio management services (if authorized).
This model allows sub-brokers to scale their income with client activity while maintaining flexibility in operations.
Technological Transformation and Its Impact
The digital revolution in India’s financial services has redefined the role of sub-brokers.
1. Rise of Discount Brokers
Discount brokers such as Zerodha, Groww, and Upstox have simplified trading through mobile apps and zero-commission models. This reduced dependence on human intermediaries, impacting the traditional sub-broker structure.
2. Digital Client Onboarding
Online KYC, e-signatures, and instant account openings have made it easier for clients to join directly through digital platforms. Sub-brokers now use digital tools for faster onboarding and data management.
3. Hybrid Model Emergence
While online platforms dominate in metros, sub-brokers have adopted a hybrid model—using technology to execute trades but maintaining personal relationships to guide clients, especially those uncomfortable with technology.
4. Data-Driven Advisory
Modern sub-brokers use analytical tools, AI-based platforms, and CRM systems to provide smarter investment advice, track client portfolios, and generate better returns.
Challenges Faced by Sub-Brokers
Despite their importance, sub-brokers face several challenges in the evolving market environment.
1. Regulatory Changes
The shift from sub-broker to Authorised Person created confusion initially, requiring re-registration and adjustment to new norms.
2. Reduced Commissions
With the advent of discount brokers offering low-cost trading, sub-brokers have faced declining commission margins, affecting their income potential.
3. Technological Competition
Automated trading platforms and robo-advisors are reducing the need for manual guidance, especially among tech-savvy investors.
4. Compliance Burden
Strict KYC, reporting, and data privacy requirements demand administrative and technological investments that small sub-brokers may struggle to afford.
5. Market Volatility
Income of sub-brokers is linked to trading volumes. During market downturns, when investor participation drops, their revenue can fall sharply.
Regulatory Oversight by SEBI
SEBI has established a robust framework to ensure that sub-brokers or authorised persons operate transparently.
Key Regulations Include:
Mandatory association with SEBI-registered brokers.
Clear disclosure of revenue-sharing arrangements.
Strict prohibition against unauthorized trading or mis-selling.
Maintenance of investor grievance redressal mechanisms.
Continuous compliance audits and reporting.
These measures safeguard investor interests and maintain trust in the capital market.
Role in Financial Inclusion
Sub-brokers are essential in extending financial inclusion by:
Introducing stock market participation in smaller towns.
Encouraging investments in mutual funds and IPOs.
Helping individuals understand long-term wealth creation through equities.
Assisting in systematic investment planning (SIPs) and retirement planning.
Their local presence and personalized service have helped thousands of first-time investors navigate the complexities of financial markets.
The Future of Sub-Brokers in India
The future of sub-brokers lies in adaptation and evolution.
1. Shift to Advisory and Wealth Management
Instead of relying solely on trade commissions, many sub-brokers are transitioning to financial advisory, mutual fund distribution, and insurance services to diversify income.
2. Partnership with Digital Platforms
Collaborations with online brokers and fintech firms allow sub-brokers to leverage technology while maintaining a local relationship-driven model.
3. Focus on Tier II and Tier III Cities
As India’s smaller cities witness growing disposable income, sub-brokers will play a key role in onboarding new investors and expanding the financial ecosystem.
4. Upskilling and Certification
Continuous training in financial products, regulatory compliance, and technology will help sub-brokers remain competitive in the evolving landscape.
Conclusion
Sub-brokers have been a cornerstone of India’s financial market journey — from paper-based trading floors to digital stock exchanges. Their role as connectors, educators, and facilitators has expanded access to the market, empowered retail investors, and strengthened the foundation of financial inclusion.
Even though the structure has evolved into the Authorised Person model, the essence of their contribution remains unchanged. As India moves toward deeper capital market participation and digital finance, sub-brokers who embrace technology, transparency, and advisory-based services will continue to play an irreplaceable role in shaping the next phase of India’s financial growth.

Arbitrage as the Invisible Hand of Market BalanceUnderstanding the Concept of Arbitrage and Why Cross-Market Opportunities Exist.
Introduction: The Timeless Appeal of Arbitrage
In the world of finance and trading, arbitrage is one of the oldest and most reliable concepts for making profits with minimal risk. The idea is simple yet powerful — taking advantage of price discrepancies for the same asset across different markets or instruments. Arbitrageurs act as the balancing agents of the financial ecosystem. By exploiting small differences in prices, they help maintain market efficiency and price stability.
While it might sound straightforward — buy low here, sell high there — in practice, arbitrage is an intricate process driven by technology, timing, and global financial linkages. Cross-market arbitrage, in particular, shows how interconnected today’s world is, where an event in New York or London can instantly impact prices in Mumbai or Singapore.
Let’s delve deeper into what arbitrage means, its types, and why cross-market opportunities continue to exist despite the rise of advanced trading systems and AI-driven algorithms.
1. What is Arbitrage?
Arbitrage is the practice of simultaneously buying and selling an asset in different markets to profit from the difference in price. The key here is simultaneity — both transactions occur at the same time to lock in a risk-free profit.
In essence, arbitrage ensures that the law of one price holds true: an identical asset should have the same price across all markets. When this is not the case, arbitrageurs step in, quickly exploiting the gap until prices converge again.
Example:
Suppose shares of Company X trade at ₹1,000 on the National Stock Exchange (NSE) and ₹1,005 on the Bombay Stock Exchange (BSE). A trader can buy on NSE and sell on BSE simultaneously, earning ₹5 per share in profit before transaction costs. While this seems small, when executed at scale with automation, such trades can generate significant returns.
2. The Core Principle: The Law of One Price
At the heart of arbitrage lies the law of one price, which states that in an efficient market, identical assets should trade for the same price when exchange rates, transaction costs, and other frictions are considered.
If gold is priced at ₹6,000 per gram in India and $70 per gram in the U.S., and the exchange rate is ₹85 per dollar, then ₹6,000/₹85 = $70.5 per gram — nearly identical. Any meaningful difference would invite traders to move gold (physically or virtually) from one market to another until prices align.
However, real-world markets aren’t always perfectly efficient, which gives rise to temporary price imbalances — and hence, arbitrage opportunities.
3. Types of Arbitrage in Financial Markets
Arbitrage comes in several forms, each suited to different asset classes and market structures. Below are the most common:
a) Spatial (Geographical) Arbitrage
This is the classic form of arbitrage where an asset is bought in one location and sold in another. Common examples include commodities, currencies, or stocks listed on multiple exchanges.
b) Temporal Arbitrage
This occurs when traders exploit price differences across time periods. For instance, buying a stock today and selling a futures contract for delivery next month when the future price is higher.
c) Statistical Arbitrage
Here, traders use quantitative models to identify mispriced securities based on historical relationships. It’s not purely risk-free but relies on probability and mean reversion.
d) Triangular Arbitrage (Currency Markets)
In the forex market, triangular arbitrage involves exploiting discrepancies among three currency pairs. For instance, if EUR/USD, USD/GBP, and EUR/GBP don’t align mathematically, a trader can profit by cycling through the three conversions.
e) Merger or Risk Arbitrage
This form occurs during corporate events such as mergers or acquisitions. Traders speculate on price movements between the target company’s current price and the offer price.
f) Cross-Market Arbitrage
This involves exploiting price differences for the same or related assets across different markets or asset classes — such as spot and futures, or equity and derivatives markets.
Cross-market arbitrage is increasingly important in today’s globalized, interconnected trading landscape.
4. Understanding Cross-Market Arbitrage
Cross-market arbitrage happens when traders take advantage of price differences for the same security, index, or commodity across multiple exchanges or platforms — often across borders.
For example, if Reliance Industries trades at ₹2,500 on the NSE but ₹2,507 on the Singapore Exchange (SGX) as a derivative instrument, an arbitrageur could buy the cheaper one and sell the higher-priced version, profiting from the spread until prices converge.
This form of arbitrage often occurs between:
Spot and futures markets (cash-and-carry arbitrage)
Domestic and international exchanges
Equity and derivative markets
Cryptocurrency exchanges across countries
The profit margins may be narrow, but in high-volume or algorithmic environments, these trades can yield consistent gains.
5. Why Do Cross-Market Opportunities Exist?
If markets are efficient, one might wonder — why do such price differences exist at all? Theoretically, arbitrage should eliminate inefficiencies quickly. However, several real-world frictions allow opportunities to emerge and persist, at least temporarily.
Let’s explore the main reasons:
a) Market Segmentation
Not all investors have access to all markets. Regulatory barriers, currency restrictions, or exchange-specific membership requirements can create segmented markets, allowing the same asset to trade at different prices.
For instance, Chinese A-shares often trade at higher valuations on mainland exchanges compared to Hong Kong-listed H-shares of the same company due to limited investor access in mainland markets.
b) Currency Exchange Rates
When assets are priced in different currencies, exchange rate movements can create temporary mispricing. Even slight discrepancies in forex rates can lead to arbitrage between markets.
c) Liquidity Differences
Some markets are more liquid than others. Lower liquidity can lead to price delays or inefficiencies, allowing faster traders to exploit differences between high-liquidity and low-liquidity venues.
d) Information Asymmetry
Not all markets react to information simultaneously. If news reaches one market faster, prices there adjust sooner, creating short-lived arbitrage opportunities elsewhere.
e) Transaction Delays and Infrastructure Gaps
Even in an era of high-frequency trading, minor lags in data transmission or order execution can result in tiny but exploitable differences between exchanges.
f) Demand and Supply Imbalances
Cross-market demand differences — due to institutional orders, fund flows, or hedging needs — can push prices temporarily away from equilibrium, creating room for arbitrage.
g) Regulatory and Tax Factors
Different tax structures, capital controls, or transaction charges across countries can cause effective price differences for the same asset.
6. How Arbitrage Helps Maintain Market Efficiency
Arbitrage isn’t just about making profits — it plays a crucial stabilizing role in the global financial system.
Whenever arbitrageurs exploit price gaps, their actions force prices back toward equilibrium. For example, buying in the cheaper market increases demand (raising the price) while selling in the expensive market increases supply (lowering the price). This self-correcting mechanism ensures that prices remain aligned across regions and instruments.
In this sense, arbitrage acts as a natural regulator of market inefficiencies, contributing to:
Price uniformity
Efficient capital allocation
Market liquidity
Reduced volatility
7. The Role of Technology in Arbitrage
In earlier decades, arbitrage required manual observation, phone calls, and physical trade execution. Today, it’s dominated by algorithms and high-frequency trading (HFT).
Modern arbitrageurs use advanced systems to:
Track price discrepancies in microseconds
Execute simultaneous trades across exchanges
Manage massive volumes with minimal latency
Technological advancements such as co-location (placing servers near exchange data centers), API connectivity, and AI-driven analytics have transformed arbitrage from human-driven intuition to machine-executed precision.
However, this also means that arbitrage opportunities now close much faster — often within milliseconds — requiring traders to invest heavily in technology.
8. Risks and Challenges in Arbitrage
While arbitrage is considered “risk-free” in theory, in reality, several factors can turn it risky:
Execution Risk: Prices may change before both sides of the trade are completed.
Latency Risk: Delays in order processing can erase profits.
Transaction Costs: Fees, taxes, and slippage can turn a profitable trade into a loss.
Regulatory Restrictions: Some countries restrict cross-border or high-frequency trading.
Currency Risk: Exchange rate fluctuations can alter effective profits.
Thus, while arbitrage is low-risk compared to speculative trading, it demands precision, capital, and infrastructure to succeed consistently.
9. Real-World Examples of Cross-Market Arbitrage
a) NSE–BSE Price Differentials
Large-cap Indian stocks often trade simultaneously on both exchanges. Automated systems constantly scan for minute price differences to execute cross-exchange arbitrage.
b) SGX–Nifty Futures Arbitrage
For years, the SGX Nifty index futures in Singapore traded slightly differently than Indian NSE Nifty futures. Arbitrageurs would buy in one market and sell in the other, balancing the two indices.
c) Cryptocurrency Exchanges
Crypto markets, being decentralized and fragmented, often exhibit significant cross-exchange price differences. For instance, Bitcoin might trade at a premium in South Korea compared to the U.S. — known as the “Kimchi Premium.”
10. The Future of Arbitrage in a Globalized Market
As technology continues to advance and global connectivity deepens, traditional arbitrage margins are shrinking. However, new forms of arbitrage are emerging, especially with the rise of:
Digital assets and tokenized securities
Decentralized finance (DeFi) platforms
Algorithmic and machine-learning-based trading strategies
Cross-market inefficiencies will likely persist in newer, evolving markets where regulatory fragmentation, liquidity gaps, and data asymmetry continue to exist.
In other words, while arbitrage profits might be slimmer, the scope of opportunities is expanding — not disappearing.
Conclusion
Arbitrage is more than just a trading strategy — it’s a mechanism that keeps the global financial system efficient and interconnected. By seizing fleeting opportunities born from imperfections, arbitrageurs ensure that prices reflect true value across geographies and instruments.
Cross-market opportunities exist because no market is perfectly efficient. Differences in time zones, liquidity, regulation, and information flow continuously create temporary imbalances. For traders equipped with speed, strategy, and precision, these moments translate into consistent profits — and for the broader system, into greater market harmony and stability.
In a world that trades 24/7 across borders, arbitrage will always find a way — adapting to new technologies, instruments, and markets — remaining one of the purest expressions of financial logic and opportunity.

XAUUSDGold rejected from the support area broke the Trendline and formed a pattern head and shoulders shorting gold here.
Tp - 3959

Strong buying holds bluedart1. Stock has broken its consolidation phase
2. Showing strong buyers movement with strong bullish candles
3. Stock has taken support level on 5200 to 5600 level
4. Stock may show sudden buying movement
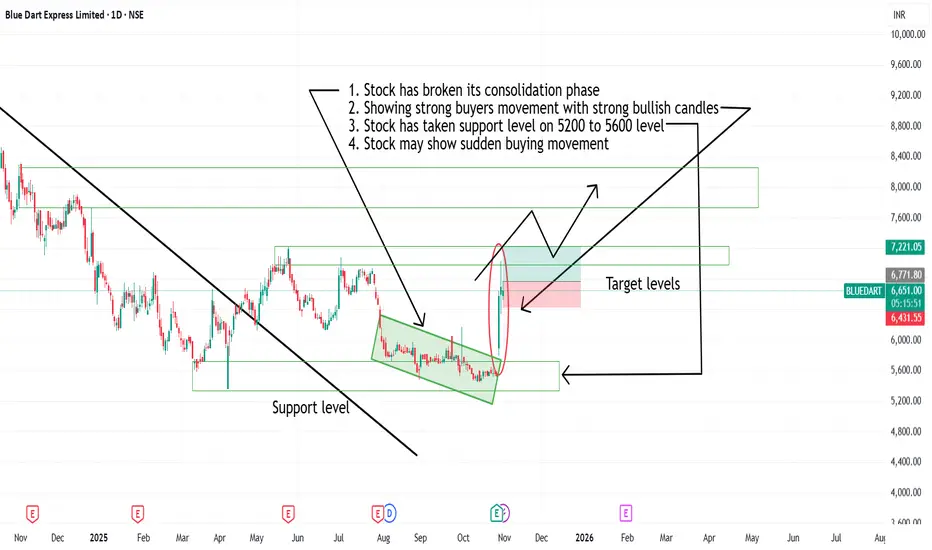
XAUUSDGold has been showing bullish signs break of pattern and and Trendline keeping it simple and in higher time frame as well gold is showing bullish signs.
Buy @ 4000
Tp - 4054
Extended Tp 4086

We are back below 26000!As said in previous analysis that it is too soon to confirm further upmove based on DAILY candle's closing above 26000 level as the weekly candle is yet to be formed. Since we have on more day to go, we may expect further bearish to volatile market so plan your trades accordingly and keep watching everyone.

XAUUSDA good Buy setup was waiting for the Trendline break , previous demand zone was there a correction was required that was my login that brought my bias for long please follow if you like my idea

POLYCAB INDIAThe stock has been in a strong uptrend since mid-2024, forming higher highs and higher lows consistently.
A well-defined ascending trendline supports the move.
Price had a fakeout below the trendline earlier (March 2025) but quickly recovered, confirming strong demand.
The supply zone around ₹7,700–₹7,800 has acted as a major resistance level multiple times.
Now, the price has broken out above this supply zone with strong momentum — confirming a bullish breakout.
🔍 Technical Structure
Key Zone Level Remarks
Support Zone (Previous Supply) ₹7,650–₹7,750 Breakout zone – likely to act as support on retest
Trendline Support Rising trendline near ₹7,400 Long-term support zone
Immediate Resistance ₹8,000 Round number, short-term barrier
Next Major Resistance / Target ₹8,400–₹8,500 Previous swing projection / measured move
⚙️ Trade Plan
✅ Entry
Aggressive Entry: At current price (~₹7,840–7,860) — as price has broken out above supply with good volume.
Conservative Entry: On retest of the breakout zone ₹7,700–7,750, if price holds and shows bullish candle confirmation.
🛡️ Stop-Loss (SL)
Keep SL below ₹7,500, just under the trendline and breakout zone.
→ This protects against false breakouts.
🎯 Targets
Target 1: ₹8,000–8,050 (immediate breakout confirmation zone)
Target 2: ₹8,400–8,500 (measured move from previous range)
⚖️ Risk–Reward Example
If entered at ₹7,750:
SL: ₹7,500 (Risk = ₹250)
T1: ₹8,050 (Reward = ₹300 → R:R = 1.2:1)
T2: ₹8,500 (Reward = ₹750 → R:R = 3:1)
📈 Technical Bias
✅ Uptrend intact
✅ Breakout above strong resistance
✅ High volume confirmation
✅ Strong price structure above trendline
Bias: Strongly Bullish (Momentum + Breakout Confirmation)
