XAUUSD SUPPORT, RESISTNACE & TRENDLINE ANALYSIS I hope whosoever followed my levels should have captured some good moves.
My levels will remain the same as last times.
The bias is now Bullish. Let it break 4025.25 for an up move towards 4044 and breaking that would lead to 4091.25 or 4100.
Note: If it only breaks 3953 then only we can plan for downside
Trend Lines

Nifty Intraday Analysis for 29th October 2025NSE:NIFTY
Index has resistance near 26150 – 26200 range and if index crosses and sustains above this level then may reach near 26350 – 26400 range.
Nifty has immediate support near 25750 – 25700 range and if this support is broken then index may tank near 25550 – 25500 range.

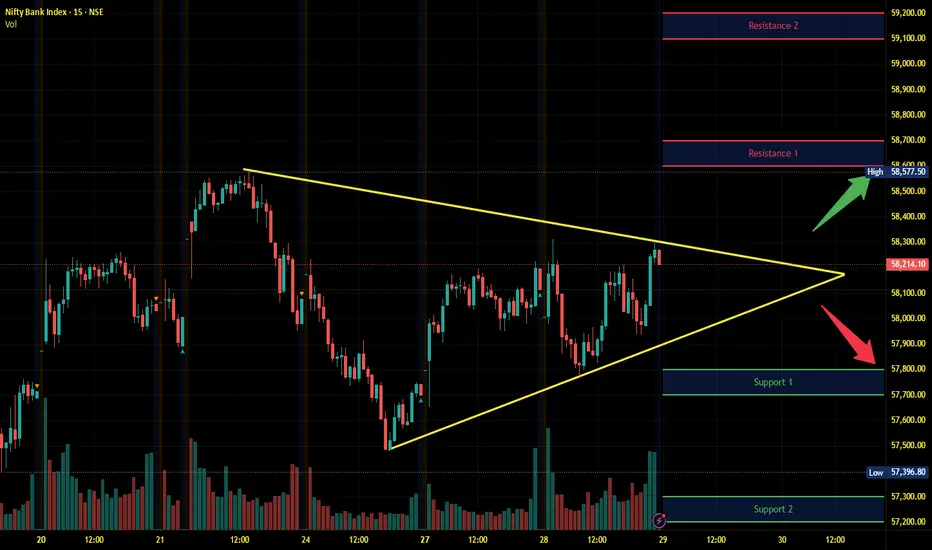
Banknifty Intraday Analysis for 29th October 2025NSE:BANKNIFTY
Index has resistance near 58600 – 58700 range and if index crosses and sustains above this level then may reach near 59100 – 59200 range.
Banknifty has immediate support near 57800 - 57700 range and if this support is broken then index may tank near 57300 - 57200 range.
Finnifty Intraday Analysis for 29th October 2025 NSE:CNXFINANCE
Index has resistance near 27650 - 27700 range and if index crosses and sustains above this level then may reach near 27900 - 27950 range.
Finnifty has immediate support near 27250 – 27200 range and if this support is broken then index may tank near 27050 – 27000 range.

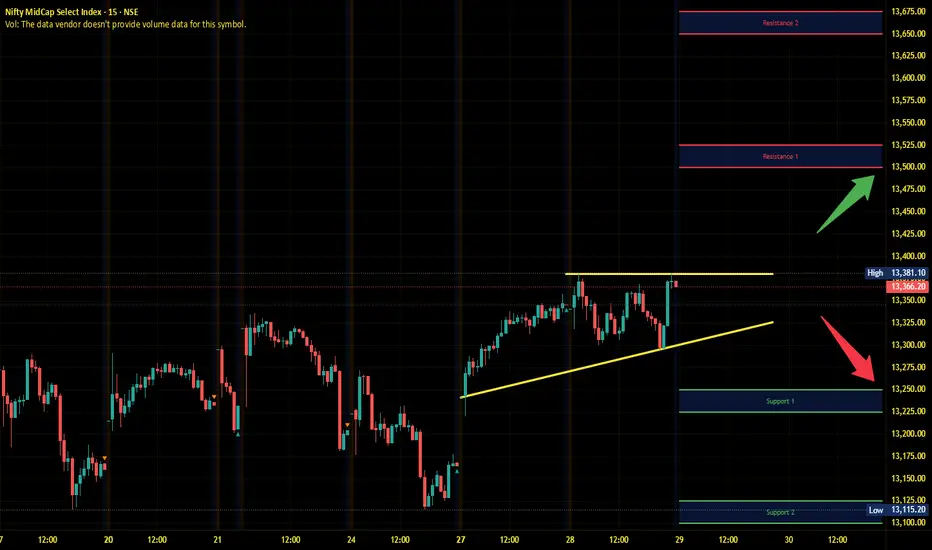
Midnifty Intraday Analysis for 29th October 2025NSE:NIFTY_MID_SELECT
Index has immediate resistance near 13500 – 13525 range and if index crosses and sustains above this level then may reach 13650 – 13675 range.
Midnifty has immediate support near 13250 – 13225 range and if this support is broken then index may tank near 13125– 13100 range.
Part 8 Trading Master ClassAdvantages of Option Trading
Leverage: Traders can control large positions with smaller capital.
Flexibility: Suitable for speculation, hedging, or income generation.
Limited Risk (for buyers): Buyers can lose only the premium paid.
Hedging: Protects portfolios against adverse price movements.
Income Generation: Selling options allows investors to earn consistent premium income.

Part 7 Trading Master ClassOption Greeks: Measuring Sensitivity
Professional traders use “Greeks” to assess how option prices change with market variables:
Delta (Δ): Measures the rate of change in option price relative to the underlying asset’s price.
Gamma (Γ): Measures how Delta changes with price movement.
Theta (Θ): Represents time decay – how much value an option loses daily as expiry nears.
Vega (ν): Sensitivity to volatility changes.
Rho (ρ): Sensitivity to interest rate changes.
Understanding Greeks helps traders manage portfolio risks and design advanced strategies.

Part 6 Learn Instiutitonal Trading Factors Influencing Option Prices
Option prices (premiums) are affected by several variables, collectively analyzed under option pricing models such as the Black-Scholes model. The main factors include:
Underlying Asset Price: Higher prices increase call premiums and decrease put premiums.
Strike Price: The closer the strike price is to the current price, the higher the premium.
Volatility: More volatility means higher premiums due to increased uncertainty.
Time to Expiry: Longer durations mean more time value.
Interest Rates: Higher interest rates slightly increase call premiums.
Dividends: Expected dividends can reduce call premiums and increase put premiums.

Part 4 Learn Instiutitonal Trading Intrinsic and Time Value
An option’s premium has two parts:
Intrinsic Value: The amount by which an option is “in the money.”
For a call option, it’s the difference between the current price and the strike price.
For a put option, it’s the difference between the strike price and the current price.
Time Value: Represents the potential for the option to gain more value before expiration. The longer the time to expiry, the higher the time value.
Example:
If a stock is trading at ₹1,200 and a call option with a strike price of ₹1,000 is priced at ₹220, then:
Intrinsic Value = ₹200 (₹1,200 - ₹1,000)
Time Value = ₹20 (₹220 - ₹200)

Part 3 Learn Institutional TradingHow Option Trading Works
Option trading involves two main parties: the buyer and the seller (writer).
The buyer pays a premium and gets the right (not obligation) to buy or sell the underlying asset.
The seller receives the premium and takes on the obligation to buy or sell the asset if the buyer exercises the option.
Let’s take an example:
Suppose a trader buys a call option for Stock A with a strike price of ₹1,000, paying a premium of ₹50. If the stock rises to ₹1,100, the trader can exercise the option to buy at ₹1,000 and sell at ₹1,100, earning ₹100 per share (minus the ₹50 premium). The profit is ₹50 per share.
If the stock stays below ₹1,000, the trader won’t exercise the option and only loses the ₹50 premium paid.

Part 2 Ride The Big Moves Key Components of an Option Contract
To understand option trading, it’s essential to know the basic elements that define each contract:
Underlying Asset: The financial instrument (stock, index, currency, or commodity) on which the option is based.
Strike Price: The price at which the option holder can buy or sell the asset.
Expiration Date: The date on which the option contract expires. After this date, the option becomes worthless if not exercised.
Premium: The price paid by the buyer to the seller (writer) of the option.
Lot Size: The number of units of the underlying asset in one option contract (for example, 50 shares per lot).

Part 1 Ride The Big Moves What Are Options?
An option is a financial contract that gives the buyer the right, but not the obligation**, to buy or sell an underlying asset at a predetermined price (called the strike price) before or on a specific date (the expiry date).
Options are categorized into two types:
Call Option: Grants the holder the right to buy the underlying asset.
Put Option: Grants the holder the right to sell the underlying asset.
For example, if an investor believes a stock’s price will rise, they might buy a call option. Conversely, if they expect the price to fall, they might buy a put option.

XAUUSDI was looking for long in Gold was waiting for Trendline break and demand was already there so it broke and triggered my buy please find my setup

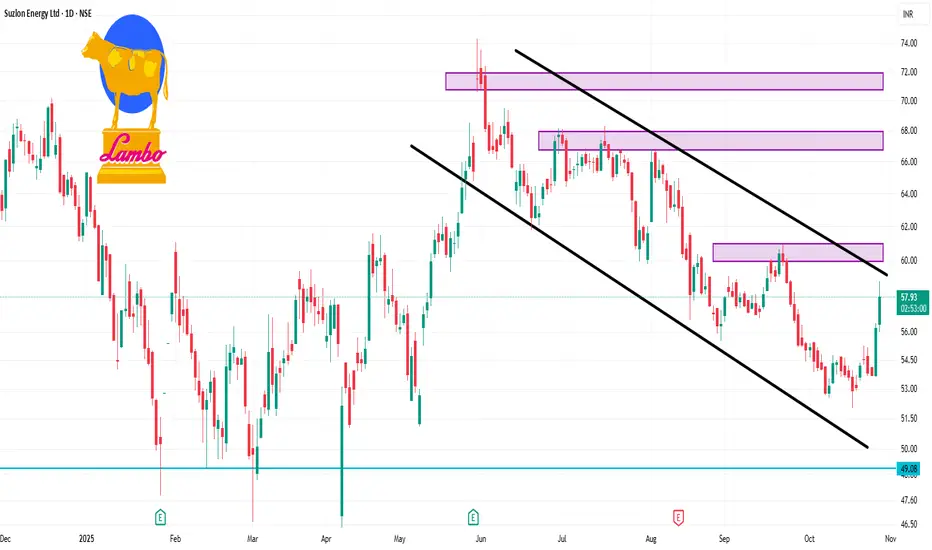
SUZLON 1 Day Time Frame📌 Current price
The stock is trading around ₹53.82 (latest close) according to multiple sources.
🔍 Key levels for the day
Pivot / reference zone: ~ ₹54.22.
Resistance levels:
R1 ~ ₹54.79
R2 ~ ₹55.75
R3 ~ ₹56.32
Support levels:
S1 ~ ₹53.26
S2 ~ ₹52.69
S3 ~ ₹51.73
SAIL 1 Day Time Frame 🔍 Price Snapshot
Last traded price: ~ ₹129.46.
Day’s range: approximately ₹129.11 – ₹131.88.
52-week range: about ₹99.15 (low) to ₹139.98 (high).
📈 Key Technical Levels
Support zone: Around ₹128-₹129 region (close to current price and recent intraday lows)
Resistance zone: Around ₹131.5-₹133 region, as the upper end of the recent daily range
If price breaks down below ~ ₹128 with volume, next support to watch could be toward ~ ₹120-₹118 (longer-term).
If price breaks out above ~ ₹133, target could move toward the 52-week high near ~ ₹139-₹140.

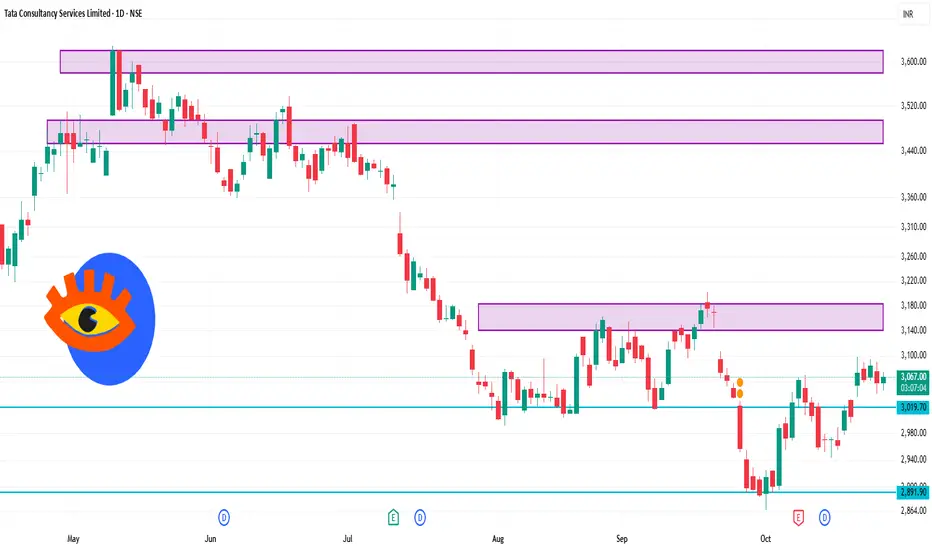
TCS 1 Day Time Frame Current price: ~ ₹3,063.20.
Day’s range (approx): ~ ₹3,041 – ₹3,090.
52-week range: ~ ₹2,867.60 (low) to ₹4,494.90 (high).
🔍 Key support & resistance (based on current structure)
Support zone 1: ~ ₹3,000 – where the price is hovering—psychological and near recent consolidation.
Support zone 2: ~ ₹2,940 – a stronger lower bound if the current support fails.
Resistance zone 1: ~ ₹3,150 – near the day’s high and recent supply.
Resistance zone 2: ~ ₹3,250 – upper structure/resistance from recent swing highs.
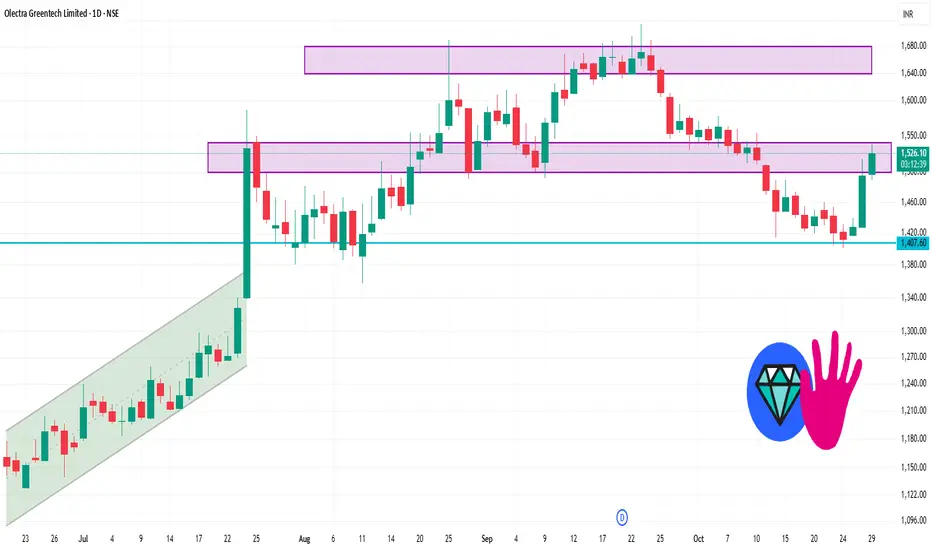
OLECTRA 1 Day Time Frame ✅ Important Levels
From pivot-point calculations:
Pivot (daily central pivot approx): ~ ₹ 1,479.83 (Standard)
First resistance (R1): ~ ₹ 1,533.37 (Standard)
Second resistance (R2): ~ ₹ 1,571.43
First support (S1): ~ ₹ 1,441.77
Second support (S2): ~ ₹ 1,388.23
HCC 1 Week Time Frame 📌 Key Levels (approximate, in ₹)
Current price: ~ ₹28.30.
Support zone:
~ ₹27.10 to ₹27.70 (recent low area)
A more “significant” lower support around ~ ₹23.80-₹22.60 (longer-term)
Resistance zone:
Near ~ ₹29.00-₹29.50 (short‐term barrier)
Further resistance ~ ₹36.40 and then ~ ₹46.99 (medium/longer-term)

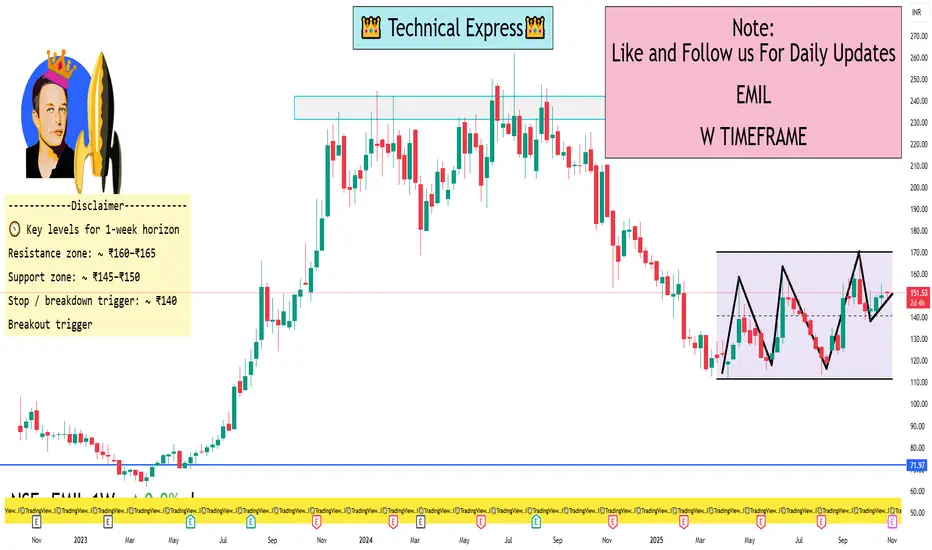
EMIL 1 week time frame 📌 Current price context
Latest price is approx ₹150–₹155.
52-week range: low ~ ₹111, high ~ ₹210+.
The stock is trading in a consolidation zone after previous down move.
🧭 Key levels for 1-week horizon
Resistance zone: ~ ₹160–₹165. This is where recent uptick may stall, supply could appear.
Support zone: ~ ₹145–₹150. If price drifts down, this is the region to watch for a bounce.
Stop / breakdown trigger: ~ ₹140. If price decisively breaks below ₹145–150 and heads toward ₹140, risk of further downside increases.
Breakout trigger: If price clears ~ ₹165 with strong volume, next upside gate opens (~ ₹175+) but prior highs near ~₹210 act as long-term resistance.
AWL 1 Day View✅ Key levels
Based on multiple sources:
Support zone (near term): ~ ₹ 249.60.
Support zone 2: ~ ₹ 236.45 on a broader timeframe.
Resistance zone (near term): ~ ₹ 271.10.
Broader resistance: ~ ₹ 280.50 – ₹ 290.90 range.
Pivot / daily reference levels (classic):
Pivot ~ ₹ 265.42
R1 ~ ₹ 267.58
S1 ~ ₹ 262.08

The Need to Boost Trading Performance1. The Evolving Nature of Markets
Over the past decade, financial markets have transformed dramatically. Technological advancements, algorithmic trading, artificial intelligence, and global interconnectivity have made markets faster and more unpredictable. Retail participation has also grown significantly, bringing in new dynamics of momentum, liquidity, and volatility.
In such an environment, a trader who doesn’t adapt risks being left behind. A strategy that once delivered consistent returns may underperform as market structures change. Therefore, performance optimization isn’t just about improving returns—it’s about staying relevant.
Boosting performance means refining your edge amid changing volatility, sector rotation, and behavioral shifts. Whether you trade intraday, swing, or positional setups, continual enhancement of analysis, risk management, and execution is the foundation of longevity.
2. Understanding What “Trading Performance” Truly Means
Many traders equate performance with profits, but that’s a narrow definition. Real trading performance is multidimensional—it involves how efficiently you analyze, manage risk, execute trades, control emotions, and learn from outcomes.
True trading performance can be broken into these key elements:
Accuracy: How often your setups work as expected.
Risk Efficiency: How much you lose when you’re wrong versus what you gain when you’re right.
Consistency: The ability to sustain performance across different market cycles.
Execution Quality: How well you enter and exit trades relative to your plan.
Psychological Control: How well you handle stress, greed, and fear.
In essence, boosting trading performance means optimizing each of these components—not just chasing higher profits.
3. The Role of Psychology in Performance Enhancement
One of the most overlooked areas in trading performance is trading psychology. Markets are designed to exploit emotional weakness. Fear makes traders exit too early; greed makes them overstay; impatience makes them overtrade.
To boost performance, traders must master their mindset as much as their technical tools. Developing emotional resilience ensures that decision-making remains rational and data-driven.
Common psychological barriers to performance include:
Overconfidence after a winning streak — leading to oversized positions.
Loss aversion — refusing to accept small losses that later become big ones.
Revenge trading — trying to “win back” after a bad trade.
FOMO (Fear of Missing Out) — jumping into trades without confirmation.
Performance-oriented traders build habits to overcome these pitfalls: journaling, post-trade reviews, mindfulness, and strict adherence to pre-defined plans.
As the saying goes, “Amateurs think about profits; professionals think about process.”
4. Data-Driven Performance Tracking
You can’t improve what you don’t measure. The best traders treat their performance like a business metric. They analyze each trade’s data—entry, exit, reasoning, and emotional state.
Keeping a trading journal is essential for performance optimization. It helps identify:
Which setups yield the best risk-reward.
Which timeframes or conditions perform better.
What psychological patterns influence bad decisions.
Performance tracking transforms trading from a random activity into a process of continuous learning.
With technology today, traders can use platforms and analytics tools to review win rates, expectancy, and profit factors in detail. The more insight you gain from your data, the faster you can correct inefficiencies.
5. The Power of Risk Management
Many traders focus on predicting direction, but performance excellence is built on risk control. The best traders aren’t those who win all the time—they’re those who lose well.
Boosting performance means ensuring that no single trade, sector, or emotion can destroy your capital. By setting proper stop-loss levels, maintaining position sizing discipline, and using portfolio diversification, traders can sustain long-term growth.
A simple rule: focus on preserving capital before multiplying it.
When risk is managed well, confidence rises, emotions stabilize, and execution quality improves—all key factors in performance enhancement.
6. The Discipline of Continuous Learning
Markets are dynamic ecosystems. Sectors rotate, interest rates shift, policies evolve, and global events reshape sentiment overnight. A trader who stops learning becomes outdated.
Boosting trading performance requires an attitude of lifelong learning.
This includes:
Studying market structure and new patterns.
Understanding macroeconomic influences.
Learning from top-performing traders and case studies.
Reviewing historical trades to find recurring inefficiencies.
Every losing trade holds valuable information—if analyzed correctly. Treating mistakes as data, not failure, transforms setbacks into opportunities for growth.
7. Strategy Refinement and Adaptation
No trading system works forever. The market continuously shifts between phases—trending, consolidating, volatile, and range-bound. A strategy optimized for one condition may fail in another.
Boosting performance involves periodic backtesting and optimization.
Traders must identify when a system loses edge and adjust accordingly:
For trending markets, breakout or momentum systems perform better.
In sideways markets, mean-reversion strategies excel.
During high volatility, risk management and patience become crucial.
A performance-driven trader doesn’t rigidly follow old methods—they evolve with evidence and adaptability.
8. Time Management and Lifestyle Balance
Performance isn’t only about what happens during market hours—it’s also influenced by the trader’s lifestyle, energy, and focus. Sleep deprivation, poor diet, and stress all affect decision-making quality.
To boost trading performance, traders must treat themselves like high-performance athletes. A clear mind, rested body, and organized schedule help maintain discipline under pressure.
Creating structured trading routines—pre-market preparation, execution window, and post-market review—turns chaos into controlled productivity.
9. Technology and Automation: The Modern Edge
The modern trader has access to tools that were once reserved for hedge funds—AI scanners, algorithmic models, backtesting platforms, and advanced charting systems.
Boosting performance often involves integrating technology intelligently:
Using screeners to identify high-probability setups.
Automating repetitive tasks to save time.
Employing alerts or partial automation for disciplined execution.
Leveraging data analytics to measure trade performance.
However, technology is a double-edged sword. Overreliance without understanding can lead to complacency. The goal is to let tools enhance human decision-making, not replace it.
10. Emotional Intelligence and Decision Agility
Markets change fast. A high-performing trader must be emotionally agile—able to pivot when new information emerges. Being flexible doesn’t mean abandoning plans; it means adapting them intelligently.
Emotional intelligence (EQ) helps traders interpret uncertainty with calmness. When the market triggers fear or excitement, EQ ensures decisions remain rational. Traders with high EQ tend to recover faster from drawdowns and maintain composure during volatile sessions.
11. Setting Realistic Goals and Expectations
Boosting trading performance also means setting realistic, measurable goals. Many traders fail not because of bad strategies, but because of unrealistic expectations—wanting to double capital every month or chasing 90% win rates.
Performance growth comes from compounding small improvements:
Reducing average loss per trade.
Improving win/loss ratio slightly.
Cutting emotional trades by 20%.
These incremental gains accumulate into exponential progress over time.
12. The Importance of Community and Mentorship
Trading is often a solitary activity, but isolation can slow performance growth. Engaging with a community or mentor accelerates learning.
By sharing insights, reviewing setups, and receiving constructive feedback, traders gain external perspectives that highlight blind spots.
Mentorship helps instill discipline, professional habits, and emotional resilience—qualities that are hard to develop alone. A performance-oriented trading community acts as both a learning platform and accountability partner.
13. The Mindset of a High-Performance Trader
At its core, boosting trading performance is a mindset shift—from random execution to systematic excellence. High-performing traders treat trading like a business:
They have clear operating procedures.
They track performance metrics.
They manage emotions like professionals.
They focus on process, not short-term results.
This professional attitude transforms trading from a gamble into a structured pursuit of consistency.
14. Measuring Long-Term Success
Short-term performance can be deceptive. One good month doesn’t mean mastery, and one bad month doesn’t mean failure. The goal is long-term sustainability.
Performance boosting should therefore focus on:
Equity curve stability (smooth, controlled growth).
Risk-adjusted returns (profit relative to drawdowns).
Strategic evolution (adaptation to changing conditions).
The true mark of performance improvement is the ability to survive, adapt, and grow across multiple market cycles.
15. Conclusion: The Continuous Journey of Excellence
Boosting trading performance isn’t a one-time goal—it’s a continuous process of refinement, discipline, and self-awareness. Every trader, whether novice or professional, must view the market as a mirror reflecting their skills, psychology, and preparation.
Performance growth begins the moment a trader decides to take ownership of their results—analyzing mistakes, refining methods, and committing to constant evolution.
In a world where market edges are fleeting and technology levels the playing field, the ultimate differentiator is performance discipline. The trader who treats performance like a craft—tracking, reviewing, optimizing, and learning—inevitably rises above the crowd.
Boosting trading performance, therefore, isn’t about perfection. It’s about progress. It’s about mastering yourself as much as the markets. Because in the end, the greatest trade you’ll ever make is between your current self—and your highest potential.

Infrastructure & Capital Goods Momentum: Building India’s Growth1. Sector Overview: Foundation of Economic Growth
The Infrastructure and Capital Goods sectors are closely linked yet distinct in nature.
Infrastructure represents the creation of physical assets like roads, highways, airports, ports, metros, power grids, pipelines, and urban development projects.
Capital Goods refers to manufacturing equipment and machinery used in producing goods and services — such as engineering equipment, construction machinery, electrical systems, heavy vehicles, and automation tools.
Together, these sectors form the backbone of industrial expansion. When infrastructure improves, industrial productivity rises. And when capital goods companies thrive, it indicates that industries are investing in new capacities — a key sign of economic confidence.
2. Revival of the Capex Cycle
After nearly a decade of subdued corporate investment post-2012, India’s private capital expenditure is witnessing a broad-based revival.
Several trends are converging to create this momentum:
Government-Led Push:
The Indian government’s capital expenditure has increased by over 3.5x since FY17, with infrastructure allocations crossing ₹11 lakh crore in Budget FY25. Flagship programs like Gati Shakti, National Infrastructure Pipeline (NIP), and PM Gati Shakti Master Plan are ensuring integrated infrastructure development.
Private Sector Reinvestment:
After years of deleveraging, Indian corporates have cleaned up their balance sheets. Now, with improved demand visibility and strong profitability, private players are again investing in capacity expansion — especially in sectors like cement, steel, energy, and manufacturing.
PLI and Make-in-India Push:
The Production Linked Incentive (PLI) schemes across multiple sectors — including electronics, auto components, renewables, and defence — are catalyzing fresh capital investments. This, in turn, is boosting demand for industrial equipment and capital goods.
Urbanization and Infrastructure Expansion:
India’s urbanization rate, currently around 36%, is expected to cross 40% by 2030. This urban transition is driving demand for smart cities, transport corridors, real estate, and public utilities.
In essence, India’s capex cycle has entered a structurally positive phase — and that’s what’s fueling the ongoing rally in infrastructure and capital goods stocks.
3. Infrastructure Sector Momentum
3.1 Roads & Highways
The roads and highways segment remains the biggest beneficiary of the government’s infrastructure focus. The Ministry of Road Transport & Highways continues to allocate record budgets under the Bharatmala Pariyojana scheme.
Construction pace has averaged 35 km per day, with an aim to cross 45 km/day by 2026.
Companies like IRB Infra, KNR Constructions, HG Infra, and PNC Infratech have witnessed healthy order inflows and margin expansion.
Toll monetization and hybrid annuity models (HAM) have reduced financial risks and ensured sustainable cash flows.
3.2 Railways & Metro Projects
Indian Railways’ capital outlay crossed ₹2.5 lakh crore in FY25, focused on modernization, track electrification, and station redevelopment.
Metro rail expansion in Tier-2 cities (like Surat, Patna, Nagpur, and Indore) is opening new project opportunities.
Stocks like IRCON, RVNL, RITES, and Titagarh Rail Systems have gained sharply due to strong order pipelines and profitability visibility.
3.3 Power & Energy Infrastructure
The power infrastructure story is evolving beyond traditional generation to transmission and renewable integration.
Companies like Power Grid, KEC International, Techno Electric, and Kalpataru Projects are winning large transmission and substation orders.
The upcoming Green Energy Corridors project and National Smart Grid Mission are creating long-term opportunities in grid modernization and electrification.
3.4 Urban Infra & Water Management
Urban infrastructure — including housing, water supply, sanitation, and waste management — is gaining momentum under AMRUT 2.0, Jal Jeevan Mission, and Smart City Mission.
Players like VA Tech Wabag, L&T Construction, and NCC Ltd. are executing large urban infra contracts.
Demand for efficient project management and technology integration is driving digitalization in infra execution.
4. Capital Goods Sector Momentum
The capital goods sector’s resurgence is a clear signal that industrial demand is returning. This segment has seen a sharp order inflow in FY24-FY25, driven by public and private capex revival.
4.1 Industrial Equipment & Engineering
Companies such as Larsen & Toubro (L&T), ABB India, Siemens, and Thermax are reporting record order books.
L&T’s order inflow has crossed ₹3.3 lakh crore, with visibility across oil & gas, defence, power, and infrastructure.
Engineering exports have also picked up due to global supply chain diversification, giving Indian firms an edge.
4.2 Electrical & Automation
The automation and electrification segments are witnessing significant growth due to India’s industrial digitization wave.
ABB, Siemens, and Schneider Electric are benefiting from demand for smart factories, process automation, and EV charging infrastructure.
Domestic players like CG Power and Industrial Solutions, KEC, and Polycab are seeing strong growth in transformers, cables, and industrial systems.
4.3 Defence & Aerospace Manufacturing
The government’s push for Atmanirbhar Bharat in defence production is reshaping the landscape.
With import substitution policies and 74% FDI allowance in defence manufacturing, companies like HAL, BEL, Bharat Dynamics, and Mazagon Dock are expanding capacity.
Defence PSUs have robust order books and steady revenue visibility for the next 4–5 years.
4.4 Machinery & Construction Equipment
The construction equipment segment is riding the infrastructure boom.
ACE, JCB India, and Tata Hitachi are seeing high utilization and sales volumes.
The mechanization of rural infrastructure and smart city projects is further expanding their market.
5. Financial Performance & Market Trends
5.1 Order Book Strength
Order books across infrastructure and capital goods companies have hit multi-year highs.
For instance:
L&T’s consolidated order book: ₹4.8 lakh crore
ABB India’s order inflow growth: 25% YoY
IRCON, RVNL, and RITES: Combined orders exceeding ₹1 lakh crore
These numbers highlight strong execution visibility for the next 2–3 years.
5.2 Margin Expansion
With raw material prices stabilizing and better execution efficiency, companies are reporting operating margin improvement.
Project delays are reducing due to better financing models and project management tools.
5.3 Stock Market Momentum
Both sectors have been market leaders in the 2024–2025 rally:
The BSE Capital Goods Index surged over 60% YoY, outperforming the Sensex.
The Infrastructure Index gained nearly 45% YoY, led by PSUs and construction majors.
Retail and institutional investors have increased exposure, especially in public-sector and midcap engineering stocks.
6. PSU Leadership: The New Growth Drivers
Public Sector Undertakings (PSUs) have emerged as major beneficiaries of this momentum.
Companies like BEL, BHEL, RVNL, NBCC, and IRCON have delivered multi-bagger returns in the past two years.
These PSUs are executing large government projects with improved financial discipline and better dividend payouts.
Investor perception has shifted — PSUs are no longer “value traps,” but strategic growth vehicles aligned with national infrastructure goals.
7. Key Growth Drivers Ahead
Budgetary Allocation Continuity:
The government’s FY26 budget is likely to sustain high capital expenditure, ensuring visibility for the next several years.
Private Capex Acceleration:
Sectors like cement, metals, renewables, and chemicals are entering new capacity expansion phases, boosting machinery and engineering demand.
Green & Renewable Transition:
India’s target of 500 GW renewable capacity by 2030 will generate opportunities across energy transmission, grid modernization, and clean tech equipment.
Global Supply Chain Realignment:
Multinational companies are diversifying away from China, positioning India as a manufacturing hub — benefiting domestic capital goods makers.
Digital & Automation Integration:
The adoption of industrial automation, robotics, and IoT is creating long-term opportunities for high-tech engineering firms.
8. Challenges and Risks
While the outlook remains robust, certain risks need monitoring:
Execution Delays: Large infra projects still face bureaucratic and land acquisition challenges.
Commodity Price Volatility: Sudden spikes in steel, cement, or copper prices can affect margins.
Interest Rate Sensitivity: Infrastructure companies are capital-intensive, and high borrowing costs can impact profitability.
Global Demand Slowdown: Exports of capital goods may face headwinds if global growth slows in 2025–2026.
9. Investment Outlook: Sustained Multi-Year Opportunity
The Infrastructure & Capital Goods theme represents one of the strongest multi-year investment opportunities in India’s growth story.
Key investment themes include:
PSU Infrastructure Leaders: IRCON, RVNL, BEL, NBCC
Private Engineering Majors: L&T, Siemens, ABB, Thermax
Construction & EPC Specialists: KNR Constructions, HG Infra, NCC, Kalpataru
Electrical Equipment & Automation: CG Power, Polycab, KEI Industries, KEC International
Investors should focus on companies with:
High order book-to-revenue ratios
Healthy balance sheets
Strong execution track records
Exposure to sunrise sectors like renewables, defence, and automation
10. Conclusion
India’s Infrastructure and Capital Goods momentum marks the beginning of a new growth era.
After years of policy groundwork, the country is witnessing the materialization of its infrastructure dreams — from world-class highways to modern railways, from green energy corridors to smart cities.
The capital goods industry, in turn, is powering this transformation with engineering excellence, technological adoption, and renewed corporate confidence.
With government capex and private investments working in tandem, these sectors are not just cyclical plays anymore — they represent structural growth themes for the next decade.
As India builds the foundation for its $5 trillion economy target, Infrastructure and Capital Goods will remain its most powerful pillars — delivering both economic strength and market leadership.

IT Sector Reversal Plays1. Background: The Downtrend in the IT Sector
From 2022 to mid-2024, the Indian IT sector witnessed a significant correction. After peaking during the pandemic-era digital boom, IT stocks went through a period of multiple headwinds:
Margin pressures due to rising employee costs and elevated attrition.
Slowdown in global tech spending, especially in the U.S. and Europe, as clients became cautious about discretionary IT projects.
Macroeconomic uncertainty—rising interest rates, inflation, and recession fears affected deal pipelines.
Valuation compression after excessive run-ups during 2020–2021.
Major companies like Infosys, TCS, Wipro, HCLTech, and Tech Mahindra faced 25–40% price corrections from their highs. Even mid-cap IT names such as LTIMindtree, Coforge, Mphasis, and Persistent Systems lost significant value as growth visibility weakened.
But as markets evolve, every extended correction eventually sets the stage for a reversal — and that’s where the IT sector stands now.
2. The Current Setup: Signs of Reversal Emerging
Since mid-2024, a gradual shift in market tone has become visible. Several indicators now suggest the IT sector could be transitioning from a bearish phase to a structural recovery phase. Let’s break down the key reversal signals:
a) Technical Bottom Formation
The Nifty IT Index, after correcting nearly 35% from its 2021 peak, has formed a strong multi-quarter base around the 28,000–30,000 range.
Higher lows are visible on weekly charts, indicating that selling pressure is subsiding.
Volume spikes during up-moves suggest accumulation by institutional investors.
The 200-day moving average (DMA), which acted as resistance for nearly two years, has now been decisively reclaimed by most IT heavyweights.
Relative Strength Index (RSI) readings have shifted from bearish to neutral-bullish territory (above 50), reinforcing momentum buildup.
b) Valuation Comfort Zone
Post-correction, the sector’s valuation multiples have normalized:
The Nifty IT Index trades at 20–22x forward earnings, compared to 32–35x at the 2021 peak.
This makes the risk–reward ratio attractive, especially with improving earnings visibility in FY26.
c) Macro Tailwinds Re-emerging
Global inflation has cooled off, prompting central banks like the U.S. Federal Reserve to hint at rate cuts. Lower interest rates support IT spending, especially on digital transformation and cloud modernization.
Dollar stability and moderate INR depreciation enhance revenue visibility for export-heavy Indian IT companies.
The AI and automation cycle is creating fresh demand pockets across industries, opening new revenue streams.
Together, these factors suggest that the worst may be behind the IT sector, setting the stage for meaningful reversals.
3. Fundamental Triggers Behind the Reversal
Beyond charts and valuations, several fundamental developments are adding strength to the reversal narrative.
a) Rebound in Deal Wins
In recent quarters, large-cap IT companies have reported healthy deal signings:
TCS and Infosys are witnessing multi-year transformation contracts from BFSI, retail, and manufacturing clients.
HCLTech and LTIMindtree are leading in cloud modernization and digital engineering deals.
Tech Mahindra has stabilized its communications business and is pivoting to AI-driven customer experience solutions.
Total contract value (TCV) figures have improved sequentially, reflecting a revival in client confidence.
b) Margin Recovery
After years of pressure from rising wage costs and attrition, IT firms are now benefiting from:
Lower employee churn (attrition down to 13–14% vs. 22–24% in FY23).
Reduced subcontracting expenses as project utilization improves.
AI-driven productivity tools reducing manpower dependency.
Together, these trends are expected to lift operating margins by 100–150 bps over FY26.
c) Cost Optimization and Automation Push
Indian IT companies are actively adopting Generative AI, automation platforms, and cloud-based delivery models to improve productivity and reduce delivery costs.
Examples include:
Infosys’ Topaz platform,
TCS’ AI.WorkBench, and
HCLTech’s AI Force initiative.
These not only enhance efficiency but also attract higher-value projects, boosting profitability and client stickiness.
d) Demand Diversification
While BFSI and telecom remain key verticals, growth is emerging from manufacturing, energy, healthcare, and retail—driven by Industry 4.0, sustainability analytics, and customer experience technologies.
4. Leadership Rotation Within the Sector
Not all IT stocks will perform equally during a reversal. Leadership rotation is already visible across categories:
a) Large-Cap Leaders
TCS: Stable growth, superior margins, strong AI pipeline. Technically leading with a breakout above long-term resistance near ₹4,200.
HCLTech: Operational excellence, resilient client mix, and cloud deals supporting momentum.
Infosys: Recovering from weak quarters; strong positioning in digital transformation and automation.
These stocks form the anchor base of the reversal.
b) Mid-Cap Outperformers
Mid-cap IT names often outperform in the second phase of reversals due to higher growth potential.
Coforge: Strong U.S. exposure, digital engineering capabilities.
LTIMindtree: Aggressive client acquisition and synergistic benefits post-merger.
Persistent Systems: Consistent revenue growth from AI, data analytics, and product engineering.
Mphasis: Benefiting from stability in BFSI and new-gen cloud deals.
c) Small-Cap Recovery Plays
Select niche players such as Sonata Software, Birlasoft, and Zensar Technologies are showing early breakout structures, driven by turnaround earnings and margin expansion.
5. Institutional Flows and Market Sentiment
Foreign Institutional Investors (FIIs), who were heavy sellers in IT during 2022–2023, have returned to the sector in 2025 as valuations turned attractive and U.S. recession fears faded.
Data shows:
FIIs have increased exposure to IT by nearly 12% over the last two quarters.
Domestic Mutual Funds are also raising IT weights in portfolios, reversing the underweight stance.
This institutional participation is a critical confirmation of a sectoral reversal, indicating confidence in medium-term earnings visibility.
6. The Role of AI and Digital Transformation
A structural driver of the IT sector’s next growth cycle will be Artificial Intelligence (AI) and GenAI-led transformation. Global enterprises are investing heavily in:
AI-driven automation of business workflows,
Cloud data modernization,
Predictive analytics, and
Cybersecurity.
Indian IT companies, with their massive engineering talent and delivery scale, are strategically positioned to capture a significant portion of this demand.
This emerging AI monetization cycle could power the next 3–5 years of sustainable growth, making the ongoing reversal more structural than cyclical.
7. Potential Risks to the Reversal
While optimism is building, investors must remain aware of risks that could slow or invalidate the reversal:
Global demand slowdown due to renewed economic shocks.
Currency volatility, especially sharp INR appreciation against USD.
Delay in AI monetization or overhyped expectations.
Geopolitical disruptions in the U.S. or Europe impacting client budgets.
However, these risks appear manageable in the current macro context, with most IT companies maintaining strong balance sheets and consistent cash flows.
8. Strategic Outlook: How Traders and Investors Can Play the Reversal
a) Short-Term Traders
Focus on momentum plays — buying on dips near support zones and exiting near resistance.
Use RSI and volume confirmation for entry points.
b) Positional Investors
Build exposure in phased accumulation, especially in large-cap names like TCS, Infosys, and HCLTech, as they offer stability and dividend yield.
c) Aggressive Investors
Look toward mid-cap IT with improving earnings visibility — Coforge, Persistent, and LTIMindtree — for higher alpha generation during the reversal.
d) Long-Term Portfolio Builders
Adopt a three-year horizon, aligning with the global digital and AI transformation wave. The IT sector’s structural uptrend could mirror the 2013–2017 rally phase.
Conclusion: From Fear to Opportunity
The Indian IT sector stands at a pivotal juncture in late 2025. After nearly three years of correction and consolidation, the stage appears set for a broad-based reversal, driven by:
Stabilizing global macro conditions,
Margin recovery and deal wins,
AI-led transformation opportunities, and
Renewed institutional participation.
From a market structure perspective, IT is shifting from accumulation to breakout, making it one of the most promising contrarian plays heading into FY26.
In essence, “IT Sector Reversal Plays” are not just short-term technical bounces but potentially the beginning of a multi-year structural recovery, where leadership will rotate from defensive large caps to agile mid-cap innovators.
For investors with patience, discipline, and an eye on evolving technology trends, this reversal could mark the next wealth creation phase in India’s capital markets.
