Part 2 Intraday Trading Master ClassMargin and Risk Management
Option buying requires no margin except the premium.
Option selling requires high margin because:
Risk is unlimited.
Exchanges demand safety.
Risk Management Rules
Never sell naked options without stop-loss.
Avoid selling during high volatility events.
Use spreads to reduce risk.
Position size properly—do not over-leverage.
Trend Lines

Part 1 Intraday Trading Master ClassIndex Options vs Stock Options
Index Options
Extremely liquid
Weekly expiry
Less manipulation
Ideal for intraday traders
Stock Options
Monthly expiry only
Higher margin for selling
Less liquid compared to index
Better for positional strategies

Option Trading Premium: The Price of an Option
Premium is the amount the option buyer pays to the seller. It is influenced by:
Intrinsic Value
Time to Expiry
Volatility (IV)
Interest Rates
Demand–Supply
Premium tells you how expensive or cheap an option is at a given moment.

Part 2 Support and Resistance Premium: The Price of an Option
Premium is the amount the option buyer pays to the seller. It is influenced by:
Intrinsic Value
Time to Expiry
Volatility (IV)
Interest Rates
Demand–Supply
Premium tells you how expensive or cheap an option is at a given moment.

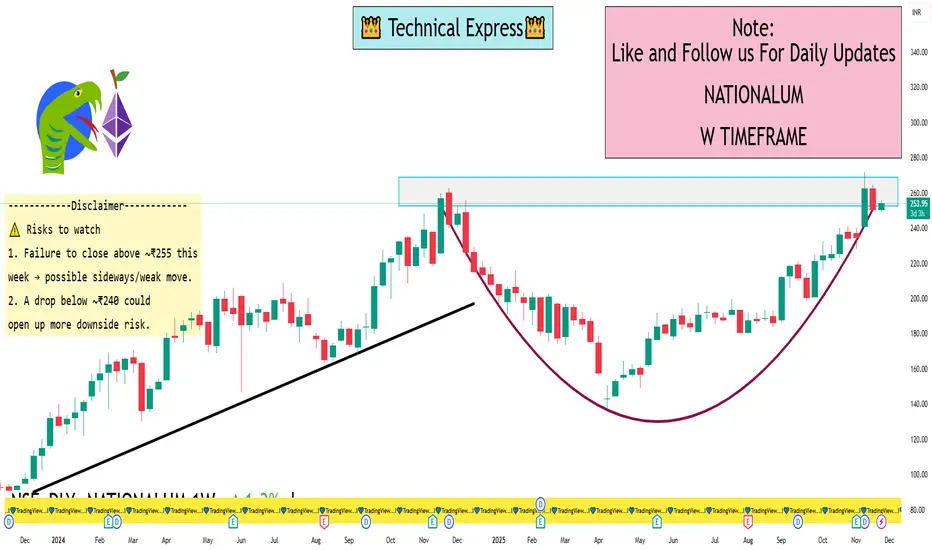
NATIONALUM 1 Week View 📊 Snapshot
Current price: ~ ₹253–254.
Weekly pivot (classic) on weekly timeframe: ≈ ₹254.92.
Weekly support levels: ≈ ₹245.54 (S1), ₹240.40 (S2)
Weekly resistance levels: ≈ ₹260.06 (R1), ₹269.44 (R2)
✅ Key levels to monitor this week
Near term resistance: ~ ₹255–256
Primary target if bullish: ~ ₹260
Extended upside: ~ ₹269 (if strong breakout)
Primary support: ~ ₹245.5
Secondary support: ~ ₹240
⚠️ Risks to watch
Failure to close above ~₹255 this week → possible sideways/weak move.
A drop below ~₹240 could open up more downside risk.
Being in the metals sector, external factors (global aluminium price, energy costs, mining issues) can influence price rapidly even if technicals look okay.
Option Greeks and Advanced Hedging Strategies1. Understanding the Core Option Greeks
1. Delta – Sensitivity to Price Movement
Delta measures how much an option’s price changes for a ₹1 change in the underlying asset.
Call options: Delta ranges from 0 to +1.
Put options: Delta ranges from 0 to –1.
High-delta options behave almost like the underlying, while low-delta options react slowly.
Use: Directional trades, risk measurement, delta-neutral hedging.
2. Gamma – Rate of Change of Delta
Gamma shows how fast delta changes. It is highest for at-the-money options and near expiry.
High gamma means your delta can shift quickly, increasing risk if the market moves suddenly.
Use: Managing intraday fluctuations, protecting against rapid price moves.
3. Theta – Time Decay
Theta measures how much an option’s price erodes daily due to time decay.
Short option sellers benefit from positive theta.
Long option buyers suffer negative theta.
Theta accelerates as expiry approaches, especially for ATM options.
Use: Deciding when to buy or sell options based on time decay.
4. Vega – Sensitivity to Volatility
Vega estimates how much the option price changes when implied volatility changes by 1%.
High vega = large impact of volatility.
ATM and longer-dated options have higher vega.
Use: Volatility trading, earnings strategies, long straddles/strangles, volatility crush hedging.
5. Rho – Sensitivity to Interest Rates
Rho measures how an option’s value changes when interest rates move.
Rho is more relevant in long-dated options (LEAPS).
Higher rates tend to increase call prices and reduce put prices.
Use: Institutional hedging, bond-linked derivatives, macro-based hedging.
2. Why Greeks Matter in Trading
Each Greek reveals a different dimension of risk. A professional trader doesn’t just react to price; they monitor how Greeks shift across time, volatility, and market conditions.
Delta controls directional exposure.
Gamma controls how quickly direction changes.
Theta affects profitability over time.
Vega controls volatility risk.
Rho impacts rate-sensitive options.
A complete risk management system balances all Greeks using hedging strategies.
3. Advanced Hedging Strategies Using Greeks
A. Delta Hedging – Neutralising Directional Risk
Delta hedging means adjusting your underlying shares to keep delta = 0.
Example:
If you hold a long call with delta 0.60, buying 100 calls gives you 60 delta. To hedge, sell 60 shares.
This protects you from directional movement but NOT volatility or time decay.
When to Use Delta Hedging
For market-making
For large option sellers
During high volatility events
For maintaining non-directional strategies like straddles/strangles
B. Gamma Hedging – Controlling Delta Drift
Gamma hedging stabilises delta by using additional options, often opposite positions.
If gamma is high, delta changes rapidly, creating risk during volatile markets.
How It Works
Use options with opposite gamma to neutralise fluctuations.
Typically buy long-dated options with high gamma to stabilise short-dated high-gamma positions.
Gamma hedging is crucial for short option sellers who face rapid delta shifts.
C. Vega Hedging – Reducing Volatility Exposure
Traders hedge volatility by combining options that offset each other’s vega.
Methods
Buy/Sell options in different expiries
Use calendar spreads
Use ratio spreads
Example:
Long a straddle in near-month?
Hedge vega risk by shorting far-month options.
Vega hedging protects you from implied volatility crush (particularly important around earnings).
D. Theta Hedging – Managing Time Decay Exposure
Theta risk affects long option buyers and short sellers differently.
If you are long options, hedge with short theta (credit spreads).
If you are short options, hedge with long options (debit spreads).
Common Theta-hedging tools:
Iron condors
Credit spreads
Calendar spreads
Butterfly spreads
These strategies help balance time decay while limiting risk.
E. Rho Hedging – Interest Rate Risk
For long-dated options, changes in interest rates matter.
Institutions hedge by:
Taking opposite positions in interest-rate futures
Adjusting long-dated calls and puts
Rho hedging is mainly used in currency options, index options, and LEAPS.
4. Advanced Multi-Greek Hedging Strategies
Professional hedging often needs balancing multiple Greeks simultaneously.
1. Delta-Gamma Hedging
Objective: Neutralise both delta and gamma.
Used when markets are expected to stay within a range but may see temporary swings.
How to Construct:
Begin with the main option position.
Add options with opposite gamma until gamma ≈ 0.
Adjust underlying shares to bring delta to zero.
This creates a smoother risk profile.
2. Delta-Vega Hedging
Useful when trading volatility strategies like straddles or calendar spreads.
Approach:
Start with volatility-based position (e.g., long straddle).
Hedge delta with underlying.
Hedge vega by using options in different expiries.
This isolates pure volatility trading.
3. Delta-Theta Hedging
Designed for option sellers to offset excessive time decay sensitivity.
Tools:
Credit spreads
Butterfly adjustments
Ratio spreads
This prevents sudden losses from time decay acceleration.
4. Vega-Gamma Hedging
This is highly advanced and used by professional volatility traders.
Gamma and vega often move together.
High gamma = high vega.
So traders hedge using combinations of:
Calendar spreads
Diagonal spreads
Backspreads
Purpose: Generate controlled exposure to volatility without directional risk.
5. Key Advanced Hedging Strategies in Practice
A. Calendar Spreads (Time Arbitrage)
Buy long-dated options (high vega & low theta) and sell short-dated options (low vega & high theta).
Benefits:
Profits from volatility differences
Controls theta
Low directional risk
Great for hedging earnings uncertainty.
B. Iron Condors (Range-Bound Hedging)
Combines call and put credit spreads.
Purpose:
Profit from time decay
Hedge delta by balancing calls and puts
Low vega exposure
Institutions love condors because they naturally hedge multiple Greeks.
C. Ratio Spreads (Directional Volatility Hedging)
Example: Buy 1 ATM call, sell 2 OTM calls.
Benefits:
Balances delta
Captures volatility
Controls gamma risk
This is used when anticipating gradual price rise, not a breakout.
D. Straddles and Strangles (Gamma & Vega Plays)
Used when expecting high volatility.
To hedge:
Use delta hedging intraday
Use calendar spreads for vega hedging
Use stop adjustments to manage gamma risk
E. Butterfly Spreads (Controlled Gamma Exposure)
Butterflies offer controlled risk with defined payoff.
Benefits:
Low delta
Low vega
Balanced theta
Perfect for traders expecting low volatility and stable prices.
6. Professional Tips for Greek Management
Never hedge only delta—monitor gamma and vega too.
Use options in multiple expiries to stabilise vega and theta.
Avoid high gamma exposure near expiry unless you can adjust quickly.
Hedge dynamically—Greeks change every second.
In volatile markets, hedge more frequently.
Always check net Greeks of your entire portfolio, not individual trades.
Use spreads instead of naked options for balanced Greek profiles.
Conclusion
Option Greeks form the foundation of professional derivatives trading. Delta, gamma, theta, vega, and rho each describe different risk dimensions. Advanced hedging strategies combine these Greeks to build stable, market-neutral, volatility-neutral, or time-neutral portfolios. Whether trading directional moves, volatility events, or range-bound markets, mastery of Greek-based hedging is essential for long-term consistency and capital protection.
Microstructure Trading Edge1. What Is Microstructure Trading?
Microstructure trading focuses on:
Order flow (who is buying/selling and with what urgency)
Liquidity (where big orders sit in the book)
Bid–ask dynamics
Market maker behavior
Execution algorithms
Slippage and transaction cost analysis
Short-term price impact
Instead of predicting future prices using patterns, a microstructure trader reads the real intentions of market participants through order book changes, volume imbalances, and execution footprints.
This gives the trader the ability to:
Enter before breakouts actually occur
Predict fakeouts and liquidity grabs
Spot absorption by big players
Identify high-probability reversal points
Understand when momentum is real or manufactured
In short, microstructure trading is about recognizing the behavior of money, not the movement of lines.
2. The Foundation of Microstructure Edge
A microstructure trading edge emerges when you consistently identify and exploit inefficiencies in:
Order execution
Limit order placement
Market maker risk control
Liquidity distribution
Price impact of aggressive orders
These inefficiencies exist because:
Limit orders are placed by humans and algorithms with predictable patterns
Market makers adjust spreads based on risk
Large players cannot hide their intentions completely
Liquidity is uneven and clustered around obvious levels
Retail traders chase breakout candles, creating temporary mispricings
Understanding these behaviors offers a structural edge rather than a psychological one.
3. Key Elements of Microstructure Trading
(A) Order Flow Analysis
Order flow tells you the story behind every candle.
Key concepts:
Aggressive Buying → Market buy orders lifting liquidity at ask
Aggressive Selling → Market sell orders hitting bids
Delta and Cumulative Delta → Shows the net buying/selling pressure
Example edge:
If price is rising but cumulative delta is falling, it indicates passive absorption, meaning big players are selling into the rally. A sharp drop is likely ahead.
(B) Liquidity Pools
Liquidity pools are areas where large stop-losses or limit orders accumulate:
Swing highs/lows
Round numbers
Previous day high/low
Big figure levels
VWAP
Smart money often pushes price toward these pools to trigger liquidity and fill their large orders.
Edge:
When price aggressively taps a liquidity pool but shows no follow-through, it often marks a reversal or fade opportunity.
(C) Market Maker Behavior
Market makers provide liquidity but also:
Adjust spreads based on volatility
Absorb or reject aggressive orders
Hedge inventory risks
Manipulate micro-movements to attract order flow
A microstructure trader watches for:
Spread widening (hinting at imbalance)
Sudden liquidity removal
Fake liquidity (spoofing)
Iceberg orders
Hidden limit orders
When you know why a market maker widens spreads or pulls liquidity, you get clues about impending volatility or direction.
(D) Price Impact Models
Large institutional orders create predictable patterns:
They move price in the direction of the trade
The price impact is nonlinear—bigger orders have exponentially higher impact
They break orders into small chunks using algorithms (VWAP, TWAP, POV)
A microstructure trader identifies these patterns through:
Consistent small prints at fixed intervals
Volume clustering
Slow grind with no retracements
This often signals algorithmic accumulation or distribution, forming early entries.
(E) Queue Position & Execution Advantage
In limit order markets, queue priority matters.
Being early in the queue gives:
Better fill probability
Lower slippage
Reduced adverse selection
HFT firms exploit this with:
Speed advantage
Order anticipation
Rebate capturing
Retail traders can still gain edge through:
Using limit orders at well-selected liquidity zones
Avoiding poor execution times (open & close volatility)
Minimizing mechanical slippage
This transforms trading from random entries to strategic liquidity positioning.
4. Types of Microstructure Trading Edges
1. Liquidity Edge
Understanding where liquidity sits allows you to anticipate:
Stop hunts
False breakouts
Sharp reversals
You know why price moves, not just where.
2. Order Flow Timing Edge
Knowing when aggressive orders enter the market helps you:
Ride momentum early
Avoid fading strong pressure
Identify trap moves
This is especially powerful during:
First 15–30 minutes
News volatility
Breakout retests
3. Market Maker Pattern Edge
Market makers behave consistently under:
Low liquidity
Sudden volatility
One-sided order flow
Recognizing their footprints gives you:
High-probability scalps
Reversal signals
Safe entry timing
4. Execution Efficiency Edge
Improving order placement reduces:
Slippage
Costs
Unnecessary losses
Over thousands of trades, this becomes a significant edge.
5. Structural Pattern Edge
Microstructure traders often specialize in:
Liquidity grabs
Absorption blocks
Exhaustion prints
Imbalance continuation
Fair value gaps
Order blocks
Auction inefficiencies
These are not traditional chart patterns—they are behavioral signatures of large traders.
5. Practical Microstructure Trading Strategies
(1) Liquidity Grab Reversal Strategy
Steps:
Identify swing high/low with visible liquidity.
Wait for price to spike into the zone aggressively.
Watch order flow:
If volume spikes but price fails to follow → absorption.
Enter toward the opposite direction.
Target nearest imbalance or range midpoint.
Edge: You ride the trapped traders’ pain.
(2) Imbalance Continuation Strategy
Look for strong one-sided delta.
Price creates a displacement (fast move).
Wait for shallow pullback into imbalance or fair value gap.
Enter with trend.
Exit before next liquidity pool.
Edge: You ride institutional execution algorithms.
(3) Absorption Detection Strategy
Price approaches support/resistance.
Aggressive buying/selling is absorbed by opposite passive orders.
Price struggles to break despite large market orders.
Enter opposite direction.
Edge: You detect hidden limit orders absorbing flow.
6. Why Microstructure Trading Works
Human and algorithmic behaviors repeat
Liquidity distribution is predictable
Markets must move to fill large orders
Retail traders consistently provide exploitable patterns
Market makers follow rules and risk constraints
Order flow cannot be completely hidden
Microstructure trading edge is structural and durable, unlike pattern-based edges which decay over time.
7. Final Thoughts
Microstructure trading offers a deep understanding of why price moves, not just where it moves.
By studying order flow, liquidity, market maker behavior, and execution mechanics, traders gain a sustainable edge rooted in the actual functioning of markets. It requires discipline, screen time, and precision, but the rewards are significant—superior timing, reduced risk, and higher accuracy.

Swing Trading Secrets1. The Secret of Trend Recognition
The biggest secret of profitable swing trading is identifying the dominant trend of the market. Most novices try to pick tops and bottoms, but professionals follow the path of least resistance. Trend recognition means:
Uptrend: Higher highs (HH) + higher lows (HL)
Downtrend: Lower highs (LH) + lower lows (LL)
Range: Price oscillates between support and resistance
Swing traders do not predict; they react. They align trades with the existing trend.
For example:
In an uptrend, they wait for pullbacks to key levels.
In a downtrend, they short the rallies.
In a range, they buy at support and sell at resistance.
Knowing the trend keeps traders on the right side of probability.
2. The Secret of Patience and Timing
Effective swing traders don’t enter randomly. They wait for specific conditions:
A. The market must be near a key level
Trendline touch
Moving average support (e.g., 20-EMA, 50-EMA)
Fibonacci retracement (38.2%, 50%, 61.8%)
Previous swing high/low
Volume clusters
B. Price must confirm the reversal or continuation
Patience allows the market to “show its hand” before entering.
The secret: wait for the candle close, not the candle forming.
Many traders lose because they enter too early. Timing matters more than direction.
3. The Secret of Multi-Timeframe Confluence
Professional swing traders use multiple timeframes:
Higher timeframe (HTF): 1-week or 1-day → Trend direction
Trading timeframe (TTF): 4-hour or 1-day → Entry zones
Lower timeframe (LTF): 1-hour or 15-min → Entry trigger refinement
This is called top-down analysis.
If the weekly chart shows an uptrend, the daily chart shows a pullback, and the 4-hour chart shows a bullish reversal pattern, the probability of success becomes extremely strong.
Multi-timeframe alignment is a powerful edge.
4. The Secret of High-Probability Patterns
Swing traders rely on chart patterns—not lots of patterns, just a handful of powerful ones that repeat reliably.
A. Continuation Patterns
Bull flag
Bear flag
Ascending triangle
Descending channel
These indicate that the trend is likely to continue.
B. Reversal Patterns
Double top / double bottom
Head and shoulders
Morning star / evening star
Hammer / shooting star
C. Breakout Patterns
Cup and handle
Range breakout
Consolidation breakout
Professional traders focus on clean patterns. If the pattern is messy, overlapping, or unclear, they move on.
5. The Secret of Volume Analysis
Price shows direction; volume shows conviction.
High-probability swing trades usually show:
High volume on breakouts
Low volume on pullbacks
High volume on reversal candles
Volume spikes at support/resistance
Volume acts like a lie detector. If a breakout happens on weak volume, it is often a trap.
Understanding volume helps traders avoid false signals.
6. The Secret of Risk Management
Most swing traders fail not because their strategy is bad but because their risk management is weak.
Professionals follow these golden rules:
Risk only 1–2% of capital per trade
Always place a stop-loss
Size positions based on volatility
Avoid overtrading
Never increase lot size after a loss
The greatest secret:
Protecting capital is more important than making profits.
A trader who avoids major losses can survive long enough to catch big winning swings.
7. The Secret of Support & Resistance Mastery
Swing traders obsess over support and resistance levels.
These levels act as price magnets and turning zones.
Key levels include:
Previous swing highs/lows
Daily, weekly, and monthly levels
Psychological numbers (100, 500, 1000)
Fibonacci retracement levels
Supply and demand zones
Swing traders wait for price reactions at these levels and only trade when confirmation appears.
8. The Secret of Using Indicators the Right Way
Professional swing traders use indicators as confirmation, not decision-making tools.
Popular indicator combinations:
A. Trend + Momentum
50-EMA or 200-EMA + RSI
20-EMA + MACD
B. Pullback Identification
Bollinger Bands
Stochastic RSI
C. Breakout Confirmation
Volume + MACD
RSI breakout
The secret:
Use indicators sparingly—2 or 3 maximum.
Clear charts produce clearer decisions.
9. The Secret of Trading Psychology
Swing trading rewards emotional control.
Professionals master:
A. Discipline
Follow the plan strictly.
B. Patience
Wait for the best setups.
C. Emotional Detachment
React to charts, not feelings.
D. Consistency
A few high-quality trades outperform dozens of random trades.
The less emotionally involved a trader is, the better they perform.
10. The Secret of Journaling Every Trade
This is one of the most underrated secrets.
A trade journal includes:
Entry and exit
Stop loss
Chart screenshots
Reason for trade
Mistakes
Market context
Journaling forces self-reflection and dramatically improves discipline and performance.
11. The Secret of Avoiding News-Based Noise
Swing traders avoid making decisions during:
Major economic announcements
Earnings reports
Policy changes
High volatility events
News can create unpredictable spikes that damage swing positions.
Professionals stay defensive during such periods.
12. The Secret of Letting Winners Run
One of the greatest swing trading secrets is knowing when not to exit early.
Successful traders:
Trail their stop-loss
Add positions in trend continuation
Hold until target zones are met
Small losses and big wins create long-term profitability.
Conclusion
Swing trading appears simple but demands mastery of multiple elements—trend recognition, timing, patience, volume interpretation, chart patterns, risk management, and psychology. The real secrets lie not in magical indicators but in disciplined execution and consistent behavior. When traders combine technical analysis with emotional control, they unlock the ability to capture market swings with confidence and accuracy.

Traders’ Psychology in Indian Markets1. The Foundation of Trading Psychology
Trading psychology refers to the mindset and emotional framework that shapes how traders think, behave, and make decisions in the market. It includes:
Emotions like fear, greed, hope, and regret
Behavioural biases such as overconfidence or loss aversion
Mental discipline in following strategies
Risk-taking ability and rational thinking
The ability to stay calm under pressure
In India’s fast-moving markets—especially in derivatives where leverage is high—psychology becomes even more important. It is often said that 90% of trading is psychology, and 10% is strategy, because the best strategy fails without disciplined execution.
2. Key Emotional Drivers in Indian Markets
A. Fear
Fear in trading emerges in two forms:
Fear of losing money
New traders in Indian markets often exit trades too early, especially after a small profit, because they are fearful of giving it back. On the flip side, they may hold losing positions for too long due to fear of booking a loss.
Fear of missing out (FOMO)
When indices rise sharply—like Nifty or Bank Nifty during bullish momentum—retail traders chase moves without proper analysis. This leads to poor entries and emotional exits.
B. Greed
Greed pushes traders to:
Overtrade
Increase lot sizes impulsively
Avoid booking profits
Try to “recover” losses quickly
Take trades without setups during high market volatility
Greed is particularly visible during stock rallies, upper circuits, or news-driven moves in Indian markets.
C. Hope
Hope is dangerous in trading. Many Indian traders hold losing positions expecting a reversal that never comes. Especially in futures or options, this behaviour can destroy capital quickly.
Hope is not a strategy; discipline is.
D. Regret
Regret shapes trader behaviour by:
Influencing revenge trading
Causing hesitation in new trades
Creating emotional instability
A trader who missed a move in HDFC Bank or Reliance may jump aggressively into unrelated trades out of frustration.
3. Behavioural Biases Influencing Indian Traders
India’s trading community is heavily influenced by behavioural finance. Some common biases are:
A. Herd Mentality
Retail traders often follow social media tips, TV channels, WhatsApp groups, or Telegram “gurus”. This results in:
Blindly following others
Entering trades without analysis
Impact-driven movements in small-cap/mid-cap stocks
Herd mentality is one of the biggest reasons behind widespread losses.
B. Overconfidence
After a series of winning trades, traders feel invincible. They increase risk, ignore stop-losses, or believe the market will follow their prediction.
Overconfidence particularly hurts option buyers or scalpers in indices.
C. Loss Aversion
Indian traders find it harder to book losses than to book profits. This leads to:
Small profits and big losses
Poor risk–reward ratios
Emotional stress
Loss aversion is the biggest barrier to consistent profitability.
D. Recency Bias
Recent events overly influence decisions. For example:
A breakout stock yesterday → expected breakout today
Yesterday’s trending market → expectation of another trending day
Markets rarely repeat exactly the same behaviour daily.
4. The Unique Indian Market Environment
Indian traders face specific psychological challenges due to:
A. High Retail Participation
Retail traders form a large chunk of volume in Indian derivatives. High participation increases sentiment-driven volatility.
B. Leverage Availability
Futures and options provide leverage, making emotional mistakes more costly.
C. News Sensitivity
Announcements related to:
RBI policy
Government budgets
Corporate earnings
Election outcomes
Global cues (US markets, crude, dollar index)
create sharp, unpredictable intraday spikes causing emotional swings.
D. Social Influence
Many Indian traders engage in trading communities. While community learning is positive, excessive dependence leads to bias and emotional reactions.
5. Psychological Stages of an Indian Trader’s Journey
Stage 1: Excitement and Overtrading
Beginners start with unrealistic expectations. They trade too much, expecting daily income.
Stage 2: Confusion and Losses
After repeated losses, frustration builds. Emotion-based trading increases.
Stage 3: Realization
Traders understand that psychology, risk management, and discipline matter more than strategy.
Stage 4: Discipline and Structure
A mature trader develops:
A trading journal
A fixed system
Consistent risk rules
Emotional stability
Stage 5: Consistency
The trader learns not to force trades and accepts that the goal is consistency, not perfection.
6. How Indian Traders Can Build Strong Psychology
A. Create a Trading Plan
A plan includes:
Instruments to trade
Timeframe
Entry and exit rules
Stop-loss levels
Risk per trade
A written plan removes emotional decision-making.
B. Position Sizing
Keeping risk low per trade reduces psychological pressure. Professional traders risk 0.5%–2% of capital per trade.
C. Practice Patience
Impatience is common in Indian markets, especially in intraday index trading. Patience allows traders to wait for perfect setups rather than jumping into noise.
D. Control Overtrading
Limiting trades per day helps avoid emotional spirals.
E. Accept Losses
Losses are part of the business. Emotionally detaching from losses is key to long-term success.
F. Maintain a Trading Journal
A journal records:
Entry/exit
Reason for trade
Emotions felt
Outcome
Reviewing it helps identify emotional patterns.
G. Meditation & Mindfulness
Many successful traders practice breathing techniques, meditation, or mindfulness to stay calm during market movements.
H. Avoid Tips and Noise
Rejecting social media signals protects traders from herd behaviour and emotional trading.
7. The Mindset of a Successful Indian Trader
A disciplined trader:
Is comfortable with uncertainty
Never chases trades
Controls emotions, not the market
Focuses on risk first, returns second
Follows rules even on losing days
Does not attach ego to market decisions
Trading success comes from mental strength, not from predicting direction.
8. Final Thoughts
Traders’ psychology is the cornerstone of success in Indian markets. While strategies, charts, and indicators are important, they are secondary. The real challenge is managing yourself. Markets consistently test patience, discipline, fear, and greed. Those who master their psychology thrive; those who don’t repeat cycles of emotional trading and losses.
In the Indian trading landscape—full of volatility, leverage, news triggers, and retail activity—the ability to control emotions becomes even more crucial.
Master psychology, and the market becomes a place of growth, consistency, and opportunity.

Trading with Automated Systems in the Indian Market1. What Is Automated Trading?
Automated trading is a method of executing trades using pre-defined rules, strategies, and algorithms without requiring manual intervention. Instead of manually clicking buy or sell, traders write logic such as:
Buy Nifty futures when RSI < 30
Exit the trade when profit reaches ₹3,000
Place stop loss at 1%
Square off all positions by 3:20 PM
Once the rules are defined, the system executes trades automatically through the broker’s API.
In India, automated trading became popular after exchanges allowed API-based access and brokers enabled retail algos. Today, many traders use Python-based systems, no-code platforms like Tradetron, or broker APIs like Zerodha Kite API, Angel One SmartAPI, and Alice Blue ANT API.
2. Growth of Automated Trading in India
The Indian market has witnessed exponential growth in automation due to several factors:
High volume and volatility in indices like Nifty and Bank Nifty
Lower brokerage costs and zero-cost APIs
Rise of fintech platforms providing retail algos
Increased participation of proprietary firms and HFT desks
Demand for disciplined trading among retail investors
Today, over 70% of market orders in India are algorithmically generated (including institutional HFT).
3. How Automated Trading Works
Automated trading has three core components:
(A) Strategy Development
Strategies are based on:
Technical indicators (MACD, RSI, Supertrend)
Price action (breakouts, volume analysis)
Statistical models (mean reversion, pairs trading)
Options strategies (straddles, strangles, spreads)
Machine learning models
Traders define:
Entry rules
Exit rules
Risk management rules
Position sizing
Time filters
(B) Execution System
The execution engine connects the logic to market orders. This involves:
Strategy triggers a signal
System sends order via broker API
Broker sends order to exchange
Confirmation is sent back to the algorithm
Execution speed is measured in milliseconds.
(C) Risk Management Layer
A robust algo includes:
Stop loss
Trailing stop
Maximum daily loss
Maximum number of trades
Auto-square-off time
In India, proper risk controls are critical due to the fast movement in index derivatives.
4. Types of Automated Trading in the Indian Market
1. Trend-Following Systems
These strategies buy when the market breaks out and sell on breakdowns.
Example: Supertrend, Moving Average Crossover
2. Mean-Reversion Systems
Prices are assumed to return to their average after deviation.
Example: RSI, Bollinger Bands pullback
3. High-Frequency Trading (HFT)
Used by institutions; trades executed within microseconds.
4. Options Automated Strategies
Very popular in India due to high liquidity.
Straddles, strangles, spreads, iron condors
Delta-neutral strategies
Weekly expiry automated trading
5. Arbitrage Algorithms
Cash-futures arbitrage
Index arbitrage
Cross-exchange arbitrage
6. Machine Learning Algos
Models predict short-term price movement using data patterns.
5. Why Automated Trading Is Popular in India
(A) Discipline and Emotion Control
Most retail traders lose due to emotions such as fear, greed, and overtrading. Algorithms eliminate emotions and execute only according to logic.
(B) Speed and Accuracy
Indian markets, especially Bank Nifty options, move extremely fast. Manual execution cannot match the speed of an automated system.
(C) Multi-Market Monitoring
An algorithm can monitor:
Stocks
Index futures
Options Greeks
Intraday volatility
Simultaneously.
(D) Backtesting and Optimization
Before deploying, traders can test strategies on historical data and refine them.
(E) Scalability
A single trader can simultaneously run:
20 symbols
Multiple strategies
Multiple timeframes
6. Tools for Automated Trading in India
1. Broker APIs
Zerodha Kite Connect
Angel One SmartAPI
Dhan API
Alice Blue ANT API
5Paisa API
2. No-Code Algo Platforms
Tradetron
AlgoTest
Squares
Streak (rule-based)
Quantman
3. Coding-Based Systems
Python (most popular)
Java & Node.js for HFT-grade systems
Cloud servers (AWS, DigitalOcean, Google Cloud)
7. Regulatory Framework in India
The Securities and Exchange Board of India (SEBI) regulates automated trading. Key rules include:
(1) API approval and broker responsibility
Brokers must monitor suspicious algo activity.
(2) No fully automated systems without risk checks
Retail automation must include:
Order confirmation
Risk filters
Limits
(3) No misleading “guaranteed profit” claims
Platforms offering automated strategies must avoid unrealistic promises.
(4) HFT and co-location are regulated
Only institutions get access to exchange co-location.
Overall, SEBI ensures algos improve efficiency without harming market stability.
8. Advantages of Automated Trading
More disciplined and emotionally neutral
Faster execution, reducing slippage
Ability to run multiple strategies
Consistent performance
No fatigue, distractions, or human errors
Suitable for high-volume traders
Efficient risk management through automated stops
9. Challenges and Risks
(A) Technical Failures
Internet outage, server down, or broker API error can disrupt trading.
(B) Over-Optimization
Backtested strategies may fail in live markets if over-fitted.
(C) Rapid Market Movements
Events like RBI policy, global news, or election results can trigger massive swings.
(D) Broker API Limits
Some brokers throttle API calls, causing delays.
(E) Psychological Pressure
Even automated systems need confidence to stick with drawdowns.
10. Best Practices for Traders Using Automation
Start with small capital and scale gradually
Use cloud servers for stable execution
Always keep manual override ready
Use multiple risk layers
Backtest, forward test, and paper trade before going live
Monitor markets at least during volatile sessions
Avoid strategies dependent on unrealistic assumptions
Conclusion
Automated trading in the Indian market is a powerful evolution of modern finance. It empowers traders with speed, discipline, precision, and data-driven decision-making. With the growth of APIs, options trading, and fintech platforms, automation has become accessible to every retail trader—not just professionals. However, automation is not a magic solution; it requires strong logic, rigorous testing, and robust risk management. When used wisely, automated systems can transform trading performance and help traders participate in India’s dynamic and fast-growing market with confidence and consistency.

Part 1 Support and Resistance What Are Options?
Options are derivative contracts, which means their value is derived from an underlying asset such as stocks, indices, commodities, or currencies. In India, the most traded options revolve around:
Nifty 50
Bank Nifty
FinNifty
Stocks in the F&O list
An option contract gives a trader a right but not an obligation. This is what separates option buyers from option sellers.

Brian – Gold game plan for the US sessionBrian – Gold game plan for the US session
Gold’s rally yesterday shook a lot of traders out of position – the move was slow, steady and unforgiving, making it hard both to get in and to get out. For now, the short-term trend is clearer on H1, while H4 is still in transition.
Fundamental view – the Fed is confusing everyone
Fed expectations for December have been on a roller-coaster:
The market went from pricing a 25 bp cut in December at over 90%,
Then collapsed those odds to below 30%,
And has now swung sharply back again – all within about a month.
That kind of violent repricing in rate expectations usually creates two things for gold:
underlying support as soon as the market believes in easier policy again, and
choppy two-way volatility around each new data print or Fed comment.
So the macro backdrop still leans supportive for gold, but you do not want to ignore intraday whipsaws.
Technical view – H1 bullish, H4 testing the top of structure
On the H4 chart:Price is trading above the rising medium-term trendline from late October, keeping the broader structure constructive as long as 4,000 holds.
We are now pushing up towards the descending trendline and a H4 supply/FVG band between roughly 4,160 and 4,200.
Higher up sits a larger FVG / resistance block around 4,280–4,330 – if price ever accepts above the current downtrend line, that zone becomes a realistic upside magnet.
On H1:Structure is clearly bullish with higher highs and higher lows after yesterday’s impulsive move.
The current leg is extended, so I prefer to buy dips into support or a clean retest, rather than chase at the top of the candle.
Core bias: still prefer buys with the trend. Shorts are tactical, only at clear reaction zones.
Key levels
Resistance / sell zones
4,167–4,169: short-term reaction zone at the descending trendline and FVG
4,200–4,220: upper part of the same supply area
4,280–4,330: major H4 FVG / supply above
Support / buy zones
4,110–4,113: intraday support and potential retest area
4,080–4,070: minor support from recent consolidation
4,040–4,020: deeper pullback zone
4,000: key structural support; a break here would damage the bullish case
3,884: level that would confirm a medium-term bearish shift if price breaks and holds below
Trade scenarios (reference only, not financial advice)
Scenario 1 – Primary long: buy the dip into 4,110
Idea: stay with the bullish H1 structure, use the first decent pullback to get a better entry.
Entry: 4,110–4,113
Stop: 4,105
Targets: 4,125 → 4,140 → 4,180 → 4,200
I want to see price pull back into this zone after a push higher, ideally with a rejection wick or bullish candle confirming buyers are still in control.
Scenario 2 – Tactical short: fade the trendline at 4,167–4,169
Idea: counter-trend scalp from a clean confluence of resistance and FVG.
Entry: 4,167–4,169
Stop: 4,175
Targets: 4,155 → 4,140 → 4,120 → 4,105
This is not a swing short – it is a tactical trade against the intraday trend. Size should be smaller, and I would look to lock in profit or move to breakeven quickly if price reacts in our favour.
Scenario 3 – Breakout long if the trendline gives way
If gold pushes through the descending trendline and holds above the 4,170–4,180 zone:
I will shift back to a breakout-continuation mindset, looking to buy pullbacks above the broken trendline.
The next upside magnets then become 4,220 first and eventually the 4,280–4,330 FVG.
As long as 4,000 holds, I respect the upside and prefer to position with the trend, not against it. If we ever see a daily close below 4,000 and then 3,884, the whole story flips and I’ll start treating rallies as selling opportunities.
Trade the structure in front of you, not the headline noise. Manage risk around the shifting Fed expectations, and let the levels do the heavy lifting.
If this breakdown helps with your game plan, follow Brian for more gold updates during the US session and drop your own view in the comments so we can compare scenarios.

LICHSGFIN 1 Day Time Frame 📍 Key Current Levels
The stock is trading around ₹ 550 (recent quotes ~₹ 548-550) on the NSE.
Pivot & major levels (from one source) on the daily:
Classic pivot: ~₹ 550.32
Support levels: ≈ ₹ 547.39 (S1), ≈ ₹ 542.02 (S2)
Resistance levels: ≈ ₹ 555.69 (R1), ≈ ₹ 558.62 (R2)
Longer-term moving averages: 50-day MA ≈ ₹ 559.47; 200-day MA ≈ ₹ 570.32 — both above current price, indicating downward pressure.
RSI and oscillator reading: RSI around ~41 (neutral/leaning oversold) per one data point.
🔍 Interpretation & What to Watch
With price below major moving averages (50 & 200 day), the bias remains bearish on the daily chart.
The pivot around ₹ 550 is a key level: holding above may help stabilise; falling below could signal more weakness.
Important support to watch: ~₹ 547 and then ~₹ 542. If these break, risk of further downside.
Key resistance: ~₹ 555-558 zone. A break up through that with volume could offer short-term upside.
The RSI being relatively low (though not deeply oversold) suggests potential for a rebound if positive trigger arises, but trend is not yet positive.
Because the broader trend remains negative, any bounce should be treated cautiously unless backed by strong volume and a clear breakout above that resistance zone.

ENRIN 1 Day Time Frame 🔍 Key Price Info
Last traded ~ ₹3,090 (as of ~10:44 AM IST) on 25 Nov 2025.
Day’s high-low range: ~ ₹3,090 – ₹3,303 (intraday high reported ~₹3,303).
52-week range: ~ ₹2,508.80 – ₹3,625.00.
🎯 Support & Resistance Levels (Short Term)
Support Levels:
~ ₹3,050 – ₹3,070: close to current price, would be first level of support.
~ ₹3,000 – ₹3,030: if the stock breaks below the above, this zone becomes important.
~ ₹2,950 – ₹2,990: deeper support and closer to lower end of recent consolidation.
Resistance Levels:
~ ₹3,250 – ₹3,300: recent high zone around ₹3,303, so getting above this would be bullish.
~ ₹3,350 – ₹3,400: next significant zone before approaching the 52-week high.
~ ₹3,600+: near the 52-week high (₹3,625) and a major resistance barrier.
📉 Intraday Trading View
If the stock holds above ~₹3,050-₹3,070 with strong volume, it could attempt a push toward the resistance zone of ~₹3,250-₹3,300.
If it loses support at ~₹3,050, watch for potential slide toward ~₹3,000 or lower ~₹2,950 zone.
Volume, market sentiment & any corporate news will greatly influence whether it can break resistance or find support.

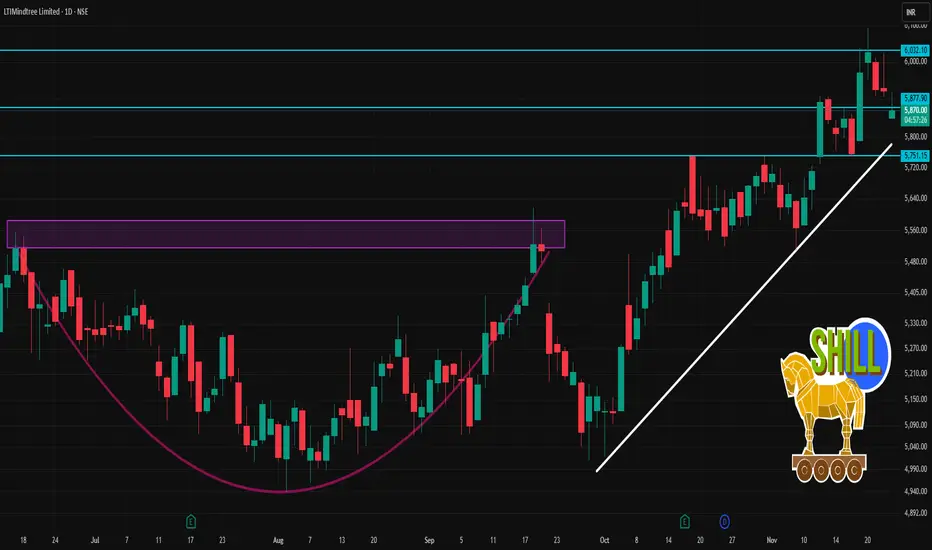
LTIM 1 Day Time Frame 🧮 Key Data Snapshot
Previous close: ~ ₹ 5,922.
Today’s intraday low: ~ ₹ 5,850.
Today’s intraday high: ~ ₹ 5,918.
52-week range: Low ~ ₹ 3,802, High ~ ₹ 6,767.95.
📌 1-Day Technical Levels to Watch
Support levels:
~ ₹ 5,850 — today’s intraday low; if price dips below this it may signal intraday weakness.
~ ₹ 5,760-5,770 — a slightly lower zone (recent intraday “floor” area) that could act as secondary support.
If those break, next meaningful structural support might be closer to ~ ₹ 5,500-5,600 (though further away, so bigger risk).
Resistance levels:
~ ₹ 5,918-5,920 — today’s intraday high; a breakout above this could open upside for the day.
~ ₹ 6,000 — psychological and round number resistance; if momentum pushes, this is the next target.
Above that, near the 52-week high (~₹ 6,767) but that’s more medium-term than for intraday.
🎯 Intraday Trading Scenarios
Bullish intra-day trade: If price holds above ~₹ 5,850 and breaks above ~₹ 5,920 with volume, one could target ~₹ 6,000 or slightly above for the day, with a stop-loss below ~₹ 5,850 (or even ~₹ 5,770 depending on risk tolerance).
Bearish intra-day trade: If price fails to hold ~₹ 5,850, and breaks down with momentum, one could look at a short, targeting ~₹ 5,700 or ~₹ 5,600. Stop-loss would be above ~₹ 5,910 zone.
Range-bound play: If the price continues to oscillate between ~₹ 5,850 and ~₹ 5,920, one might play the range – buy near the lower bound, sell near the upper bound, but keep stops tight.
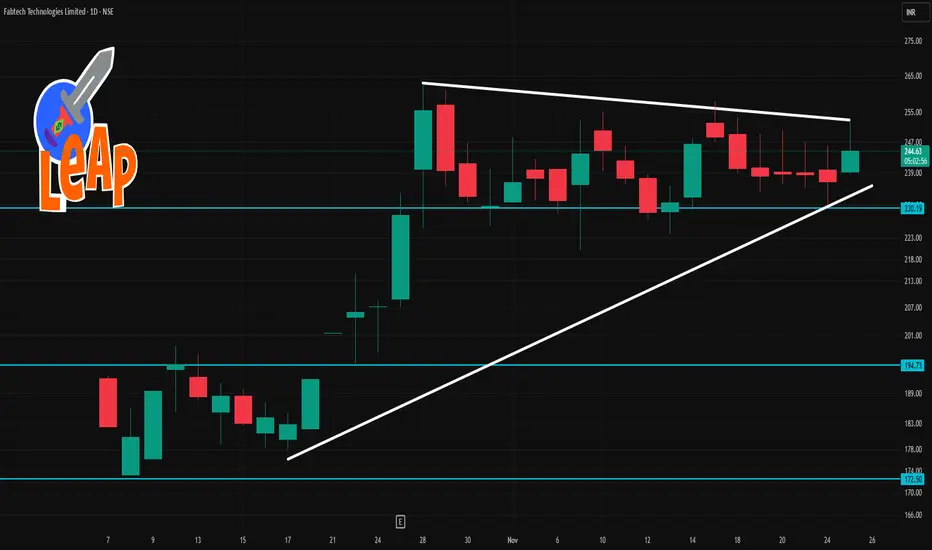
Fabtech 1 Day Time Frame 🔍 Technical Context
Moving averages (20-day, 50-day) are showing price above them, which suggests bullish bias.
Oscillators: RSI ~ 59-60 meaning moderate strength.
A recent source says the daily summary is “Neutral” on investing.com, indicating caution.
1-day pivot levels (classic) from Investing.com:
Pivot ~ ₹ 237.73
Resistance R1 ~ ₹ 240.46, R2 ~ ₹ 244.72, R3 ~ ₹ 247.45
Support S1 ~ ₹ 233.47, S2 ~ ₹ 230.74, S3 ~ ₹ 226.48
📊 Key Levels to Watch Today
Support Zone: ~ ₹ 233-235
If the stock approaches or dips into this area, watch for whether it holds or breaks.
Immediate Pivot / Mid-range: ~ ₹ 237-238
The pivot (~₹237.73) is a critical inflection point. A clear move above might bias upside; a break below may shift focus downward.
Resistance Zone: ~ ₹ 240-245
Upper resistance around ~₹240.46 to ~₹244.72. If momentum picks up and this zone is breached, next upside target ~₹247.45.
Lower Breakdown Level: ~ ₹ 230-227
If support in the ~233-235 zone fails, look toward ~₹230.74 and then ~₹226.48 as next real support.
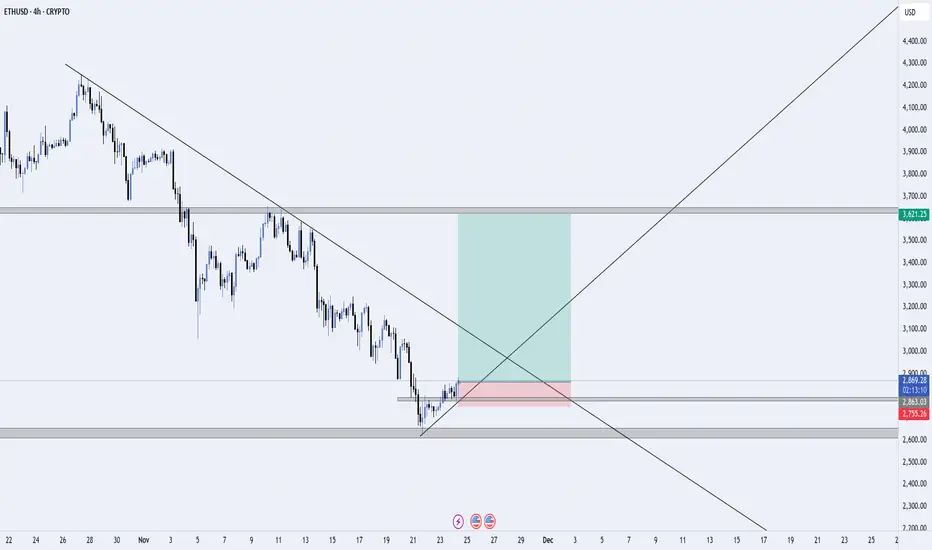
ETH/USD – Trendline Breakout Attempt from Higher-Timeframe DemanETH/USD is reacting strongly from a major 4H demand zone after an extended downtrend. Price has tapped into a high-volume area between $2,760–$2,800, showing the first signs of bullish strength with a clean internal structure shift.
📌 Setup Overview
Price respected a long-term descending trendline, but buyers stepped in strongly at the higher-timeframe demand zone.
A short-term structure break (BOS) suggests a potential reversal beginning to form.
Market is now retesting the broken structure + mini demand zone, where buyers are likely to defend.
🎯 Trade Plan
Entry: After the retest confirmation of the minor demand zone.
Stop-loss: Below the demand area to protect against liquidity sweeps.
Target: The next major supply zone around $3,600, aligning with the larger structure and trendline interaction.
📈 Bias
Bullish short-term — expecting continuation to the upside if price holds above the retest zone.
Structure suggests a potential mid-term trend reversal if buyers maintain control.
❌ Invalidation
Idea becomes invalid if price closes below the demand zone and breaks structure to the downside.
SHARP recovery coming up above 26000!?As we can NIFTY closed below 26000 which was against our expectations and was only valid if we were above 26000 levels. Now as long as we are below 26000, we are bearish until we sustain above 26000 for another strong upmove so plan your trades accordingly and keep watching everyone.

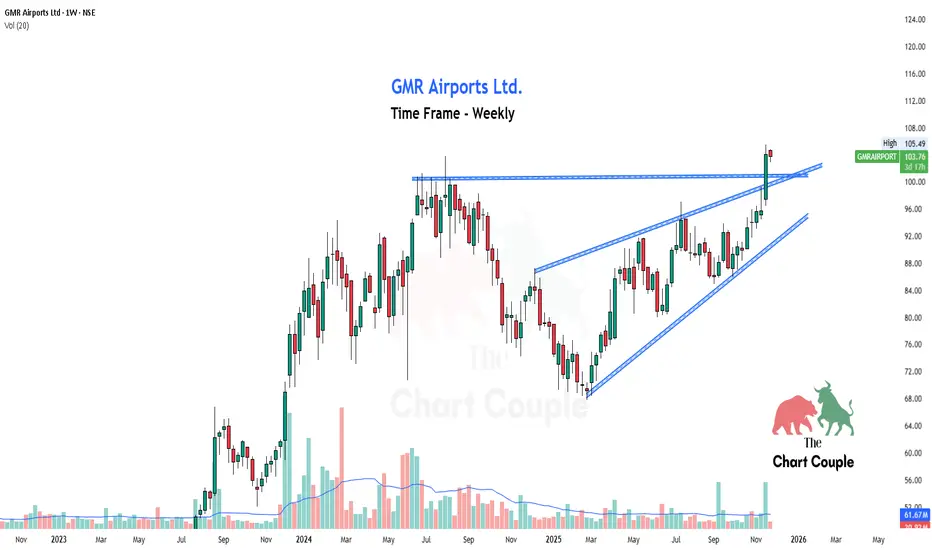
GMR Clean breakout above major resistance.“Price traded inside a rising wedge for weeks, squeezing toward resistance.
A strong bullish candle finally broke the structure, flipping old resistance into new support.
Volume confirms buyer strength—now watching for a retest and continuation.”
BUY TODAY SELL TOMORROW for 5%DON’T HAVE TIME TO MANAGE YOUR TRADES?
- Take BTST trades at 3:25 pm every day
- Try to exit by taking 4-7% profit of each trade
- SL can also be maintained as closing below the low of the breakout candle
Now, why do I prefer BTST over swing trades? The primary reason is that I have observed that 90% of the stocks give most of the movement in just 1-2 days and the rest of the time they either consolidate or fall
Trendline Breakout in ASAHIINDIA
BUY TODAY SELL TOMORROW for 5%

Nifty Intraday Analysis for 24th November 2025NSE:NIFTY
Index has resistance near 26250 – 26300 range and if index crosses and sustains above this level then may reach near 26450 – 26500 range.
Nifty has immediate support near 25900 – 25850 range and if this support is broken then index may tank near 25700 – 25650 range.

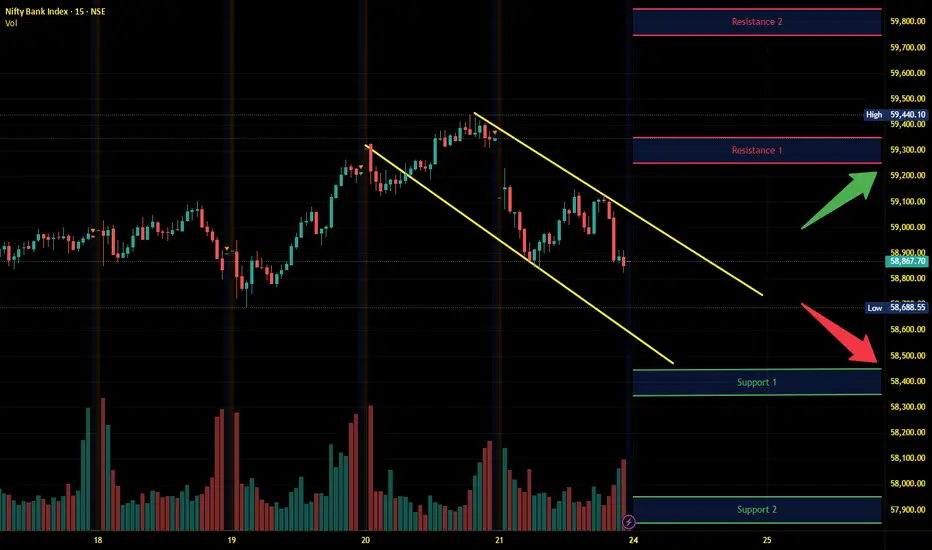
Banknifty Intraday Analysis for 24th November 2025NSE:BANKNIFTY
Index has resistance near 59250 – 59350 range and if index crosses and sustains above this level then may reach near 59750 – 59850 range.
Banknifty has immediate support near 58450 - 58350 range and if this support is broken then index may tank near 57950 - 57850 range.
Finnifty Intraday Analysis for 24th November 2025 NSE:CNXFINANCE
Index has resistance near 27775 - 27825 range and if index crosses and sustains above this level then may reach near 28050 - 28100 range.
Finnifty has immediate support near 27350 – 27300 range and if this support is broken then index may tank near 27075 – 27025 range.
