Premium Chart Pattern Understanding Chart Patterns
Every chart pattern represents crowd psychology—fear, greed, uncertainty, accumulation, or distribution. Institutional traders leave their footprint on charts, and patterns help retail traders align with their moves.
Patterns are formed across all time frames:
1-minute charts for scalping
5–15 minutes for intraday
1 hour for swing trading
Daily/weekly charts for positional trading
The bigger the time frame, the more reliable the pattern.
Trend Lines

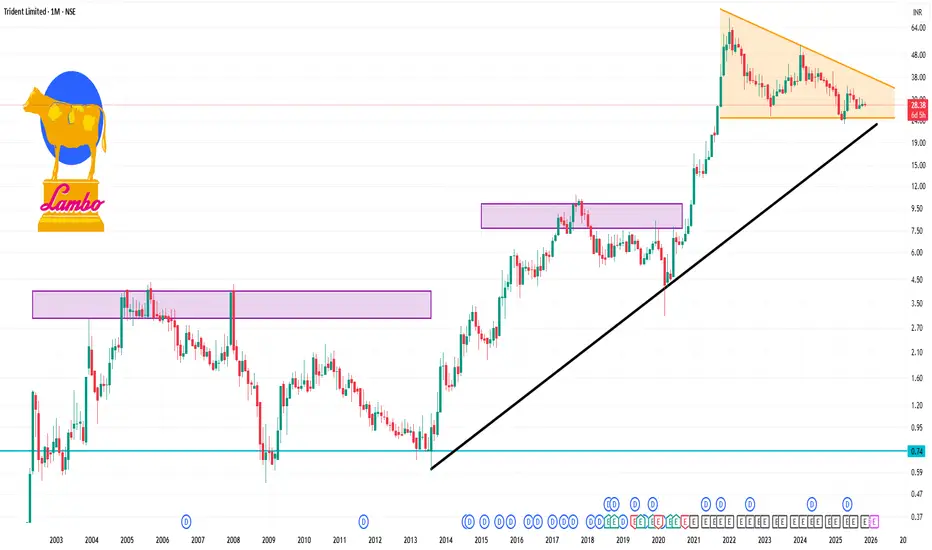
TRIDENT 1 Month Time Frame ✅ What we see
Fundamentals
Current price ~ ₹28.38.
Market cap ~ ₹14,462 cr, P/E ~32.8×, P/B ~3.15×.
ROE quite low (~8-10% range) and growth over past years has been muted.
52-week high ~ ₹40.20, 52-week low ~ ₹23.11.
Recent quarterly figures: sales up modestly; profits under pressure.
Technical / Price context
The share is nearer to its 52-week low than high, which may offer perceived value to some.
Some moving-average crossovers (per reports) flagged “sell signals” in short term.
Short-term return in past month has been very small (~0.64% 1-month return).
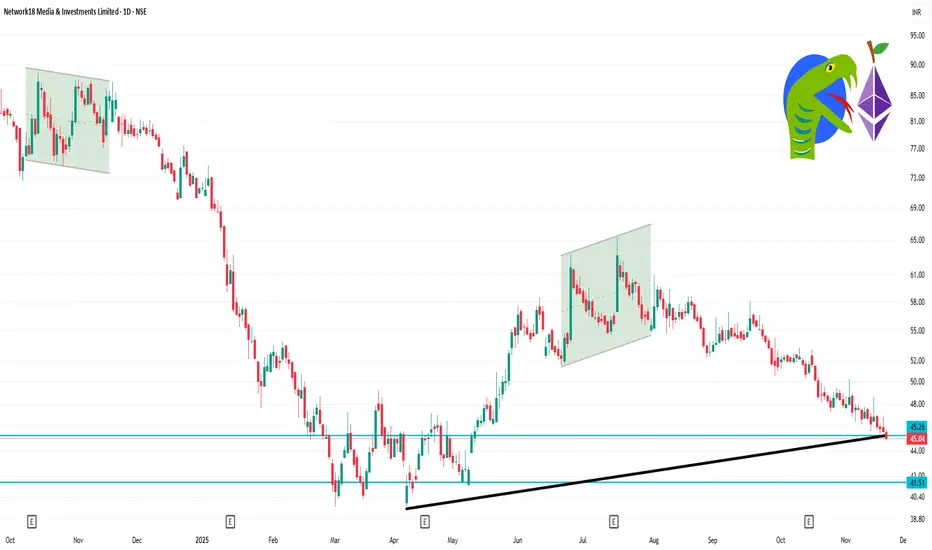
NETWORK18 1 Day Time Frame Current Price: ~ ₹ 45.04.
Day’s Range: ~ ₹ 44.89 (low) to ₹ 45.76 (high)
Key Support Level: Around ₹ 44.50-45.00 — if price breaks below this, further downside may open.
Key Resistance Level: Around ₹ 46.50-47.00 — if price breaks above this with volume, upside potential may resume.
52-week range: Low ~ ₹ 39.66, High ~ ₹ 85.39.
Smart Loss Management Guide in the Trading Market1. Why Loss Management Is More Important Than Profit-Making
Most new traders focus on making money and ignore risk control. But experienced traders know that your downside determines your survival. If capital is destroyed early, even a good trading system cannot help. Here’s why loss management matters:
Capital Preservation: If you lose 50% of your account, you need a 100% gain to recover. Avoiding deep drawdowns is essential.
Consistency Over Luck: A trader with average profits but disciplined risk control will outperform an aggressive trader without rules.
Uncertainty of Markets: Even the best strategies have losing streaks. Smart loss management keeps you disciplined during uncertain phases.
Simply put, losing small and winning medium-to-large is the essence of profitable trading.
2. Key Principles of Smart Loss Management
2.1 Risk Per Trade Rule
Professional traders follow a simple rule:
Risk only 1–2% of trading capital per trade.
This ensures that even after 10 losing trades in a row, your capital stays strong. A 1% rule means:
If your capital = ₹1,00,000
Max loss per trade = ₹1,000
This protects you from emotional decisions and ensures controlled drawdowns.
2.2 Position Sizing
Position size determines how much quantity you buy or sell. It must be based on:
Stop-loss distance
Capital
Risk per trade percentage
Formula:
Position Size = Risk Amount / Stop-Loss Distance
Example:
Capital = ₹1,00,000
Risk per trade = 1% = ₹1,000
Stop-loss = 5 points
Position size = 1000 / 5 = 200 quantity
This keeps your risk uniform across trades.
2.3 Placing Effective Stop-Loss Orders
Not all stop-losses are equal. Smart traders use:
Technical stop-loss: based on chart levels (support, resistance, swing high/low).
Volatility-based stop-loss: dynamic stops using ATR (Average True Range).
Time-based stop-loss: exit if trade doesn’t work within a fixed time window.
Avoid placing stops too close, which results in premature exits.
2.4 Avoiding Averaging Down
Many traders double their position when price goes against them thinking it will “bounce back”.
This is dangerous.
Averaging down increases exposure when your analysis is already wrong. Professional traders do the opposite—they scale out or exit.
2.5 Maintain Reward-to-Risk Ratio
Every trade must have a minimum Risk-to-Reward (RR) ratio of 1:2 or 1:3.
Example:
If risk = ₹1,000
Target should be ₹2,000 or ₹3,000
This ensures that even with a 40% win rate, you remain profitable.
3. Psychological Pillars of Smart Loss Management
Market losses are emotionally painful. Most poor decisions come from emotions like fear, hope, greed, and frustration. Smart traders master the psychology of loss.
3.1 Accept That Losses Are Normal
Every trader—beginner or expert—has losing trades. Accepting losses helps:
Reduce revenge trading
Maintain discipline
Focus on process, not outcome
3.2 Don’t Take Losses Personally
A losing trade is not a failure of your personality. It is simply part of the game. Traders who attach ego to trades often avoid closing losing positions, leading to bigger losses.
3.3 Control Overtrading
After a loss, many traders try to recover immediately. This emotional urge leads to irrational decisions. Smart loss management requires:
Stop trading after big loss
Follow pre-defined trade limits
Reset emotionally before next trade
3.4 Develop Emotional Discipline
The best loss management tool is self-control. This includes:
Sticking to stop-loss
Avoiding impulsive orders
Following a checklist before entering trades
Discipline converts a strategy into consistent profits.
4. Techniques for Smart Loss Management
4.1 Use Trailing Stop-Loss
Trailing stops help protect profits as the trade moves in your favor. For example:
If trade goes 20 points up, move stop-loss to breakeven
If trade goes 40 points up, trail stop to +20
This locks in gains and avoids giving back profits.
4.2 Hedging Positions
Advanced traders use hedging techniques like:
Options hedging (buying puts to protect long positions)
Futures hedging
Ratio spreads
Hedging reduces the impact of sudden volatility or news events.
4.3 Diversify Trades
Avoid putting all your capital into one trade or one sector. Diversification ensures:
Reduced exposure
Stable overall performance
Lower emotional pressure
But don't over-diversify; focus on 4–8 quality trades.
4.4 Use a Daily Loss Limit
Set a maximum daily loss that stops you from trading further.
Example:
Daily Max Loss = 3% of capital
If you hit that limit, stop trading for the day.
This prevents emotional breakdowns and unnecessary revenge trades.
4.5 Create a Trading Journal
Record:
Entry and exit
Stop-loss
Reason for trade
Emotional state
Reviewing your journal reveals patterns, mistakes, and ways to refine your strategy.
5. Common Mistakes to Avoid
5.1 Moving Stop-Loss Further Away
Traders sometimes shift stop-loss thinking the market will reverse. This is a mistake. A stop-loss must be respected at all times.
5.2 Trading Without a Defined Exit
A trade without a clear exit strategy becomes a gamble. Smart traders pre-plan both stop-loss and target.
5.3 Ignoring Market Conditions
A strategy that works in trending markets may fail in sideways markets. Loss management includes reducing position size during choppy or news-heavy environments.
5.4 Emotions-Based Position Sizing
Increasing lot size after a win or reducing after a loss emotionally disturbs risk management. Position size must always be formula-based.
6. Building Your Smart Loss Management System
Step 1: Define Your Risk Rules
Risk per trade, daily loss limit, maximum open trades.
Step 2: Create Position Sizing Formula
Based on stop-loss distance and capital.
Step 3: Pre-Plan Stop-Loss Levels
Technical, volatility-based, or time-based.
Step 4: Maintain a Journal
Track mistakes, patterns, and improvements.
Step 5: Maintain Emotional Discipline
Follow rules no matter what the market does.
7. Conclusion
Smart loss management is the foundation of profitable trading. Markets reward discipline, not emotion. By controlling risk, using effective stop-loss techniques, maintaining psychological discipline, and applying structured methods, traders protect their capital and grow consistently over time. Every successful trader understands that losses are unavoidable, but big losses are preventable. With a strong loss management system, you turn volatility from a threat into an opportunity and ensure you remain a long-term player in financial markets.
Index Rebalancing Impact1. Why Index Rebalancing Happens
Indices are meant to represent a particular segment of the market. Over time, however:
Some companies grow while others shrink.
Market capitalizations change.
New leaders emerge in sectors.
Corporate actions (mergers, delistings, bankruptcies) occur.
Market liquidity and trading patterns evolve.
To maintain accuracy and credibility, index providers periodically evaluate components based on criteria such as:
Free-float market capitalization
Liquidity (trading volumes and turnover)
Sector representation
Corporate governance and regulatory compliance
Financial performance
Rebalancing ensures that the index remains aligned with the current structure and performance of the market.
2. How Rebalancing Works
The rebalancing process typically includes:
a. Announcement Phase
Index providers (NSE Indices, MSCI, FTSE Russell, S&P Dow Jones) release the final list of changes ahead of implementation, typically 2–4 weeks in advance. This gives institutional investors time to prepare.
b. Execution Day
On the official rebalancing date—often coinciding with the end of a quarter—index funds and ETFs must:
Buy stocks that are being added.
Sell stocks that are being removed.
Adjust weightings for stocks that remain but whose weight has changed.
This creates heightened trading activity, especially in the closing session (closing auction window).
c. Post-Rebalance Adjustment
Stocks may continue to adjust over the next few sessions as traders reposition and arbitrage strategies unwind.
3. Impact of Index Rebalancing
A. Price Impact on Stocks Being Added
When a stock is added to a major index:
Index funds buy the stock, leading to strong demand.
Prices often surge in the short term (known as the index inclusion effect).
Liquidity improves due to higher institutional participation.
Valuations may rise as more ETFs and passive funds accumulate holdings.
This effect is especially pronounced in indices with large passive following such as Nifty 50, S&P 500, or MSCI Emerging Markets.
However, this rise may be temporary—after the initial bounce, prices may stabilize or even decline as speculative traders exit.
B. Price Impact on Stocks Being Removed
Stocks removed from the index face:
Forced selling by index funds.
Immediate drop in price due to excess supply.
Reduced liquidity as passive funds exit.
Potential long-term decline in visibility and analyst coverage.
This is called the index deletion effect and can significantly hurt sentiment.
C. Impact on Index Levels
Rebalancing can change:
Sector weights (e.g., financials vs. IT)
Market-cap distribution
Risk and volatility characteristics
If high-weight stocks are added or removed, the impact on the overall index value can be sizeable.
D. Impact on Trading Volumes and Liquidity
Rebalancing typically results in:
Surge in trading volumes, especially in the last hour.
Increased delivery-based buying from funds.
Temporary widening of spreads due to volatility.
Short-term liquidity mismatches, particularly in mid-cap or small-cap rebalancing.
Index rebalancing days are often among the highest volume days of the year.
E. Impact on ETFs and Passive Funds
Passive funds must replicate the index exactly. Rebalancing forces:
High turnover in ETF portfolios.
Transaction costs, which may be passed on to investors.
Tracking error risks if markets are too volatile on rebalancing day.
This mechanical trading adds to price distortions.
F. Impact on Derivatives Markets
Index rebalancing impacts:
Nifty Futures and options due to hedging adjustments.
Volatility around expiry, especially if rebalancing coincides with derivatives expiry.
Straddle and strangle traders who position based on anticipated price swings.
Quant traders and arbitrage desks particularly exploit these windows.
G. Impact on Market Sentiment
Inclusion in a major index is often seen as:
A sign of strong fundamentals.
Higher institutional confidence.
Better corporate governance.
Removal, on the other hand:
Signals deterioration.
May reduce analyst and investor focus.
4. Who Benefits from Index Rebalancing?
i. Short-Term Traders
They profit from:
Price surges in stocks being added.
Price drops in stocks being removed.
Volatility spikes on execution day.
High-frequency traders (HFTs) and algorithmic funds dominate this space.
ii. Arbitrageurs
They exploit price inefficiencies created by:
Temporary demand-supply imbalance.
Tracking errors in ETFs.
Lag between announcement and execution.
iii. Corporates
Being added to an index increases visibility and prestige, potentially lowering cost of capital.
5. Risks and Challenges of Index Rebalancing
a. Excess Volatility
Prices swing sharply on announcement day and execution day, often unrelated to fundamentals.
b. Temporary Distortions
Stocks may become:
Overvalued after inclusion.
Undervalued after exclusion.
These distortions eventually normalize but create risk for traders.
c. Market Manipulation or Speculation
Some traders attempt to anticipate rebalancing outcomes, leading to front-running—buying in advance of the official announcement.
d. Overdependence on Indexing
As passive investing grows, mechanical buying/selling can destabilize markets during rebalances.
6. Global vs. Local Impacts
MSCI Rebalancing: impacts global flows in emerging markets including India.
Nifty/Sensex Rebalancing: impacts domestic flows.
Sectoral Index Rebalancing: affects specific industries.
Global indices often cause bigger price swings due to foreign fund flows.
Conclusion
Index rebalancing is a critical process in ensuring that stock market indices remain accurate and relevant. While it may seem purely technical, its impact is widespread—from stock price movements and liquidity changes to investor sentiment and fund flows. For traders, rebalancing events offer opportunities to capitalize on predictable demand patterns, but they also come with significant volatility-related risks. For long-term investors, while the day-to-day swings may not matter much, understanding how rebalancing works can help explain sudden price movements and shifts in market dynamics.
Overall, index rebalancing reinforces the efficiency and representativeness of financial markets, but it also introduces short-term inefficiencies that active participants can exploit.

Nifty & Bank Nifty Options Trading1. Understanding Nifty & Bank Nifty as Option Underlyings
Nifty 50
A diversified index covering 13 sectors, representing India’s overall equity market.
Lower volatility compared to Bank Nifty
Stable and predictable movements
Preferred by positional traders and institutional hedgers
Bank Nifty
Composed of major banking stocks, highly sensitive to interest rates, RBI actions, liquidity flows, and global banking events.
Extremely high volatility
Fast intraday swings (frequently 300–700 points in a day)
Preferred by aggressive intraday option buyers and advanced traders
Liquidity in both instruments is extremely high, making them ideal for buying and selling options.
2. How Index Options Work
Option Types
You deal with two primary instruments:
Call Options (CE) – You profit when the index goes up
Put Options (PE) – You profit when the index goes down
Expiry Cycles
Both Nifty and Bank Nifty have:
Weekly expiry
Monthly expiry
Quarterly (some strikes)
Bank Nifty earlier had only weekly expiry on Thursday, but now expiries rotate due to SEBI’s rules. Nifty expires every Thursday as usual (unless it is a trading holiday).
Lot Sizes
Nifty lot size: typically 50 units
Bank Nifty lot size: typically 15 units
(These vary slightly during periodic revisions.)
3. Pricing Dynamics: Why Option Premiums Move
Option premiums are governed by:
i. Intrinsic Value
The real, quantifiable value.
CE intrinsic value = Spot price – Strike
PE intrinsic value = Strike – Spot
ii. Time Value (Theta)
Time value decreases as expiry comes closer.
Buyers get hurt by theta decay
Sellers benefit from theta decay
Bank Nifty has rapid intraday time decay, so sellers often dominate.
iii. Volatility (Vega)
Bank Nifty has higher volatility, meaning:
Higher premiums
Larger impact of news
Bigger risk and reward potential
iv. Delta
Measures how quickly the premium moves with respect to the index.
Example:
Delta 0.50 → Option moves 50% of index move
ATM options typically have delta ~0.5
Bank Nifty deltas shift faster due to rapid price movement.
4. Why Nifty & Bank Nifty Are Perfect for Options Trading
1. Deep liquidity
Instant order execution, tight spreads.
2. Weekly expiries
Fast premium decay → perfect for option sellers
Low cost → attractive for option buyers
3. High volatility (Bank Nifty)
Good for intraday scalping.
4. Large participation
FIIs, DIIs, proprietary desks, retail traders provide continuous order flow.
5. Common Trading Styles
A. Option Buying
Best for:
Trending markets
Breakout strategies
Intraday volatility plays
Pros:
Limited risk (premium paid)
High returns when market trends strongly
Cons:
Theta decay kills slow markets
Needs precise timing and direction
Bank Nifty is favored by buyers due to sudden moves.
B. Option Selling
Best for:
Range-bound markets
High probability income
Weekly expiry trading
Pros:
Higher win-rate
Time decay works in seller’s favor
Cons:
Potential for large losses if market trends
Must use hedging
Nifty is preferred by conservative sellers due to calmer moves.
Bank Nifty selling is profitable but demands skill and hedging discipline.
6. Key Strategies Used in Nifty & Bank Nifty
1. ATM/ITM Scalping (Intraday)
Used for 1–3 minute charts.
Buyers use fast entries on breakouts; sellers sell on reversals.
2. Straddles
Sell ATM CE + ATM PE.
Ideal when expecting low volatility.
Highly used on:
Expiry days
Fridays in monthly series
3. Strangles
Sell OTM CE + OTM PE.
Safer than straddles, with wider breathing space.
4. Credit Spreads
Bear call spread
Bull put spread
Controlled-risk selling strategies.
5. Iron Condor
For sideways markets with limited risk.
6. Directional Option Buying
Buyers typically look for:
Trendline breakouts
VWAP bounces
CPR (Central Pivot Range) breakout
Previous day high/low rejection
Bank Nifty gives the best directional follow-through.
7. Hedge-Based Positional Trades
Nifty traders often hold:
Bull Call Spreads
Bear Put Spreads
Calendar spreads
for monthly swings.
7. Expiry Day Dynamics
Expiry days (especially Thursday) are unique:
For Nifty & Bank Nifty
Accelerated theta decay
Frequent stop-hunt wicks
Sudden option premium collapse
Wild moves in the last 30 minutes
Scalpers thrive; beginners get trapped.
Option selling is usually profitable on expiry days, but only if:
You hedge
You manage risk
You avoid naked selling
Option buying works only during big directional moves or volatility spikes.
8. Risk Management (Non-Negotiable)
Without risk management, Nifty & Bank Nifty options will punish you. Follow these guidelines:
1. Use Stop-Loss Always
Options move insanely fast.
Bank Nifty can wipe out capital in minutes.
2. Never Sell Naked Options
Unhedged selling can cause large losses.
3. Control Position Size
Risk per trade should not exceed:
1–2% of capital (positional)
0.5–1% (intraday)
4. Avoid Overtrading
Chasing every move is a losing habit.
5. Understand News Events
Avoid trading near:
RBI policy
Budget
FOMC
Inflation data
Major geopolitical news
These events create sudden spikes.
9. Psychological Discipline
Options trading is 70% psychology.
Don’t chase runaway premiums
Don’t revenge trade
Don’t hold losing trades hoping they “come back”
Don’t keep adding to a losing position
If you can stay calm during fast index swings, you will trade better than most participants.
10. Final Practical Advice
I’ll be direct with you—Nifty & Bank Nifty options can help you grow your capital fast only if you learn structured trading. Otherwise, they can drain your account.
Here’s the right mindset:
Learn the basics thoroughly
Trade small and build skill
Specialize in one or two strategies
Stick to charts, not emotions
Think like a risk manager first, trader second
If you invest time in practice and discipline, index options can become your strongest trading edge.

Part 2 Ride The Big Moves Why Option Selling is Popular
Option selling is preferred because:
Time decay works in seller’s favour
Most options expire worthless
Sellers act like insurance companies
They earn small but consistent profits
But selling requires high capital and strict risk management.

Part 1 Ride The Big Moves Intraday Option Trading
Focus on momentum
Quick scalping
Uses volume, market structure
Greeks change rapidly
Risk high due to volatility
Positional Option Trading
Based on swing analysis
Uses spreads and hedged strategies
Requires understanding of Theta and Vega
Preferred for hedging and income generation

Part 2 Intraday Master Class1. Option Buying
Low capital
Limited risk
Unlimited profit
Requires strong movement
Suffers from time decay
2. Option Selling
High capital
Limited profit (premium)
High or unlimited risk
High probability trades
Theta decay works in favor

Nifty Intraday Analysis for 21st November 2025NSE:NIFTY
Index has resistance near 26400 – 26450 range and if index crosses and sustains above this level then may reach near 26650 – 26700 range.
Nifty has immediate support near 26000 – 25950 range and if this support is broken then index may tank near 25800 – 25750 range.

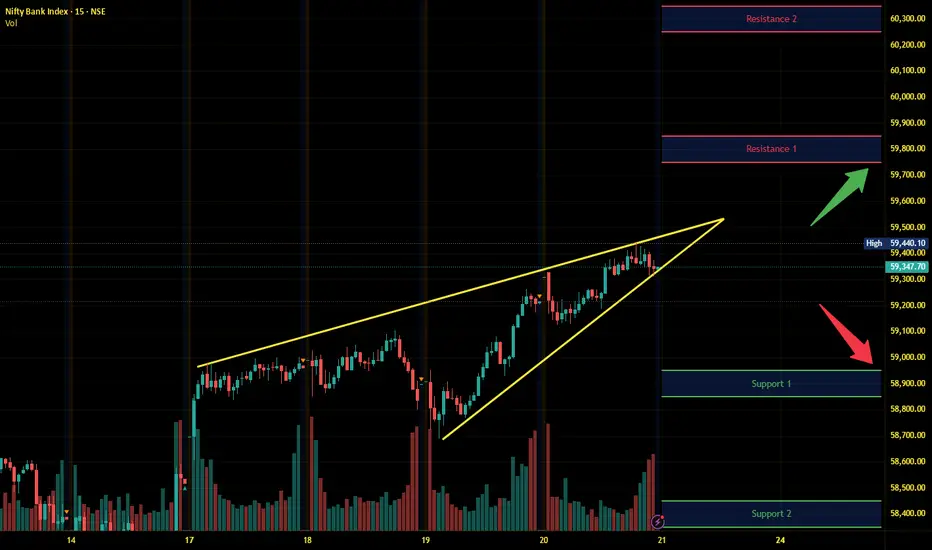
Banknifty Intraday Analysis for 21st November 2025NSE:BANKNIFTY
Index has resistance near 59750 – 59850 range and if index crosses and sustains above this level then may reach near 60250 – 60350 range.
Banknifty has immediate support near 58950 - 58850 range and if this support is broken then index may tank near 58450 - 58350 range.
Finnifty Intraday Analysis for 21st November 2025 NSE:CNXFINANCE
Index has resistance near 28125 - 28175 range and if index crosses and sustains above this level then may reach near 28350 - 28400 range.
Finnifty has immediate support near 27675 – 27625 range and if this support is broken then index may tank near 27450 – 27400 range.

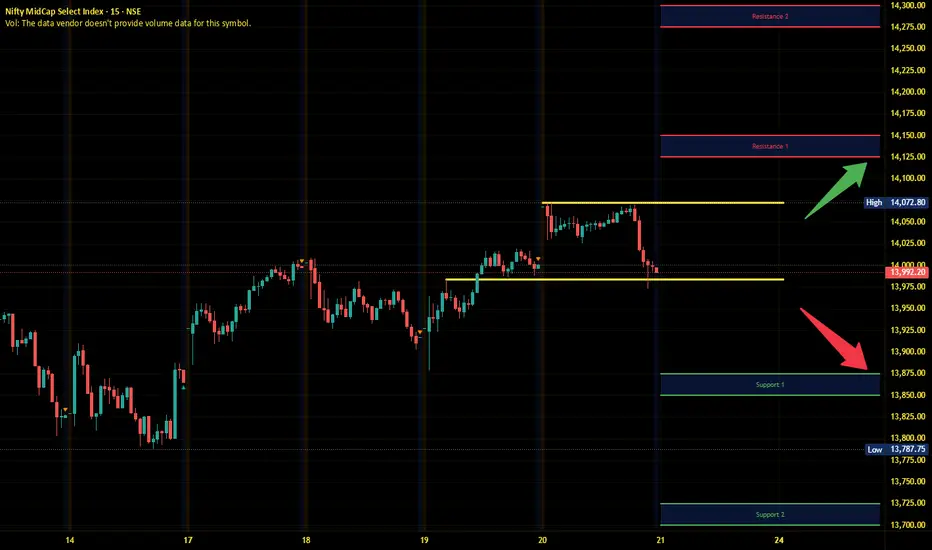
Midnifty Intraday Analysis for 21st November 2025NSE:NIFTY_MID_SELECT
Index has immediate resistance near 14125 – 14150 range and if index crosses and sustains above this level then may reach 14275 – 14300 range.
Midnifty has immediate support near 13875 – 13850 range and if this support is broken then index may tank near 13725 – 13700 range.
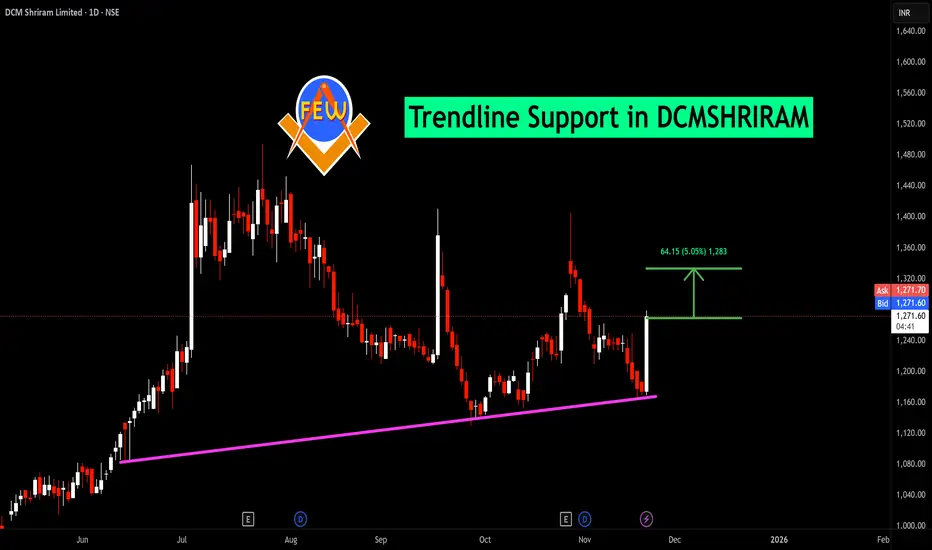
BUY TODAY SELL TOMORROW for 5%DON’T HAVE TIME TO MANAGE YOUR TRADES?
- Take BTST trades at 3:25 pm every day
- Try to exit by taking 4-7% profit of each trade
- SL can also be maintained as closing below the low of the breakout candle
Now, why do I prefer BTST over swing trades? The primary reason is that I have observed that 90% of the stocks give most of the movement in just 1-2 days and the rest of the time they either consolidate or fall
Trendline Support in DCMSHRIRAM
BUY TODAY SELL TOMORROW for 5%
Part 1 Intraday Master Class 1. Directional Trading
Trader expects market to move up or down.
Buying Calls (bullish)
Buying Puts (bearish)
Selling Calls (bearish)
Selling Puts (bullish)
2. Non-Directional Trading
Trader expects market to remain in a range.
Straddles
Strangles
Iron Condor
Butterfly

Bitcoin is in a clean daily downtrend right nowBitcoin is in a clean daily downtrend right now – every bounce is just providing fuel for the next leg until the structure says otherwise.
Good evening traders, Brian here with a higher-timeframe look at BTCUSD.
Fundamental analysis
Bitcoin has been under sustained pressure even as some funds continue to accumulate spot positions. A few key points:
Macro uncertainty and tighter dollar liquidity are weighing on high-beta assets. While gold has held up relatively well, the performance gap between BTC and XAU has been widening in recent weeks, highlighting a clear risk-off tone towards crypto.
On-chain and fund flows suggest that a number of crypto investors are actually de-risking and pulling capital out, which reduces market depth and makes downside moves more violent when liquidity is thin.
Narrative is still mixed: long-term holders and some institutions are happy to buy lower, but in the short term the order flow is dominated by forced selling, deleveraging and risk reduction.
Bottom line: the macro backdrop does not yet justify an aggressive “buy the dip” approach on BTC. Trend-following shorts remain safer than trying to call the bottom.
Technical analysis
Daily structure is clearly bearish:
We have a confirmed market structure shift on the left of the chart, with the prior higher-low support broken and a series of decisive lower lows since then.
The main bullish trendline from earlier in the year has given way, and price is now travelling within a steep descending leg.
BTC recently tagged the 1.618 Fibonacci extension of the last major swing, aligning with a prior liquidity pocket. That produced a sharp intraday bounce, but so far it looks like a reaction inside a downtrend, not a full reversal.
Around 75.4k we have an important daily support zone. If this level is broken and accepted below, it opens the door to a deeper flush towards the next large support band lower on the chart.
Overhead, there is a clean imbalance/FVG and prior distribution area around 108k, with an intermediate resistance block around 96–97k and a nearer supply zone around 88k. These are prime locations to look for fresh shorts if price retraces.
For now my bias is simple: look to sell rallies into premium levels; any longs are tactical, short-term trades off key support only.
Key levels
Resistance / short zones:
88,000 – first reaction zone, “pay attention to the reaction”
96,500–97,200 – main short entry area for medium-term positions
108,000 – higher FVG / major daily supply
Support / long-only intraday zones:
75,400 – key support + 1.618 Fib/liquidity zone
74,000–72,000 – deeper support if 75.4k fails
Trade scenarios (for reference, not financial advice)
1. Short the first meaningful pullback – 88k area
Entry: 88,000
Stop: 90,000 (above local structure)
Targets: 82,000 → 78,000 → 75,500
Idea: treat 88k as the first supply zone in a downtrend. If price bounces from current levels and stalls here, I’m looking for rejection (wick rejections, failed break, or a clear shift in intraday structure) to join the trend. Once price moves in favour, I would look to pull the stop to breakeven and let the position run.
2. Core swing short – 96.5k–97.2k zone
Entry: 96,500–97,200
Stop: 99,000
Targets: 88,000 → 82,000 → 75,500
This is my preferred “medium-term” sell area. It aligns with a more significant daily supply block and offers better risk–reward if the larger bearish leg continues. Any squeeze into this region after a series of lower lows is, in my view, a controlled opportunity to reload shorts.
3. Tactical long only at deep support
Entry: 75,400–74,800
Stop: 73,800
Targets: 82,000 → 88,000
Here I would only consider a short-term long if we see a clean liquidity sweep into the 1.618 extension and strong rejection (long lower wicks, aggressive buy-back). The idea is simply to trade the bounce back into resistance, not to fight the higher-timeframe downtrend.
If BTC loses 75.4k and starts closing below it on the daily, I would become much more cautious on any long exposure and focus almost entirely on short setups towards the lower “important support” zone on the chart.
Trade with the trend, respect your risk, and don’t get trapped trying to be a hero at the bottom of a falling market.
If this BTC breakdown adds value to your plan, make sure you follow Brian for more daily BTC and gold analysis, and share your own view in the comments so we can compare scenarios.

Option Trading Strategies Put Buyer
Pays premium
Expects price to fall
Risk limited to premium
Profit increases as price goes down
Put Seller
Receives premium
Expects price to stay flat or go up
Risk large if market crashes

PCR Trading Strategies Call Buyer
Pays premium
Expects price to go up
Risk limited to premium
Profit unlimited
Call Seller
Receives premium
Expects price to stay flat or go down
Profit limited to premium
Risk potentially unlimited

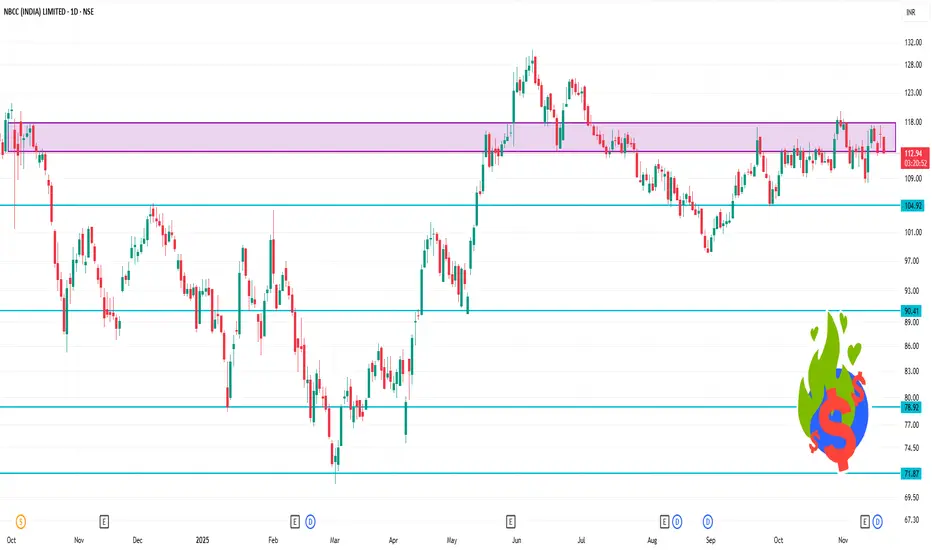
NBCC 1 Day Time Frame 📊 Key numbers
Current trading range (today): ~ ₹112.87 (low) to ₹115.50 (high) on the NSE.
Previous close: ~ ₹115.99.
52-week range: ~ ₹70.80 (low) to ~ ₹130.70 (high).
Valuation / fundamentals: P/E ~50.9x, P/B ~11.72x.
⚠️ Important disclaimers
These levels are based on publicly available intraday ranges and technical observations — not guaranteed.
Market conditions (volume, news, macro events) can shift levels rapidly.
I’m not providing personalized financial advice. You should cross-check live charts, use proper risk management, and adapt to your trading style.
For longer-term trends (beyond 1 day) you’d want to consult moving averages, trend lines, daily/weekly charts etc.
TVSMOTOR 1 Day Time Frame 📌 Key levels (approximate)
Pivot (classic) for recent day: around ₹ 3,408.73.
Resistance levels:
R1 ≈ ₹ 3,448.47
R2 ≈ ₹ 3,510.43
R3 ≈ ₹ 3,550.17
Support levels:
S1 ≈ ₹ 3,346.77
S2 ≈ ₹ 3,307.03
S3 ≈ ₹ 3,245.07
🎯 What to watch for possible trade decisions
Bullish scenario: If price breaks above the pivot (~₹3,409) and holds above R1 (~₹3,448), a move toward R2 (~₹3,510) or higher may be possible.
Bearish scenario: A break below S1 (~₹3,347) could open risk toward S2 (~₹3,307) or S3 (~₹3,245).
Neutral/Ranging: The stock may also trade between ~₹3,347 and ~₹3,448 while the trend remains unclear.

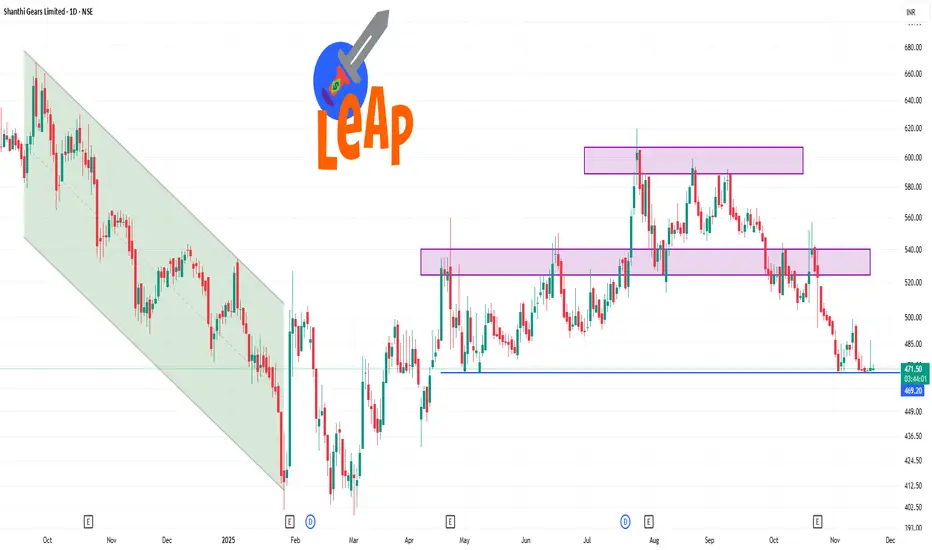
SHANTIGEAR 1 Day Time Frame 📍 Pivot / Support / Resistance Levels (1-day)
From the data available:
Pivot point (classic) ~ ₹ 471.35.
Resistance levels: R1 ~ ₹ 472.65, R2 ~ ₹ 474.30, R3 ~ ₹ 475.60 (classic)
Support levels: S1 ~ ₹ 469.70, S2 ~ ₹ 468.40, S3 ~ ₹ 466.75 (classic)
Bollinger lower band ~ ₹ 475.62, upper band ~ ₹ 547.04 (20-day)
🔍 My Interpretation
Given the indicators and levels:
The stock is under selling pressure in the short term; trend favors the downside.
Primary resistance is around ₹ 472-475 range. If the price moves up, it may struggle to clear that.
Primary supports around ₹ 466-469 zone. A break below this zone could open for further downside.
Because RSI is near oversold, there could be a short-term bounce, but unless the trend changes (moving averages turn up, price breaks above resistance), any bounce may remain limited.
Advanced Candlestick Pattern AnalysisTypes of Candlestick Patterns
Candlestick patterns are broadly categorized into:
Single-candle patterns
Double-candle patterns
Triple-candle patterns
Complex multi-candle structures

XAUUSD–FRIDAY BEFORE PMI: MAINTAINING HEAD AND SHOULDERS PATTERN💛 XAUUSD – FRIDAY BEFORE PMI: MAINTAINING HEAD AND SHOULDERS PATTERN, WAITING TO BREAK RANGE 4132–3998 🎯
🌤 1. Overview
Hello everyone, it's Lana here again 💬
Today is the last Friday of the week, the market is waiting for PMI and preparing to enter a phase with a lot of important data in December.
Meanwhile, BTC has been rising faster than XAU in recent weeks, indicating that speculative money is leaning towards crypto, while gold is temporarily moving sideways accumulating.
The US Department of Labor will release the November employment report on December 16, which is 6 days after the December Fed meeting. In other words, the Fed is in a "blackout" state regarding labor data for nearly another month – this forces the market to price in advance, making gold's volatility range wide but lacking a clear trend.
💹 2. Technical Analysis – Range & Head and Shoulders Pattern
On the H3/H4 frame, gold is fluctuating within the large range of 4132 – 3998.
The price wave is gradually narrowing towards the end of the triangle, represented by:
Lower highs,
Higher lows,
→ When one of the two boundaries is broken, a new trend is likely to explode in the direction of the breakout.
The inverse Head – Shoulders – Head pattern has not been broken:
Left shoulder – Head – Right shoulder are all above the rising trendline.
For the final wave of the pattern to follow the rhythm, the price needs to confirm surpassing 4109:
When closing a candle above 4109, the short-term uptrend is confirmed,
At that point, gold can aim for higher liquidity areas such as 4132 → 4145 → 4200.
Conversely, if gold breaks 3998, this will be both:
breaking the range bottom,
and negating the Head and Shoulders pattern,
→ opening the possibility of a deeper decline to the 3960–3920 area.
🎯 3. Reference Trading Scenarios
💖 BUY Scenario – following the pattern & range bottom support
1️⃣ Buy at support 3998–4000
Entry: 3998–4000
SL: below 3990 (depending on risk management)
TP: 4025 → 4040 → 4078
2️⃣ Buy when confirmed above 4109
Condition: Price closes a candle above 4109, confirming the Head and Shoulders pattern is maintained.
Entry: around 4100–4105
SL: 4090
TP: 4132 → 4145 → 4200
💢 SELL Scenario – trading the upper boundary of the range
Sell: 4130–4132
SL: 4138
TP: 4110 → 4095 → 4070 → 4045
Selling should only be considered as scalping against resistance within the range, not the main trend if the Head and Shoulders pattern is still valid.
⚠️ 4. Notes & Risk Management
Range 4132–3998 is still controlling the market:
Above 4109 → prioritize Buy according to the short-term uptrend.
Below 3998 → consider shifting bias to Sell following the breakout.
PMI, Fed expectations, and upcoming employment data may trigger unexpected volatility, therefore:
🌷Gold is at the intersection of technical patterns and macro stories 💛
Be patient and wait for reactions at 3998 and 4109, as these are the two key points that determine whether we enter a new upward wave or a deeper decline.
💛 Like – 💬 Comment – 🔔 Follow LanaM2 to follow gold with me every day ✨
