Trading Psychology – The Mental Edge of Successful Traders1. Why Trading Psychology Matters More Than Strategy
A trading strategy is important, but even the best strategy can fail if the trader cannot execute it with discipline.
For example:
A trader may exit too early due to fear.
A trader may hold losing positions due to hope.
A trader may overtrade due to greed or excitement.
A trader may avoid taking trades due to hesitation after losses.
These behaviors have nothing to do with strategy—they are psychological errors. Markets reward logic, not emotions. Thus, mastering psychology is just as important as mastering technical or fundamental analysis.
2. Key Emotional Challenges in Trading
a) Fear
Fear comes in different forms:
Fear of losing money
Fear of missing out (FOMO)
Fear of being wrong
Fear often pushes traders into irrational actions such as not pulling the trigger on a valid setup, placing too tight stop-losses, or chasing the market impulsively.
b) Greed
Greed leads to:
Overtrading
Holding winners too long
Trading oversized positions
Gambling instead of following rules
Greed makes traders believe they can earn more with one big trade, which usually leads to disaster.
c) Overconfidence
After a few winning trades, many traders feel invincible. This leads to:
Ignoring risk management
Taking bigger risks
Abandoning the trading plan
Overconfidence breaks discipline faster than losses.
d) Revenge Trading
Revenge trading happens when a trader tries to recover losses immediately. This emotional state leads to:
Quick, irrational trades
Ignoring setups
Emotional overreaction
Revenge trading is one of the biggest reasons for heavy losses.
e) Impatience
Trading requires waiting for the perfect setup. Many traders:
Enter too early
Exit too early
Switch strategies too often
Impatience destroys consistency.
3. Core Psychological Traits of Successful Traders
a) Discipline
The ability to follow the trading plan strictly.
Discipline prevents impulsive decisions, ensuring consistent behavior regardless of market conditions.
b) Patience
Great traders wait for the market to come to them. They do not chase trades; they choose trades.
c) Confidence
Confidence is not arrogance.
It is the belief in your strategy and ability, built through backtesting, journaling, and experience.
d) Emotional Control
Successful traders are calm during profit and loss.
They understand that:
“One trade does not decide the journey.”
Thus, emotions never control their decisions.
e) Adaptability
Markets constantly change. A strong trading psychology enables traders to adapt without panic or frustration.
4. Psychological Principles for Better Trading
a) Think in Probabilities
Trading is like poker or sports betting—nothing is guaranteed.
Winning traders think in terms of:
Win rate
Reward-to-risk
Long-term edge
They do not expect every trade to win.
b) Accept Losses as Part of the Game
Losses are not failures—they are expenses.
Just like a business has costs, trading has losing trades.
Accepting losses reduces fear and prevents emotional decisions.
c) Process Over Outcome
Focusing only on profit leads to stress and mistakes.
Successful traders focus on:
Following the plan
Managing risk
Executing flawlessly
The outcome naturally improves.
5. The Psychology Behind Market Movements
Markets are driven by collective emotions:
Fear
Greed
Panic
Hope
Euphoria
Understanding these crowd behaviors helps traders
ride trends
avoid traps
identify market reversals
A trader who understands human behavior has a huge edge.
6. How to Build Strong Trading Psychology
a) Create a Clear Trading Plan
A plan should include:
Entry rules
Exit rules
Stop-loss and target rules
Risk per trade
Timeframes and setups
A strong plan removes emotional thinking.
b) Use Strict Risk Management
Risk management reduces emotional pressure.
If you risk only 1% per trade:
fear decreases
losses become manageable
confidence increases
Small, controlled losses reduce emotional damage.
c) Keep a Trading Journal
Journaling helps identify:
emotional mistakes
good trades
bad habits
areas to improve
It is the most powerful tool for psychological growth.
d) Practice Mindfulness and Emotional Awareness
Mindfulness helps you remain aware of:
fear
greed
stress
impulsive urges
It encourages rational thinking under pressure.
e) Backtest and Build Confidence
Backtesting proves your strategy works.
When you trust the system, you stop doubting and stop making emotional decisions.
7. Common Psychological Mistakes Traders Make
Expecting quick results
Trading success takes years of practice.
Relying on instinct instead of rules
The market punishes emotional guesses.
Changing strategies often
Inconsistency destroys psychological stability.
Taking trades to “prove” something
Trading is not about ego; it’s about probabilities.
Ignoring mental health
Stress, burnout, and fatigue lead to poor decisions.
8. Developing a “Professional Trader Mindset”
Professional traders think differently from beginners.
Pros focus on risk; beginners focus on profit.
Professionals ask:
“How much can I lose?”
Beginners ask:
“How much can I make?”
Pros follow systems; beginners follow emotions.
Pros accept uncertainty; beginners look for certainty.
Pros treat trading as a business; beginners treat it as gambling.
Shifting to a professional mindset requires consistent practice and emotional maturity.
9. The Role of Habits and Lifestyle in Trading Psychology
Your lifestyle impacts your mental state.
Healthy traders:
sleep well
exercise
maintain routines
avoid trading during emotional stress
take breaks after big wins or losses
A disciplined life encourages disciplined trading.
10. Final Thoughts: Master Your Mind, Master the Market
Trading psychology is the foundation of long-term trading success.
You can have:
the perfect indicator
advanced strategies
great market knowledge
But without emotional control, you will struggle.
The true trader’s journey is about mastering:
mindset
discipline
patience
acceptance
self-awareness
Once you understand your emotions and behavior, the market becomes much easier to navigate.
Trendlineanalysis

Options Trading & Greeks1. What Are Options?
Options are derivative contracts that give traders the right, but not the obligation, to buy or sell an asset (like stocks, indices, commodities, or currencies) at a preset price (strike price) within a specific period.
There are two major types:
1. Call Option
Gives the buyer the right to buy the underlying asset at the strike price.
Call Buyer → Bullish
Call Seller → Bearish
2. Put Option
Gives the buyer the right to sell the underlying asset at the strike price.
Put Buyer → Bearish
Put Seller → Bullish
Options can be bought or sold, creating four basic positions:
Long Call
Short Call
Long Put
Short Put
From these, traders build advanced strategies such as spreads, straddles, strangles, condors, butterflies, etc.
2. Why Trade Options?
Options offer benefits that stocks cannot:
1. Leverage
Small capital can control a large position.
2. Hedging
Protect your portfolio against downside risk (e.g., buying Puts).
3. Income Generation
Sell options regularly (like Covered Calls, Cash Secure Puts).
4. Flexibility & Strategy
Strategies exist for every type of market — trending, sideways, volatile, or low-volatility.
3. How Option Prices Are Determined
An option’s premium is influenced by:
Underlying Asset Price
Strike Price
Time to Expiry
Volatility
Interest Rates
Dividends
All these factors interact continuously and cause option premiums to fluctuate. Traders use Option Greeks to measure these changes and manage risk.
4. Introduction to Option Greeks
Greeks measure the sensitivity of an option’s price to various market factors. Think of them as tools that let you understand:
How much premium will change if price changes
How fast time decay will erode value
How volatility impacts premium
How the option behaves near expiry
The 5 major Greeks are:
Delta
Theta
Vega
Gamma
Rho
Let’s explore each in detail.
5. Delta – The Price Sensitivity Greek
Delta measures how much an option’s premium will change if the underlying price moves by ₹1.
Example:
If a Call option has Delta = 0.60
→ A ₹1 rise in the stock increases the premium by ₹0.60
Interpretation:
Call Delta: 0 to 1
Put Delta: -1 to 0
ATM options → around 0.50
ITM options → higher Delta (~0.70 to 0.90)
OTM options → lower Delta (~0.10 to 0.30)
Uses of Delta:
Predicting premium movements
Position sizing in options (Delta exposure)
Hedging (Delta neutral strategies)
As expiry approaches, Delta of ATM options moves sharply toward 1 or 0.
6. Gamma – The Acceleration Greek
Gamma measures how much Delta will change if the underlying asset moves by ₹1.
If Delta is the speed of movement, Gamma is the acceleration.
Importance:
Tells how unstable or stable your Delta is
ATM options have highest Gamma
Near expiry, Gamma becomes extremely high → risky
Why Traders Watch Gamma:
High Gamma = fast change in Delta → rapid premium movement
Option sellers fear high Gamma because small price moves can cause big losses
Gamma helps traders avoid selling risky options near expiry.
7. Theta – The Time Decay Greek
Theta measures how much an option loses in value every day due to time decay.
Options are wasting assets — they lose value as expiry approaches.
Example:
Theta = -6
→ The option loses ₹6 in premium each day (all else constant)
Key Points:
Theta is negative for option buyers
Theta is positive for option sellers
ATM options lose value fastest
Time decay accelerates in the last 10–15 days of expiry
Why Theta Matters:
Option sellers (writers) love Theta because they profit from time decay.
Option buyers must overcome Theta loss through strong directional moves.
8. Vega – The Volatility Greek
Vega measures how sensitive an option’s price is to changes in volatility.
Volatility is the heartbeat of options pricing. When volatility rises, options become more expensive.
Example:
Vega = 10
→ If IV increases by 1%, premium increases by ₹10
Volatility Impact:
High IV → expensive options
Low IV → cheap options
Vega Behaviors:
Highest for ATM options
Falls sharply near expiry
Impacts long-term options (LEAPS) more than short-term
Why Vega Matters:
Traders use Vega to:
Trade earnings announcements
Trade events (Union Budget, Fed decisions)
Avoid buying overpriced options
Take advantage of IV crush
9. Rho – The Interest Rate Greek
Rho measures sensitivity to changes in interest rates.
Example:
Rho = 5
→ a 1% rise in interest rates increases the premium by ₹5
Rho impacts:
Long-term options
Index options (slightly)
Hardly affects short-term equity options
It is the least important Greek for day-to-day trading but relevant for long-duration positions.
10. How Greeks Work Together
Greeks never work alone. They influence each other and create the real behavior of an option.
Example:
A high Delta ITM option also has low Gamma
An ATM option has high Gamma, high Vega, and high Theta
An OTM option has low Delta, low Gamma, and low Theta
Understanding these relationships helps you choose the right strike and expiry.
11. Practical Applications of Greeks
1. Directional Trading (Delta-based)
Choose high Delta options for directional moves.
Avoid low Delta (far OTM) options → high probability of decay.
2. Income Strategies (Theta-based)
Short Strangles, Iron Condors, Credit Spreads
→ Earn from time decay + low movement
3. Volatility Trading (Vega-based)
Trade before major events (high IV) and exit after IV crush.
4. Risk Management (Gamma-control)
Avoid selling naked ATM options near expiry due to high Gamma risk.
12. Greeks by Different Market Phases
Trending Market
Delta is most important
Use low Gamma (ITM options) for stability
Sideways Market
Theta becomes dominant
Use option selling strategies
High-Volatility Market
Vega spikes → options overpriced
Prefer selling IV (credit spreads, straddles)
Expiry Day
Gamma risk highest
Only experienced traders should trade
Theta is maximum (rapid decay)
13. Why Greeks Matter More in Indian Markets
India’s option market (specially Nifty and BankNifty) is:
Volatile
High participation
Weekly expiries
Strong intraday moves
This makes Greeks extremely important. A 20–50 point move in Nifty can drastically change Delta, Gamma, and Theta. Traders who understand Greeks avoid emotional trading and make data-driven decisions.
14. Conclusion
Options trading is not just about prediction — it is about understanding the forces that shape option prices. Greeks are your tools to measure:
Directional risk (Delta)
Acceleration risk (Gamma)
Time decay (Theta)
Volatility risk (Vega)
Interest rate sensitivity (Rho)
Mastering Greeks helps you:
Select the right strike
Choose the right expiry
Control losses
Optimize returns
Build safe strategies
Trade confidently
Whether you are a beginner looking to understand basics or an intermediate trader trying to refine strategies, knowing Greeks will transform your options trading journey.

Price Action Trading1. What is Price Action Trading?
Price action trading is the analysis of raw price movement on a chart. It involves studying candlestick patterns, support and resistance zones, trendlines, breakouts, volume behavior, and the psychology behind market participants’ actions. Instead of using lagging indicators, price action traders focus on:
Higher highs and higher lows
Support and resistance
Market structure
Trend strength
Candle patterns
Order flow concepts
Because price is immediate and reflects the most recent market decisions, price action helps traders stay aligned with real-time sentiment and avoids the delays of indicators.
2. Why Price Action Works
Price action works because it is rooted in the core principle of markets:
All buying and selling decisions are reflected in price.
Every candlestick tells a story:
A long wick shows rejection.
A big body shows strength.
A small range candle shows indecision.
A breakout candle signals aggression.
Unlike indicator-based trading, price action teaches traders to understand why something is happening, not just what is happening. This deeper understanding is why professional traders and institutional players rely heavily on price action.
3. Core Components of Price Action Trading
(A) Market Structure
Market structure is the backbone of price action. It tells you whether the market is trending, consolidating, or reversing.
Uptrend:
Higher Highs (HH)
Higher Lows (HL)
Downtrend:
Lower Highs (LH)
Lower Lows (LL)
Range:
Horizontal support and resistance
Equal highs and equal lows
Once you know the structure, you know the bias.
(B) Support and Resistance (S/R)
Support and Resistance are areas where price reacts repeatedly because buyers or sellers defend those levels. They are widely used in price action trading.
Support: A level where buying pressure exceeds selling pressure.
Resistance: A level where selling pressure exceeds buying pressure.
The strongest S/R zones have:
Multiple touches
Volume confirmation
Trend alignment
Psychological round numbers (like 100, 500, 1000)
(C) Candlestick Patterns
Candlesticks reflect market psychology and reveal what buyers and sellers are doing.
Key price action patterns include:
Pin Bar (Hammer / Shooting Star) – Strong rejection
Engulfing Pattern – Trend reversals or continuation
Inside Bar – Low volatility → breakout setup
Doji – Indecision
Marubozu – Strong directional momentum
Candlesticks are tools for confirming entries and exits.
(D) Breakouts and Fakeouts
Price often breaks above or below important levels. But not all breakouts sustain. Many fail — known as fakeouts.
A good price action trader learns to differentiate between:
True breakout: High volume, strong candle body, retest
False breakout: Wick break, low volume, immediate reversal
Fakeout trading is one of the most profitable techniques when mastered.
(E) Trendlines and Channels
Trendlines help visualize structure and momentum. Two or more touches create a valid trendline.
Channels (rising or falling) help traders locate:
Buying opportunities at lower boundary
Selling opportunities at upper boundary
Breakouts at structure collapse
Trendlines enhance clarity in volatile markets.
4. Price Action Entry Techniques
There are several reliable entry models:
(A) Breakout Entry
Traders enter when price breaks a major level:
Resistance breakout → Buy
Support breakout → Sell
Strong breakout confirmation includes:
Big-bodied candle
Volume increase
Retest of level
(B) Pullback Entry
This is the most common entry for professional traders.
Steps:
Identify trend
Wait for correction
Look for price action signal
Enter with trend continuation
Pullback entries offer high reward-to-risk ratios.
(C) Reversal Entry
Used at key S/R zones.
Signals include:
Pin Bar at resistance
Engulfing candle at support
Divergence between price and momentum
Reversal entries require patience and confirmation.
5. Price Action Exit Strategies
(A) Fixed Target Exit
Based on S/R levels, Fibonacci targets, or ATR projections.
(B) Trailing Stop Exit
Use structure-based trailing:
Swing high/lows
Trendline breaks
Moving average (optional)
(C) Partial Profit Booking
Sell half at first target, trail rest.
This reduces risk and increases consistency.
6. Risk Management in Price Action Trading
Risk management is inseparable from price action.
Key principles:
Risk 1–2% per trade
Use stop loss below/above structure
Never chase trades
Avoid overtrading
Trade high-probability zones
Maintain minimum 1:2 or 1:3 RR
Price action is powerful, but without risk control, even the best trades can fail.
7. Psychological Aspect of Price Action
Price action exposes traders to raw market volatility, so emotional discipline is essential.
Key psychological principles:
Stick to your plan
Don’t interpret noise as signals
Trust structure and patterns
Accept losing trades
Stay unbiased—trade what the chart shows
Avoid revenge trades
Markets reward disciplined behavior more than aggressive behavior.
8. Major Price Action Strategies
(A) Trend Following Strategy
Identify trend
Buy pullbacks in uptrend
Sell pullbacks in downtrend
Confirm with candle patterns
This is the most reliable and beginner-friendly approach.
(B) Reversal Trading Strategy
Look for reversal patterns at major S/R levels:
Pin bar reversal
Double top/bottom
Head and shoulders
Engulfing reversal
Reversal trading offers high RR but requires experience.
(C) Breakout and Retest Strategy
One of the cleanest setups:
Price breaks a strong level
Comes back to retest
Forms a bullish/bearish signal
Enter towards breakout direction
Institutional traders commonly use this.
(D) Range Trading Strategy
In a sideways market:
Buy support
Sell resistance
Wait for breakout to stop range trading
Ranges are predictable and profitable for price action traders.
9. Advantages of Price Action Trading
Works on all markets and timeframes
No dependency on indicators
Quick decision-making
Clears chart from clutter
Aligns with institutional trading
Easy to learn but deep to master
Works even in low-volume markets
10. Limitations of Price Action Trading
Requires screen time and practice
Highly subjective
Can generate false signals in choppy markets
Emotional discipline needed
News events can disrupt structure
Price action is powerful, but traders must combine it with risk management and emotional control.
Conclusion
Price Action Trading is a complete trading ecosystem—focused on understanding how price behaves, how market participants react, and how to trade based on pure market psychology. It eliminates reliance on lagging indicators and teaches traders to interpret structure, trends, reversals, breakouts, and raw candlestick signals. With practice, traders using price action gain clarity, develop confidence, and improve consistency across all market conditions.

Fundamental Analysis (FA) for Traders1. What Fundamental Analysis Really Means for Traders
Most traders think FA is only for investors. But FA helps traders by:
Filtering out weak or manipulated stocks
Increasing the probability of sustainable moves
Helping you ride bigger trends with confidence
Protecting you from collapses caused by poor financials
Aligning you with stocks that institutions, FII/DIIs prefer
When you combine FA + TA, your trading accuracy improves dramatically because FA tells you which stock, and TA tells you when to buy or sell.
2. Key Pillars of Fundamental Analysis
FA can be divided into three pillars:
A. Economic Analysis
This covers the bigger picture—GDP, inflation, interest rates, energy prices, government policies, and global macro events.
Rising interest rates → pressure on banks & NBFCs
Falling crude oil → benefits airlines, paints, chemicals
Strong GDP → boosts cyclicals like autos, cement, infra
Weak monsoon → negative for agro and FMCG
Understanding these factors helps a trader position themselves in the right sectors during market cycles.
B. Industry Analysis
Each industry has unique growth drivers and risks.
Examples—
IT depends on global demand and currency movement.
Banking depends on NPA trends, credit growth, interest rates.
Pharma depends on USFDA approvals and regulations.
Cement depends on infra spending and real estate demand.
A trader must know industry cycles because money flows from sector to sector in rotation. Identifying these rotations early is a huge edge.
C. Company Analysis
This is the deep analysis of the business itself.
Key components include:
Financial statements
Ratios
Profit trends
Debt strength
Cash flow
Competitive advantage
A trader should not study everything like an analyst—only the most actionable data.
3. Essential Financial Statements for Traders
1. Profit & Loss Statement (P&L)
Shows revenue, expenses, and net profit.
Important signals for traders:
Consistent revenue growth
Rising margins
Strong YoY profit growth
Stocks with surging profits often show strong price breakouts.
2. Balance Sheet
Shows assets, liabilities, and capital.
Check:
Debt-to-Equity ratio
Company’s liquidity
Strength of reserves
Low-debt companies move more steadily in uptrends.
3. Cash Flow Statement
More powerful than profit numbers because cash cannot be manipulated easily.
Focus on:
Operating cash flow (OCF)
Free cash flow (FCF)
Positive FCF stocks are safer for swing and positional trading.
4. Most Important Fundamental Ratios for Traders
You don’t need 50 ratios—only the ones that directly impact price momentum.
1. EPS (Earnings Per Share)
Higher EPS = better profitability.
Stocks with rising EPS attract buyers.
2. PE Ratio
Compares price to earnings.
Low PE → undervalued
High PE → overvalued or high-growth
For traders:
Compare PE to industry average, not absolute number.
3. PEG Ratio
PEG = PE / Earnings growth
Best for identifying fast-growing stocks at reasonable valuation.
4. ROE (Return on Equity)
Measures how efficiently a company uses shareholders’ money.
Strong companies have ROE > 15%.
5. ROCE (Return on Capital Employed)
Shows returns on both equity + debt.
High ROCE indicates efficient operations.
6. Debt-to-Equity Ratio
Keep D/E < 1 for stable trading opportunities (exceptions: banks, NBFCs).
7. Operating Margin & Net Margin
Higher margins = pricing power = sustainable trends.
5. Qualitative Factors Traders Must Consider
Not everything is numbers. The biggest market moves often come from qualitative shifts.
1. Management Quality
A trustworthy management creates wealth.
A poor management destroys it even with great products.
Signals of strong management:
Transparent communication
Good capital allocation
Consistent results
2. Competitive Advantage (Moat)
A moat gives the company protection against competitors.
Moats include:
Brand power
Patents
Distribution network
Customer loyalty
Cost leadership
A company with a strong moat trends better on charts.
3. Growth Drivers
Ask:
What will increase revenue in the next 3 years?
New product?
Export expansion?
Government policy support?
Growth drives trends—traders must trade growing businesses.
6. Events That Affect Traders in FA
Traders must focus heavily on event-driven fundamental analysis:
1. Quarterly Results
Results beat → stock gaps up and trends
Results miss → stock sells off sharply
Focus on:
Revenue growth
Operating margin
EPS
Guidance commentary
2. Corporate Actions
Bonus
Split
Dividend
Buyback
Mergers
These events often create strong short-term trading opportunities.
3. Promoter Buying/Selling
Promoter buying = bullish
Promoter selling = caution
4. FII & DII Activity
Institutional money drives long-term trends.
5. Government Policies
Examples:
PLI scheme → boosts manufacturing
Infra push → cement, steel bullish
EV policies → autos & batteries rise
7. How Traders Should Use FA Along With TA
FA + TA together create high-probability trades.
Here’s the ideal system:
Step 1: Use FA to Select the Stock
Filter strong companies using:
Profit growth
Low debt
High ROE/ROCE
Strong sector
Step 2: Use FA to Validate a Big Move
Check if a breakout is supported by:
Recent results
News flow
Strong guidance
Step 3: Use TA to Time Entries
Use:
Support/resistance
Trendlines
Breakouts
Moving averages
RSI/MACD
Step 4: Hold with FA Confidence
When you know the company is strong, you avoid panicking on small dips.
Step 5: Exit With TA
Use trailing stop-losses, breakdowns, or reversal patterns.
8. Example: How Traders Apply FA in Real Market
Suppose you spot a stock showing a breakout on the chart.
Before entering, check:
Last 3 years profit growth?
Is debt low?
Is the industry in an upcycle?
Any recent positive news?
Are FIIs buying?
If fundamentals support the breakout, your trade becomes safer and more powerful.
9. Why FA Matters for Short-Term and Long-Term Traders
Short-Term Traders
FA prevents you from trading weak, manipulated, or poor-quality companies.
Swing Traders
FA helps you ride large moves that last weeks or months.
Positional Traders
FA gives confidence to hold during volatility.
Options Traders
FA guides which stocks have stability, volume, and trend consistency.
10. Final Summary
Fundamental Analysis for traders is not about becoming a CA or analyst.
It is about understanding the business behind the chart so you can trade confidently, avoid traps, and follow strong trends.
With FA, you:
Trade strong sectors
Choose high-growth companies
Avoid junk stocks
Catch big moves supported by institutions
Reduce risk
Increase success probability
FA tells you WHAT to trade.
TA tells you WHEN to trade.
Together—they build a powerful trading system.

Technical Analysis (TA) Mastery1. The Foundations of Technical Analysis
At its core, technical analysis relies on three key assumptions:
1.1 Market Discounts Everything
All information—economic, political, sentiment, and fundamental—is already reflected in price. Therefore, reading price is reading the collective behavior of market participants.
1.2 Prices Move in Trends
Markets do not move randomly; they move in trends: uptrends, downtrends, and sideways consolidations. Mastering TA requires identifying these trends early and riding them until signs of reversal emerge.
1.3 History Repeats Itself
Price patterns repeat because investor psychology—fear and greed—remains constant over time. Patterns like head and shoulders, triangles, and flags exist across decades because of this behavioral consistency.
2. Market Structure: The Backbone of TA Mastery
Before indicators, price patterns, or oscillators, a trader must learn how markets actually move.
2.1 Trend Structure
Uptrend: Higher highs (HH), Higher lows (HL)
Downtrend: Lower highs (LH), Lower lows (LL)
Sideways: Equal highs and lows
Identifying these structures helps traders avoid counter-trend mistakes and focus on high-probability setups.
2.2 Support & Resistance (S&R)
These are the most powerful tools in TA:
Support: A price level where buyers consistently step in.
Resistance: A price level where sellers emerge.
Strong S&R zones act like “decision points” where breakouts or reversals occur. TA mastery includes knowing when a level will hold or break—based on volume, candlesticks, and momentum.
2.3 Market Phases
Every market cycles through four stages:
Accumulation
Markup
Distribution
Markdown
This Wyckoff-style structure helps traders catch big moves and avoid traps.
3. Candlestick Mastery: Price Action at its Purest
Candlesticks represent raw decision-making in the market. Learning them gives you an instant emotional map—who controls the market: bulls or bears?
3.1 Key Candlestick Types
Doji → Indecision
Hammer/Inverted Hammer → Reversal signals
Engulfing → Strong reversal confirmation
Marubozu → Heavy momentum
3.2 Candlestick Patterns
Morning Star & Evening Star
Bullish/Bearish Engulfing
Pin Bar reversals
Inside Bars and Breakout Bars
Mastery comes when you can read candlesticks in context—resistance, trend direction, and volume matter more than the pattern itself.
4. Indicators and Oscillators: Enhancers, Not Predictors
Indicators help confirm price action. TA mastery means using them smartly, not blindly.
4.1 Trend Indicators
Moving Averages (20, 50, 200)
MACD
Use them to confirm trend direction and catch momentum shifts.
4.2 Momentum Indicators
RSI
Stochastic
CCI
These show overbought/oversold conditions, but only matter when aligned with trend strength.
4.3 Volatility Indicators
Bollinger Bands
ATR (Average True Range)
Great for breakout trades and stop-loss placement.
4.4 Volume Indicators
Volume Profile
OBV (On Balance Volume)
VWAP
Volume is the real power behind price movement. Breakouts with volume = reliable. Breakouts without volume = trap.
5. Chart Patterns: The Trader’s Language
Patterns represent crowd psychology. TA mastery involves recognizing these patterns early and calculating the risk–reward.
5.1 Continuation Patterns
Bull flags / Bear flags
Triangles (ascending, descending, symmetrical)
Rectangles
Cup and Handle
These indicate that the trend is likely to continue after a short pause.
5.2 Reversal Patterns
Head and Shoulders
Double Top / Bottom
Rounding Bottom
Falling / Rising Wedge
These help traders catch major turning points.
5.3 Breakouts and Fakeouts
Recognizing real breakouts vs false breakouts is critical. Volume, candle strength, and retests help filter traps.
6. Multi-Timeframe Analysis (MTA): The Secret Weapon of Pros
What beginners see as noise, experts see as structure.
6.1 How to Apply MTA
Higher timeframe (HTF): Identify trend → Weekly/Monthly
Middle timeframe: Identify S&R → Daily
Lower timeframe (LTF): Entry timing → 15m/1h
This top-down approach ensures every trade aligns with the bigger picture.
6.2 Benefits of MTA
Fewer false signals
Cleaner entries
Better trend direction understanding
Higher win rate
7. Risk Management: The Real TA Mastery
Even the best analysis fails without proper risk controls.
7.1 Position Sizing
Never risk more than 1–2% of capital per trade.
7.2 Stop-Loss Placement
Use:
ATR-based stops
Swing highs/lows
Major S&R
7.3 Risk–Reward Ratio (RRR)
Aim for at least 1:2 or 1:3 to stay profitable even with moderate accuracy.
7.4 Avoiding Overtrading
Mastery means waiting for high-probability setups, not trading every small move.
8. Trading Psychology: The Brain Behind TA
TA mastery is 70% psychology.
8.1 Common Psychological Traps
Fear of missing out (FOMO)
Revenge trading
Holding losing trades
Taking profits too early
8.2 Developing the Trader’s Mindset
Discipline > prediction
Consistency > luck
Process > outcome
A trader’s biggest enemy is not the market—it’s emotions.
9. Building a Professional TA Strategy
To truly master TA, you need a structured system.
9.1 The 5-Step Trading Blueprint
Identify Market Trend – MA, structure
Mark HTF S&R – weekly/daily
Look for Price Action Signals – candle patterns + volume
Confirm with Indicators – RSI, MACD, VWAP
Execute with Risk Control – stop-loss, position size
9.2 Backtesting Your Strategy
Check how your setup performs over 100–200 past trades. Backtesting reveals:
Win rate
Average RR
Drawdown
Strategy reliability
10. Continuous Improvement: The Path to TA Mastery
Markets evolve, and so must traders.
10.1 Keep a Trading Journal
Record:
Entry/exit
Reason for trade
Setup type
Emotional state
Lessons learned
10.2 Learn from Market Cycles
Each cycle—bull, bear, sideways—teaches different strategies.
10.3 Stay Updated
Follow market sentiment, global cues, and macro stories to complement TA.
Conclusion
Technical Analysis Mastery is not just learning indicators or patterns. It is the art of understanding price behavior, recognizing market psychology, and applying risk-controlled strategies consistently.
A true TA master:
Reads price like a story
Executes like a machine
Manages risk like a professional
Improves continuously

Zuari Agro Chemicals cmp 294.80 by Monthly Chart viewZuari Agro Chemicals cmp 294.80 by Monthly Chart view
- Support Zone 239 to 274 Price Band
- Resistance Zone 325 to 362 Price Band
- Rounding Bottom by Resistance Zone neckline
- Breakout well sustained above dotted Falling Resistance Trendlines
- 3rd Falling Resistance Trendline from ATH level Breakout maybe made
- Rising Support Trendlines are well respected by upside price momentum
- Volumes with heavy spikes in between by close sync with avg traded quantity

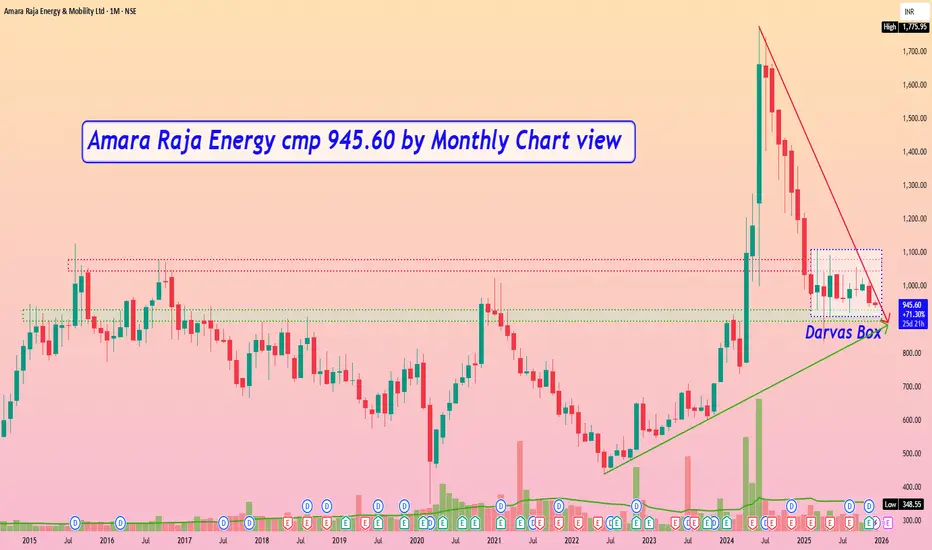
Amara Raja Energy cmp 945.60 by Monthly Chart viewAmara Raja Energy cmp 945.60 by Monthly Chart view
- Support Zone 895 to 930 Price Band
- Resistance Zone 1045 to 1080 >> 1110 Price Band
- Volumes seen closely flat to falling since hitting ATH in June 2024
- Volumes indicate consolidation and accumulation since February 2025
- Darvas Box : Price trending within 910 to 1110 range since February 2025
- Support Zone well respected over past few months but Price retracing at the Resistance Zone
Divergence Secrets Risks in Option Trading
High volatility risk
Time decay for buyers
Unlimited loss for sellers
Gap-up or gap-down opening risk
Liquidity issues in stock options
Wrong position sizing leads to heavy losses
Tips for Option Traders
Always trade with a clear plan: entry, exit, stop-loss.
Avoid trading just before big news events unless experienced.
Track global markets, FIIs, indices.
Manage risk: never risk more than 1–2% of capital per trade.
Learn option Greeks—Delta, Theta, Vega are essential.
Start with buying options; move to selling only after experience.
Avoid low-liquidity contracts.

Part 10 Trade Like Institutons Call Option (CE) Explained
A call option benefits from price going UP.
Call Buyer
Pays premium.
Unlimited profit potential.
Loss limited to premium paid.
Call Seller
Receives premium.
Profit limited to premium received.
Loss can be unlimited if price rises sharply.
Example:
You buy Nifty 22000 CE for ₹100.
If Nifty moves to 22100 at expiry, your option becomes ITM (In-the-money).
Intrinsic value = 22100 – 22000 = 100
You break even at 22100.
If Nifty moves to 22200,
Intrinsic value = 200
Profit = 200 – 100 = 100.

Part 8 Trading Master Class With ExpertsStrike Price
The strike price is the pre-decided level at which a call or put buyer can buy or sell the asset.
Example: If Nifty is trading at 22,000, you may choose from strikes like 21900, 22000, 22100, etc.
Expiry
Every option has a validity period. After that, it expires.
In India:
Index options (Nifty, Bank Nifty) have weekly expiries.
Stock options have monthly expiries.

Part 7 Trading Master Class With Experts What Are Options?
Options are derivative instruments whose value is derived from an underlying asset such as Nifty, Bank Nifty, stocks, commodities, or currencies.
An option is a contract between a buyer and seller regarding the future price of an asset within a specific time.
There are two types of options:
Call Option (CE) – Gives the buyer the RIGHT (but not the obligation) to BUY the asset at a fixed price (strike price).
Put Option (PE) – Gives the buyer the RIGHT (but not the obligation) to SELL the asset at a fixed price.
The seller (also called option writer) has the OBLIGATION to fulfill the contract if the buyer exercises the option.

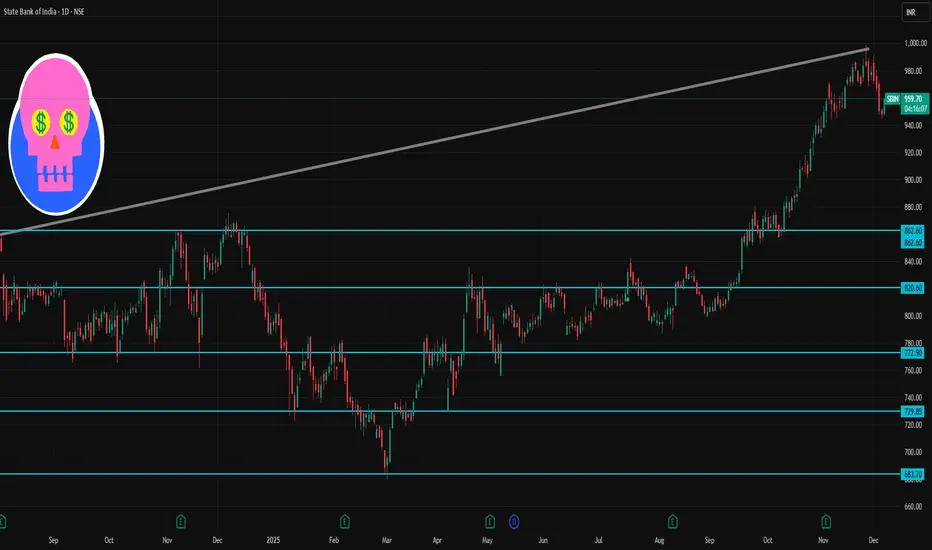
SBI 1 Day Time Frame 📌 Current Price Context
According to recent sources, SBI is trading around ₹949–₹957 (NSE/BSE) depending on the feed.
Its 52‑week trading range remains roughly ₹680 (low) to ₹999 (high).
🎯 What to Watch: Possible Scenarios
Bullish bias: If price holds above pivot (~₹988) and breaks above R1 (~₹994.5), watch for a move toward ~₹1005–₹1010+.
Neutral / Range‑bound: If price oscillates between support (~₹977–₹971) and pivot/resistance zone (~₹988–₹994), expect sideways movement.
Bearish bias: Break and close below S2/S3 (~₹971–₹960) might open downside — next major cushion near ~₹950–₹940.
Part 4 Learn Institutional TradingTrading Rules & Conditions Set by SEBI & Exchanges
a) KYC & Risk Disclosure
KYC and Risk Disclosure Documents (RDD) are mandatory before enabling F&O trading.
b) Contract Specifications
Every option contract has pre-defined:
Strike intervals
Lot size
Tick size
Expiry cycle (weekly/monthly)
c) No Guarantee of Profit
Exchanges emphasize that options are risky; brokers must warn traders.
d) No Insider Trading
Traders cannot use non-public information for trading.
e) Brokers Must Provide Transparency
Brokers need to show:
Margin reports
Contract notes
Daily ledger reports

Part 3 Learn Institutional Trading Expiry & Settlement Terms
a) Index Options (Nifty, Bank Nifty)
They are settled in cash, not in shares.
b) Stock Options
They are settled through physical delivery of shares if the contract expires in-the-money.
c) European Style Options (India)
Indian markets allow exercise only on expiry day, unlike American options (any time).
d) Premium Settlement
Premium is paid upfront while taking the position.
e) Final Settlement Price (FSP)
Exchanges calculate it based on the closing price of the underlying asset on expiry.

Part 1 Ride The Big Moves Obligations of Option Sellers
Option sellers carry more responsibility:
a) Seller Must Follow Buyer’s Decision
If the buyer decides to exercise, the seller must honor the contract.
b) Unlimited Risk for Naked Sellers
Losses can be unlimited if markets move strongly against the seller.
c) Mandatory Margin Requirement
Sellers need to maintain margin balance to cover potential losses.
d) Mark-to-Market Loss Adjustments
Brokers deduct daily losses from the seller’s trading account.
e) Physical Delivery for Stock Options
For stock options close to expiry, sellers may have to deliver shares physically if the contract expires in-the-money.

Premium Chart Patterns Knowledge How to Trade Chart Patterns
To trade chart patterns effectively:
A. Identify the Trend First
Reversal patterns work best after strong trends.
Continuation patterns form within established trends.
Trend context increases accuracy.
B. Wait for Confirmation
Never act only on shape.
Confirmation includes:
Breakout from neckline or trendline
Increase in volume
Candle close beyond levels
C. Set Entry Points
Examples:
Breakout above resistance (for bullish patterns)
Breakdown below support (for bearish patterns)
D. Stop Loss Placement
Stops should go:
Below breakout candle (bullish)
Above breakout candle (bearish)
Below/above swing points
Patterns help define natural risk zones.
E. Target Calculation
Most patterns offer measurable targets:
Double top/bottom: Height of pattern projected from breakout
Triangles: Base length projected from breakout
Flags: Length of flagpole added to breakout
This helps set realistic profit expectations.

PCR Trading Strategies Tips to Increase Your Profitability
✓ Trade with trend
Avoid buying OTM options randomly. Wait for momentum.
✓ Use volume profile & market structure
This helps identify breakout zones, reversal points, and premium traps.
✓ Avoid trading against volatility
Buy in low IV, sell in high IV.
✓ Don’t hold losing positions
Options decay fast → exit quickly if the market goes against you.
✓ Use hedged strategies
Spread strategies reduce risk and stabilize profits.

Divergence Secrets How Volatility Affects Profits
Volatility (VIX or IV) is another major factor.
You profit when:
IV goes up after you buy options
IV goes down after you sell options
High volatility = high premium
Low volatility = low premium
This is why buying options ahead of big events (Budget, elections, results) is riskier—IV may crash afterward.

Option Chain Analysis Time Decay (Theta): A Major Profit Source
Time decay is a predictable reduction in premium as expiry approaches.
How Theta works:
Buyers lose money daily if the price does not move.
Sellers gain money daily even if nothing happens.
Example:
Premium at start of week: ₹200
No price movement
By expiry: ₹20
Sellers keep ₹180 simply because time passed.

Understanding Position Sizing in Trading in the Indian Market1. Importance of Position Sizing
Position sizing is often overlooked by novice traders who focus solely on entry and exit strategies. However, the size of the position directly impacts the risk of the trade. Key reasons why position sizing is important include:
Risk Management: A well-calculated position limits losses in case a trade goes against the trader’s expectations. For instance, allocating too much capital to a single trade can lead to significant drawdowns.
Capital Preservation: Protecting trading capital is essential for survival in the market. Indian markets, like the NSE and BSE, can experience volatility due to economic announcements, geopolitical events, or corporate earnings, making capital preservation critical.
Psychological Comfort: Traders are more confident when risk is controlled. Proper position sizing reduces stress and emotional decision-making, which often leads to impulsive trades.
Consistent Profitability: Correct position sizing ensures that even if some trades fail, profits from winning trades can compensate, leading to overall consistent performance.
2. Factors Affecting Position Sizing in India
Several factors influence how traders should determine their position size in Indian markets:
Total Trading Capital: The overall portfolio size is the starting point. A trader with ₹10 lakh should consider different risk parameters than someone trading with ₹1 lakh.
Risk Per Trade: Most professional traders risk 1-3% of their capital per trade. For example, with ₹10 lakh capital, risking 2% per trade means the maximum loss per trade should not exceed ₹20,000.
Volatility of the Asset: Indian stocks, especially mid-cap and small-cap stocks, can be highly volatile. Highly volatile stocks require smaller position sizes to limit risk.
Stop-Loss Level: The distance between entry price and stop-loss price determines the potential loss per share. A tight stop-loss allows a larger position, while a wider stop-loss requires a smaller position size.
Market Type: Equities, derivatives, and commodities have different leverage and risk profiles. Futures and options in NSE can amplify gains and losses, so position sizing must account for margin requirements and leverage.
3. Position Sizing Methods
Several methods are commonly used by traders in India to calculate position size:
a) Fixed Dollar/Fixed Rupee Method
This method involves risking a fixed amount per trade, regardless of the stock price. For example, a trader decides to risk ₹10,000 per trade. This ensures that losses remain controlled, but it may not adjust for the volatility of different stocks.
B) Volatility-Based Position Sizing
In volatile Indian stocks, traders adjust position size according to the stock’s volatility. Average True Range (ATR) is often used to measure volatility. Highly volatile stocks receive smaller positions, and low-volatility stocks allow larger positions.
C) Kelly Criterion
The Kelly formula is a mathematical approach to maximize capital growth while managing risk. It calculates the optimal fraction of capital to invest based on win probability and reward-to-risk ratio. While precise, it is complex and often adjusted downwards to reduce risk in real-world trading.
4. Position Sizing in Indian Equities
Equity trading in India involves direct stock purchases or trades in derivatives like futures and options. Key considerations include:
Large-Cap vs Mid/Small-Cap: Large-cap stocks like Reliance, HDFC Bank, and Infosys are relatively less volatile, allowing slightly larger positions. Mid-cap and small-cap stocks require smaller position sizes due to higher volatility.
Liquidity Consideration: Stocks with higher trading volumes on NSE or BSE are easier to enter and exit. Illiquid stocks require smaller positions to prevent slippage.
Earnings Announcements & News: Indian markets are sensitive to corporate earnings, RBI announcements, and macroeconomic policies. Position size should be smaller when such events are expected to avoid excessive risk.
5. Position Sizing in Indian Derivatives Market
Trading in futures and options introduces leverage, which magnifies both profits and losses. Therefore:
Futures Contracts: Each NSE futures contract represents a certain number of shares. Traders must calculate potential loss using stop-loss levels and margin requirements before deciding the number of contracts.
Options: Buying call or put options involves premium risk. Traders risk only the premium paid but can adjust the number of contracts to align with their risk tolerance. Writing options carries unlimited risk, so extremely conservative position sizing is required.
Margin Leverage: Indian brokers offer leverage in derivatives. Traders should avoid over-leveraging by keeping a fraction of capital as margin buffer.
6. Practical Tips for Indian Traders
Start Small: Beginners should trade small positions to understand market behavior and manage psychological pressure.
Use Stop-Loss Religiously: Position size is ineffective without a stop-loss. NSE and BSE allow intraday stop-loss orders for risk management.
Diversify: Avoid concentrating positions in a single stock or sector. Diversification reduces unsystematic risk.
Adjust for Volatility: Use ATR or standard deviation to modify position size according to stock volatility.
Review Regularly: Position sizing is not static. Recalculate it based on changes in portfolio size, market volatility, and trading performance.
Leverage Awareness: Avoid using maximum leverage in futures or options. Keep leverage proportional to risk tolerance.
7. Common Mistakes in Position Sizing
Overtrading: Taking large positions on multiple trades simultaneously increases portfolio risk.
Ignoring Volatility: Treating all stocks equally regardless of volatility can lead to excessive losses.
No Risk Assessment: Entering trades without calculating potential loss per trade is a common mistake.
Emotional Adjustments: Increasing position size impulsively after a winning streak often leads to severe drawdowns.
8. Conclusion
Position sizing is the backbone of successful trading in the Indian markets. Whether trading equities, futures, options, or commodities, controlling the size of your positions relative to risk ensures long-term sustainability and profitability. It combines risk management, market knowledge, and psychological discipline. By using percentage risk, volatility-based, or fixed-amount methods, Indian traders can optimize returns while protecting capital.
A disciplined approach to position sizing transforms trading from speculation into a structured and controlled activity. It ensures that no single trade can wipe out your portfolio and allows traders to withstand market volatility, ultimately leading to consistent growth in the Indian market.

Part 2 Trading Master ClassHow Option Sellers Earn Profit
Option sellers (writers) make money very differently from buyers.
Sellers earn through:
Premium collection
Time decay (Theta) working in their favor
Market staying within a defined range
Selling gives higher probability of profit but unlimited risk if the market moves aggressively.
Example:
You sell Bank Nifty 49,000 CE at ₹220
Market stays sideways or falls
Premium collapses to ₹30
Your Profit = (220 – 30) × Lot Size
This profit results from the sold option expiring worthless.

Part 1 Trading Master ClassHow Put Options Generate Profit
A Put Option gives you the right to sell an asset at a fixed strike price.
You profit from a put when:
Underlying price moves below strike
Premium increases because market falls
Example:
Nifty at 22,000
You buy Put 22,000 PE for ₹100
Market falls to 21,700
Premium rises to ₹210
Your Profit = (210 – 100) × Lot Size
Put buyers make money when markets fall, similar to short selling but with limited risk.

Part 1 Support and Resistance Understanding the Foundation of Option Profits
Before diving into strategies, two basic forces determine profit in options:
A. Price Movement of the Underlying
If the underlying asset (stock, index, commodity) moves in the direction you expect, your option gains value.
Calls gain when price goes up
Puts gain when price goes down
B. Premium (Option Price)
Premium is the amount you pay (for buyers) or receive (for sellers/writers).
Profit/loss happens based on how this premium changes.
