Derivatives and Hedging RisksIntroduction
In modern financial markets, derivatives play a crucial role in managing uncertainty and volatility. A derivative is a financial instrument whose value is derived from an underlying asset such as stocks, commodities, interest rates, currencies, or indices. These instruments are widely used by investors, corporations, and financial institutions to hedge risks, speculate on price movements, and enhance portfolio performance.
Hedging, on the other hand, refers to the practice of reducing or offsetting potential losses from adverse price movements in an asset. Derivatives are the most efficient tools for hedging because they allow traders to take positions that move inversely to their underlying exposures. Together, derivatives and hedging form the backbone of risk management strategies in global financial systems.
Understanding Derivatives
Derivatives are contracts between two or more parties whose value is based on agreed-upon financial variables. These instruments do not necessarily involve the actual buying or selling of the underlying asset. Instead, they function as financial agreements to exchange cash flows or values based on the performance of the underlying asset.
Main Types of Derivatives
Futures Contracts
Futures are standardized agreements traded on exchanges to buy or sell an asset at a predetermined price and date in the future. Futures are used extensively for hedging commodities, currencies, and indices.
Example: A farmer might sell wheat futures to lock in prices before harvest to protect against falling wheat prices.
Forwards Contracts
Forwards are similar to futures but are traded over-the-counter (OTC) and customized to suit the needs of the buyer and seller. Since they are not standardized, they carry higher counterparty risk.
Example: An importer may enter a forward contract to purchase U.S. dollars at a fixed rate three months ahead to guard against currency depreciation.
Options Contracts
Options give the holder the right, but not the obligation, to buy (call option) or sell (put option) an asset at a predetermined price before or on a specific date. Options are flexible instruments for both hedging and speculation.
Example: An investor may buy a put option on a stock to protect against a potential price decline.
Swaps
Swaps involve the exchange of cash flows between parties, often related to interest rates or currencies. The most common types are interest rate swaps and currency swaps.
Example: A company paying variable interest might enter an interest rate swap to exchange its variable payments for fixed ones, reducing exposure to interest rate fluctuations.
Purpose and Importance of Derivatives
Derivatives serve several essential functions in financial markets:
Risk Management (Hedging) – The most important function of derivatives is to mitigate risk. Investors use derivatives to protect against price changes in commodities, currencies, or securities.
Price Discovery – Futures and options markets provide valuable information about future price expectations, helping businesses plan production and investment.
Market Efficiency – Derivatives improve liquidity, allowing for more efficient capital allocation and portfolio diversification.
Leverage and Speculation – They allow investors to take large positions with smaller capital outlays, though this can increase potential losses.
Understanding Hedging
Hedging is a defensive strategy used to offset potential losses in one position by taking another position in a related derivative instrument. The goal is not to generate profit but to minimize uncertainty and protect against adverse movements.
How Hedging Works
The process of hedging typically involves identifying a risk exposure and then selecting an appropriate derivative instrument to counterbalance that risk.
For example:
An airline company concerned about rising fuel costs might use crude oil futures to lock in fuel prices.
A multinational firm expecting payment in euros might use currency forwards to secure the current exchange rate.
By doing so, these entities ensure that fluctuations in market prices do not drastically affect their financial outcomes.
Common Hedging Instruments
Futures and Forwards for Price Risk
Companies use these contracts to fix the buying or selling price of an asset. This reduces uncertainty in cash flows and budgeting.
Options for Downside Protection
Options allow investors to protect against losses while still participating in potential gains. This is often referred to as an “insurance strategy.”
Swaps for Interest Rate and Currency Risk
Swaps are commonly used by corporations to stabilize cash flows and reduce borrowing costs when dealing with fluctuating interest rates or foreign currencies.
Hedging Strategies in Practice
Commodity Hedging
Producers and consumers of commodities such as oil, gold, or wheat use futures and options to stabilize prices and manage inventory risk.
Currency Hedging
Exporters and importers use forward or futures contracts to protect against adverse exchange rate movements. This ensures predictable revenue and cost structures.
Interest Rate Hedging
Financial institutions use interest rate swaps and futures to manage exposure to changing interest rates. For instance, banks with variable-rate assets and liabilities often hedge to maintain stable margins.
Equity Hedging
Investors use options and index futures to protect portfolios from market downturns. A common approach is buying put options on indices to limit losses during a market correction.
Advantages of Using Derivatives for Hedging
Risk Reduction – The primary advantage is minimizing exposure to market volatility.
Cost Efficiency – Derivatives require smaller initial investments than directly buying or selling the underlying asset.
Flexibility – With multiple contract types and structures, hedgers can customize their risk management approach.
Liquidity and Accessibility – Exchange-traded derivatives are liquid and transparent, offering ease of entry and exit.
Risks and Limitations of Derivatives and Hedging
While derivatives are powerful tools, they also carry certain risks that must be carefully managed.
Market Risk – Prices may move unpredictably, resulting in losses even in hedged positions.
Credit (Counterparty) Risk – In OTC contracts like forwards and swaps, there is a risk that one party may default.
Liquidity Risk – Some derivatives may lack buyers or sellers, making it hard to exit positions.
Operational Risk – Errors in execution, settlement, or valuation can lead to losses.
Basis Risk – The hedge and the underlying exposure may not move perfectly in correlation, resulting in imperfect hedges.
Speculative Misuse – Derivatives can be misused for speculative purposes, amplifying losses due to high leverage.
Regulatory Framework and Risk Management
Post the 2008 financial crisis, global regulators emphasized transparency, reporting, and clearing mechanisms for derivatives. Institutions are now required to:
Use central clearinghouses for standardized contracts.
Maintain adequate collateral (margin) to cover exposures.
Conduct regular stress testing and valuation reviews.
These measures aim to reduce systemic risk and ensure that derivatives serve their intended purpose—effective risk mitigation.
Conclusion
Derivatives and hedging together represent the foundation of modern financial risk management. Derivatives provide powerful mechanisms to transfer and manage risk efficiently, while hedging strategies enable investors and corporations to protect themselves from adverse market movements. When used responsibly, derivatives help stabilize earnings, control costs, and improve financial predictability.
However, their complexity demands a deep understanding and disciplined application. Poorly designed or speculative use can lead to severe financial losses, as history has shown. The key to success lies in prudent strategy, robust regulation, and transparent practices. In essence, derivatives and hedging transform uncertainty into opportunity—offering stability in an unpredictable financial world.
Trendlineanalysis
How to Catch Momentum Traders1. Understanding Momentum Trading
Momentum trading is based on a simple but powerful concept: “The trend is your friend.” Momentum traders look for assets that show strong upward or downward trends and enter trades expecting those moves to continue. They don’t rely much on fundamental analysis or long-term value; instead, they focus on price action, volume, and technical signals.
Momentum in markets occurs when a large number of traders and investors pile into a position, causing rapid price acceleration. This can be driven by positive earnings reports, macroeconomic news, market sentiment, or algorithmic activity. As long as the momentum persists, traders can capture substantial profits — but when it reverses, losses can be just as swift.
2. The Psychology Behind Momentum Traders
To catch momentum traders, one must first understand their psychology. Momentum traders are drawn to:
Speed: They prefer fast-moving markets.
Volatility: Higher volatility offers bigger profit potential.
Liquidity: They trade in assets where they can enter and exit easily.
Trends: They look for confirmation of existing price direction, not reversals.
They often use breakout strategies — buying when the price breaks above resistance or shorting when it falls below support. Their collective actions amplify market moves, creating self-reinforcing cycles. Recognizing this crowd behavior helps other traders anticipate momentum-driven surges or collapses.
3. Identifying Momentum Trades in Action
Catching momentum traders begins with identifying when they enter or exit markets. Certain indicators and patterns reveal their presence:
High Trading Volume: A sudden surge in volume signals institutional or retail momentum traders jumping in. Volume confirms the strength of a price move.
Breakouts: When price breaks above previous resistance levels with strong volume, it’s often the starting point of a momentum rally.
Price Acceleration: Rapid price increases or decreases without major pullbacks are typical of momentum trading.
Volatility Expansion: Momentum traders love volatility; rising average true range (ATR) often hints that they are active.
By watching these indicators, you can anticipate when momentum traders are likely entering or exiting, giving you an advantage.
4. Tools and Indicators to Catch Momentum Traders
Momentum traders rely heavily on technical indicators, and these same tools can help others catch their movements. Key ones include:
Relative Strength Index (RSI): Measures speed and change of price movements. Momentum traders often enter when RSI crosses above 50 or 70, signaling strong bullish momentum.
Moving Average Convergence Divergence (MACD): Identifies momentum shifts. A bullish crossover often indicates that momentum traders are entering.
Volume Oscillator: Highlights surges in volume that accompany price trends.
Rate of Change (ROC) and Momentum Indicators: Directly show how fast price is changing, helping identify momentum bursts.
Moving Averages (20-day or 50-day): Price consistently staying above a moving average signals continued momentum.
By monitoring these indicators in real-time, one can identify when momentum traders are likely to act — or when they might be exhausted.
5. Following the Money: Watching Institutional Flow
While many momentum traders are retail participants, large institutional players also engage in momentum strategies using algorithmic systems. To catch them, monitor order flow and market depth:
Order Book Data: Large buy or sell orders can signal where institutional momentum traders are accumulating or distributing positions.
Volume-Weighted Average Price (VWAP): Momentum traders often enter when price crosses above VWAP, showing market strength.
Dark Pool Activity: A sudden rise in dark pool trades can hint at institutional buildup before visible market momentum.
Understanding these flows can help you anticipate short-term trends before the broader market catches on.
6. Trading Strategies to Catch Momentum Traders
Once you’ve identified momentum activity, there are several ways to trade effectively around it:
A. Trade with the Momentum
This approach means joining the trend early and riding the wave. To do this:
Wait for confirmation via volume and breakout.
Use tight stop-losses to manage risk.
Scale out gradually as momentum matures.
For example, if a stock breaks above resistance with double average volume, entering shortly after confirmation can capture a strong upward move.
B. Fade the Momentum
Advanced traders sometimes trade against momentum when it looks overextended. Signs of exhaustion include:
RSI above 80 (overbought) or below 20 (oversold).
Divergence between price and momentum indicators (e.g., price rises but RSI drops).
Sharp reversal candles like shooting stars or bearish engulfing patterns.
Timing is critical; entering too early can lead to losses, as momentum can persist longer than expected.
C. Momentum Reversal Traps
Sometimes momentum traders push prices to extremes, creating opportunities for reversal setups. By waiting for false breakouts or sudden volume drop-offs, contrarian traders can profit when momentum collapses.
7. The Role of News and Sentiment
Momentum traders react swiftly to news — earnings, economic releases, political events, or even social media hype. Monitoring news feeds, Twitter sentiment, and Reddit or X (formerly Twitter) discussions can reveal where retail momentum might strike next.
Tools like Google Trends, social sentiment trackers, and alternative data feeds help anticipate “hot” assets before they explode in price. Momentum-driven rallies often start with strong emotional triggers — greed, fear, or excitement — amplified by online chatter.
8. Risk Management When Dealing with Momentum Traders
Catching momentum traders can be profitable, but it’s risky. Momentum trades reverse sharply, and being on the wrong side can cause steep losses. To manage risk:
Set stop-losses tightly to limit exposure.
Avoid chasing late moves — entering after most of the momentum has played out.
Use trailing stops to lock in profits while allowing room for trends to continue.
Diversify across assets to avoid concentrated momentum shocks.
Momentum markets can be emotional and unpredictable — discipline is essential.
9. Recognizing Momentum Exhaustion
Momentum cannot last forever. The key to catching traders is knowing when they’re about to exit. Warning signs include:
Diminishing volume after a strong run.
Price stagnation despite positive news.
Divergences in RSI or MACD indicating weakening trend strength.
Parabolic price rise followed by sharp pullbacks.
When these appear, momentum traders are likely reducing positions or reversing direction — a perfect signal for strategic counter-trades.
10. Combining Technical and Behavioral Insights
The most successful way to catch momentum traders is by merging technical analysis with behavioral understanding. Markets move not just because of charts but because of emotions — greed, fear, and herd behavior. Recognizing patterns of crowd psychology alongside price signals provides deeper insights.
For instance:
Fear-driven selling during bad news can create oversold momentum trades.
FOMO-driven rallies often signal near-term tops.
Algorithmic bursts create predictable short-term spikes.
By studying how traders react collectively, you can identify entry and exit points that align with — or exploit — momentum participants’ behavior.
Conclusion
Catching momentum traders isn’t about outsmarting them — it’s about understanding and timing them. Momentum trading shapes short-term market movements, and those who can identify when and where it happens gain a significant advantage.
The keys are:
Recognize technical signals like breakouts, volume surges, and volatility expansion.
Track order flow and institutional participation.
Manage risk carefully with stop-losses and profit-taking strategies.
Understand trader psychology — emotion fuels momentum.
In essence, markets are waves of energy created by collective behavior. Momentum traders ride those waves — and with the right tools, timing, and mindset, you can catch them before they crest or crash.
How to Trade Smart with Crypto1. Understand the Crypto Market Fundamentals
Before you can trade smart, you must understand what you’re trading. Cryptocurrencies are decentralized digital assets built on blockchain technology. Bitcoin (BTC), Ethereum (ETH), Solana (SOL), and thousands of others represent different projects, purposes, and technologies.
Key points to understand:
Bitcoin (BTC) is the first and most influential cryptocurrency, often seen as a digital store of value.
Altcoins like Ethereum, Binance Coin, and Cardano serve specific network functions (smart contracts, DeFi, etc.).
Stablecoins (like USDT, USDC) are pegged to fiat currencies and used for liquidity and hedging.
Tokens vs. Coins: Coins operate on their own blockchain (e.g., Bitcoin), while tokens are built on others (e.g., Uniswap token on Ethereum).
Understanding market structure—spot trading, futures, leverage, and decentralized exchanges (DEXs)—helps you make informed decisions rather than emotional ones.
2. Choose a Reliable Exchange and Secure Your Assets
Trading starts with choosing the right exchange. Reputable centralized exchanges like Binance, Coinbase, Kraken, or Bybit offer security, liquidity, and various tools. For advanced users, decentralized exchanges like Uniswap or PancakeSwap provide more control and privacy.
Smart traders prioritize security:
Use hardware wallets (Ledger, Trezor) for long-term storage.
Enable two-factor authentication (2FA) and strong passwords.
Avoid keeping large sums on exchanges; “not your keys, not your coins” is a golden rule.
A smart trader treats cybersecurity as seriously as trading strategy—because one mistake can mean total loss.
3. Learn Market Analysis: Fundamental vs. Technical
Two main forms of analysis drive smart trading: fundamental analysis (FA) and technical analysis (TA).
Fundamental Analysis
FA examines the intrinsic value of a crypto asset. Key factors include:
Project purpose – What problem does it solve?
Team and development – Are the developers credible?
Tokenomics – Supply, demand, and utility.
Adoption and partnerships – Who’s using or supporting it?
For example, Ethereum’s strength comes from its use in decentralized applications and DeFi, while meme coins often lack fundamentals and depend on hype.
Technical Analysis
TA studies price charts and patterns to forecast market behavior. Smart traders use indicators like:
Moving Averages (MA) – Identify trend direction.
Relative Strength Index (RSI) – Detect overbought or oversold conditions.
MACD – Reveal momentum shifts.
Support and Resistance – Predict entry and exit zones.
Combining FA and TA provides a balanced, data-driven approach instead of trading on speculation or emotion.
4. Develop a Clear Trading Strategy
A smart crypto trader never trades blindly. Instead, they follow predefined strategies based on risk appetite and time commitment.
Common strategies include:
a. Day Trading
Frequent trades within a day, taking advantage of volatility. It requires constant monitoring and fast decisions.
b. Swing Trading
Holding positions for days or weeks to capture medium-term price movements. It’s less stressful but demands chart analysis.
c. Scalping
High-frequency trading to profit from small price changes. This needs precision, low fees, and strong emotional control.
d. Position Trading
Long-term strategy based on major trends or fundamental belief in an asset’s future. Often used by Bitcoin or Ethereum holders.
e. Dollar-Cost Averaging (DCA)
Investing a fixed amount periodically regardless of price. It reduces emotional bias and smooths out volatility over time.
Choose a method that fits your lifestyle, time availability, and psychological comfort.
5. Manage Risk Like a Professional
Trading smart is not about maximizing profits—it’s about minimizing losses.
Risk management separates successful traders from gamblers.
Key principles include:
Never risk more than 1–2% of your capital per trade.
Set stop-loss orders to automatically limit downside.
Take-profit targets to secure gains.
Diversify: Don’t put all your money into one coin or project.
Use leverage cautiously: Leverage amplifies both gains and losses.
A disciplined trader thinks in probabilities, not certainties. Even the best setups can fail; risk management ensures you live to trade another day.
6. Keep Emotions in Check
The crypto market is extremely volatile—prices can move 20% in an hour. Greed and fear often drive traders to make impulsive decisions. Smart traders master their emotions by following a system, not feelings.
Avoid:
FOMO (Fear of Missing Out) – Chasing hype can lead to buying tops.
Panic Selling – Dumping assets during dips often locks in losses.
Overtrading – Too many trades increase fees and mistakes.
Build emotional discipline by keeping a trading journal—record why you entered and exited a trade. Reviewing patterns helps you identify emotional triggers.
7. Stay Updated and Adapt
Crypto evolves daily—new technologies, regulations, and narratives emerge constantly. Staying informed gives traders an edge.
Follow:
News platforms like CoinDesk, CoinTelegraph, and Decrypt.
Data tools like CoinMarketCap and Glassnode.
On-chain analytics for wallet movements and whale activity.
Social signals from Twitter, Reddit, and Discord (with caution).
Adaptability is essential. For instance, shifts like Ethereum’s “Merge,” Bitcoin halving cycles, or new layer-2 solutions can drastically impact market sentiment.
8. Understand Market Cycles and Sentiment
Crypto operates in cycles driven by liquidity, investor psychology, and Bitcoin halving events. Typically:
Bull Markets – Optimism and price surges.
Bear Markets – Pessimism, consolidation, and accumulation phases.
Smart traders use tools like the Fear & Greed Index or on-chain metrics (e.g., exchange inflows) to read sentiment and position accordingly. They accumulate during fear and take profits during euphoria—the opposite of the crowd.
9. Embrace Automation and Tools
Smart traders leverage technology:
Trading bots execute automated strategies using algorithms.
Portfolio trackers like CoinStats or Zapper monitor performance.
Alert tools like TradingView notify price movements.
DeFi protocols enable yield generation through staking or liquidity provision.
However, automation requires careful setup. Bots can fail in volatile markets, so human oversight remains critical.
10. Think Long-Term and Build Wealth Sustainably
The smartest crypto traders see the market not just as a casino, but as a wealth-building ecosystem. They combine trading with long-term investing, staking, and diversification across assets like NFTs, DeFi tokens, and Bitcoin.
Principles for long-term success:
Compound your gains instead of withdrawing impulsively.
Learn continuously through books, courses, and communities.
Protect capital—survival is the first step to profitability.
Have patience—crypto rewards those who endure cycles.
Remember: The most successful traders are not those who made one lucky trade but those who consistently manage risk and adapt over time.
Conclusion
Trading smart in crypto is a blend of knowledge, strategy, and discipline. It’s about understanding market behavior, applying data-driven decisions, managing emotions, and protecting capital. While the market offers immense opportunities, it equally demands respect for its volatility and unpredictability.
Smart crypto trading isn’t about predicting every move—it’s about building a system that survives and thrives across all conditions. Whether you’re a beginner or a seasoned trader, the path to success lies in continuous learning, emotional mastery, and a focus on long-term growth rather than short-term greed.
In the ever-changing world of digital assets, remember this timeless rule:
Trade with logic, not emotion. Plan every move, and let patience and discipline guide your profits.
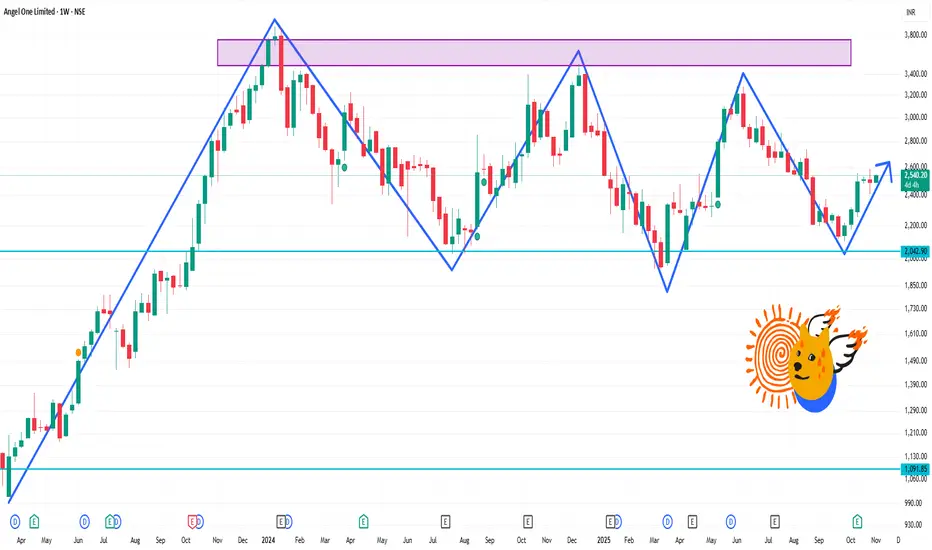
ANGELONE 1 Week Time FrameCurrent price ≈ ₹2,514.50.
Support zone: ~ ₹2,450-2,480
Resistance / near term ceiling: ~ ₹2,560-2,600
If momentum builds: breakout above ~ ₹2,600 could target ~ ₹2,650-2,700
On weakness: below ~ ₹2,450, watch for a move toward ~ ₹2,400
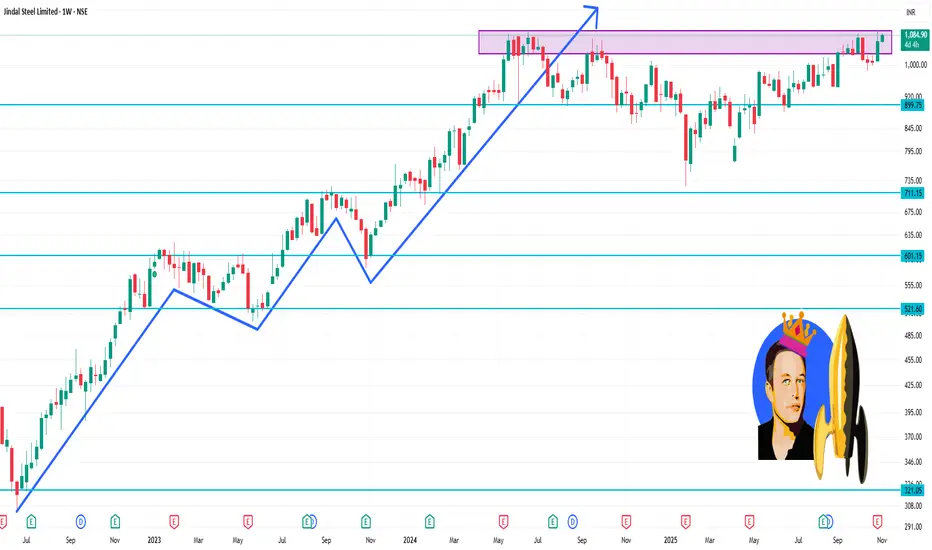
JINDALSTEL 1 Week Time Frame 🔍 Key Levels
Approximate current price: ~ ₹1,066 – 1,084.
Important support zones:
~ ₹988 – ₹998 (weekly major support)
Deeper support: ~ ₹973 – ₹975
Key resistance zones:
Near ~ ₹1,022 – ₹1,038 (weekly resistance area)
Higher resistance: ~ ₹1,047 – ₹1,068
Part 1 Support and Resistance Introduction to Options
Option trading is one of the most powerful and flexible instruments in the financial markets. It allows traders and investors to speculate, hedge, or enhance returns with limited risk. Simply put, an option is a contract that gives the buyer the right, but not the obligation, to buy or sell an underlying asset (like a stock, index, or commodity) at a predetermined price (strike price) before or on a specific date (expiry date).
Unlike shares, which represent ownership in a company, an option is a derivative instrument — its value is derived from the price of an underlying asset. Options are widely traded in stock markets, especially on exchanges like the NSE (National Stock Exchange) in India and NYSE/NASDAQ in the U.S.

Divergence SecretsOption Premium and Its Components
The premium (price of an option) is determined by several factors. It consists of:
Intrinsic Value (IV): The real value if the option were exercised immediately.
For a call: IV = Spot Price – Strike Price (if positive).
For a put: IV = Strike Price – Spot Price (if positive).
Time Value (TV): The extra premium paid for the time left until expiry, reflecting the potential for price movement.
So,
Option Premium = Intrinsic Value + Time Value.
As the option nears expiry, the time value decays—a phenomenon known as time decay or Theta decay.

Part 2 Candle Stick PatternOption Writers and Their Role
Every option has a buyer and a seller (writer). The seller earns the premium but carries unlimited risk if the market moves against the position.
For example, if a trader sells a NIFTY 22,000 call and the index rises to 22,500, the seller must compensate the buyer for the 500-point move. Hence, writers usually require higher margin money and risk management discipline.

Introduction to Option Greeks and Hedging1. Understanding the Concept of Option Greeks
Option Greeks are mathematical measures derived from the Black-Scholes model and other pricing models. Each Greek represents a different dimension of risk associated with holding an option position. Collectively, they help traders understand how their portfolio will behave when market variables change. The main Greeks are Delta, Gamma, Theta, Vega, and Rho.
These metrics provide traders with a structured approach to assess risk exposure. By interpreting these values, traders can anticipate potential losses or gains when market conditions shift, allowing them to make timely adjustments through hedging.
2. Delta (Δ): Sensitivity to Price Movement
Delta measures how much the price of an option changes in response to a ₹1 (or $1) change in the price of the underlying asset.
For call options, Delta ranges between 0 and +1.
For put options, Delta ranges between 0 and –1.
For example, if a call option has a Delta of 0.6, it means that for every ₹1 increase in the stock price, the option’s price will increase by ₹0.60.
Interpretation:
A Delta close to 1 (or –1) indicates the option behaves almost like the underlying asset.
A Delta near 0 means the option is far out-of-the-money and less responsive to price changes.
Use in Hedging:
Traders use Delta to create Delta-neutral portfolios. This means the portfolio’s overall Delta equals zero, making it immune to small price movements in the underlying asset. For instance, if a trader holds call options with a total Delta of +100, they can short 100 shares of the underlying asset to neutralize price risk.
3. Gamma (Γ): Rate of Change of Delta
While Delta measures how much an option’s price changes with the underlying, Gamma measures how much Delta itself changes with a ₹1 move in the underlying.
Gamma is highest for at-the-money options and lowest for deep in-the-money or out-of-the-money options.
Interpretation:
A high Gamma means the Delta changes rapidly, leading to higher price sensitivity.
A low Gamma means Delta changes slowly, making the position more stable.
Use in Hedging:
Gamma helps traders understand how stable their Delta hedge is. For instance, if you are Delta-neutral but have high Gamma exposure, even a small move in the stock price can make your portfolio Delta-positive or Delta-negative quickly. Active traders monitor Gamma to rebalance their hedges dynamically.
4. Theta (Θ): Time Decay
Theta represents the rate at which the value of an option declines as time passes, assuming other factors remain constant.
Options are wasting assets, meaning their value decreases as expiration approaches. Theta is usually negative for option buyers and positive for option sellers.
For example, if an option has a Theta of –0.05, it will lose ₹0.05 per day due to time decay.
Interpretation:
Short-term, out-of-the-money options have faster time decay.
Long-term options lose value slowly.
Use in Hedging:
Option sellers (like covered call writers) use Theta to their advantage, as they profit from the natural erosion of time value. On the other hand, buyers may hedge against Theta decay by selecting longer-dated options or adjusting their positions as expiration nears.
5. Vega (ν): Sensitivity to Volatility
Vega measures how much an option’s price changes for a 1% change in implied volatility (IV).
Volatility reflects the market’s expectation of how much the underlying asset will fluctuate. An increase in volatility generally raises option premiums, benefiting buyers and hurting sellers.
Example:
If an option has a Vega of 0.10, a 1% rise in implied volatility will increase the option’s price by ₹0.10.
Interpretation:
Options with more time to expiration have higher Vega.
At-the-money options are more sensitive to volatility changes than deep in/out-of-the-money options.
Use in Hedging:
Traders hedge volatility exposure by taking opposite positions in options with similar Vega but different expirations or strike prices. For example, calendar spreads and straddles are often used to manage Vega risk.
6. Rho (ρ): Sensitivity to Interest Rates
Rho measures how much an option’s price changes for a 1% change in interest rates.
For call options, Rho is positive — higher rates increase their value.
For put options, Rho is negative — higher rates reduce their value.
While Rho is less impactful in short-term trading, it can influence long-term options significantly, especially when central banks alter monetary policy.
7. Combining Greeks for Effective Hedging
A successful options trader doesn’t look at any single Greek in isolation. Each Greek interacts with others, influencing risk and reward simultaneously. For example:
A position may be Delta-neutral but still exposed to Gamma and Vega risks.
Theta decay may offset Vega gains in some situations.
Therefore, professional traders use multi-Greek hedging — balancing Delta, Gamma, and Vega together to minimize exposure to market fluctuations, volatility changes, and time decay.
8. Practical Hedging Strategies Using Option Greeks
Here are some common hedging approaches that rely on understanding and adjusting Greeks:
a. Delta Hedging
The most common form of hedging. Traders adjust their stock or futures positions to offset the Delta of their options portfolio. This ensures that small price moves in the underlying have minimal impact on total portfolio value.
b. Gamma Hedging
Used by professional traders to reduce the rate at which Delta changes. This typically involves adding options positions that balance out the portfolio’s Gamma exposure, keeping Delta more stable as prices move.
c. Vega Hedging
To manage volatility exposure, traders use spreads such as calendar or diagonal spreads. These involve buying and selling options with different expiration dates or strikes to neutralize Vega.
d. Theta Management
For option buyers, Theta is a cost that must be managed by timing trades or using longer expirations. For sellers, it is a profit mechanism — hence, they may hedge Delta exposure but keep Theta positive to benefit from time decay.
9. Real-World Example
Imagine a trader buys a NIFTY call option with a Delta of 0.5, Gamma of 0.03, Vega of 0.08, and Theta of –0.04.
If the NIFTY index rises by 100 points, the option’s price should increase by approximately 50 points due to Delta. However, because of Gamma, Delta itself will rise slightly, amplifying the next move.
If market volatility increases by 1%, the option gains another 8 points from Vega. But as time passes, the option loses 4 points per day due to Theta.
By analyzing these Greeks together, the trader can anticipate how the position will behave and decide whether to hedge using futures or additional options.
10. Importance of Greeks and Hedging in Risk Management
In modern trading, understanding Option Greeks is essential not only for speculation but for risk management. They transform options from gambling instruments into sophisticated financial tools.
Delta helps manage directional exposure.
Gamma ensures stability of hedging.
Theta highlights the cost of holding positions.
Vega monitors volatility risk.
Rho prepares for interest rate shifts.
Through hedging, traders can create positions that align with their risk appetite and market outlook. The goal is not to eliminate risk entirely, but to control and balance it.
Conclusion
Option Greeks are the heartbeat of options pricing and risk management. They allow traders to quantify and predict how market variables—price, time, volatility, and interest rates—affect their positions. Mastering these Greeks is the first step toward becoming a disciplined, professional trader.
By integrating Greeks into hedging strategies, traders can protect their portfolios from adverse movements, stabilize returns, and operate with confidence in volatile markets. In essence, Greeks transform options trading from speculation into a science of probability and precision — where managing risk is as important as chasing profits.

The Relationship Between Risk and Position Size1. Understanding Risk in Trading
Risk in trading refers to the potential for financial loss on a given trade or investment. Every time you enter a trade, you expose yourself to uncertainty — the market may move in your favor, but it can also move against you.
Traders quantify risk in several ways:
Monetary Risk: The amount of money that could be lost on a trade.
Percentage Risk: The portion of total account capital that could be lost if the trade fails.
Market Risk: The possibility of price movement against your position due to volatility, news, or macroeconomic factors.
For instance, if you have a ₹100,000 trading account and you risk ₹2,000 on a single trade, your risk per trade is 2% of your capital. Managing this risk percentage is fundamental to long-term survival in the markets.
2. What Is Position Size?
Position size determines how much of your total trading capital you allocate to a specific trade. It’s not just about how many shares or contracts you buy; it’s about how much money you’re willing to risk on that position.
For example, suppose you buy 100 shares of a stock at ₹500 with a stop-loss at ₹490. Your risk per share is ₹10, and the total risk on the trade is ₹1,000 (100 shares × ₹10). If your maximum risk per trade is ₹1,000, then your position size (100 shares) aligns perfectly with your risk tolerance.
Thus, position size acts as a bridge between your risk limit and market volatility.
3. The Risk-Position Size Equation
The core relationship between risk and position size can be summarized in one simple formula:
Position Size = Account Risk Amount / Trade Risk per Unit
Where:
Account Risk Amount = (Total account balance × Percentage of risk per trade)
Trade Risk per Unit = (Entry price − Stop-loss price)
Example:
Let’s say:
Account size = ₹200,000
Risk per trade = 2% (₹4,000)
Entry = ₹1,000, Stop-loss = ₹980 (₹20 risk per share)
Then:
Position Size = ₹4,000/ ₹20 = 200 shares
This means you can safely buy 200 shares of that stock while keeping risk under 2% of your capital.
4. Why Position Sizing Is Critical
Position sizing is one of the most effective tools for controlling risk and ensuring longevity in trading. Even if you have an excellent strategy, poor sizing can wipe out your account after just a few losing trades.
Here’s why it matters:
Capital Preservation: Proper position sizing ensures you never lose too much on a single trade.
Emotional Stability: Knowing your risk in advance helps reduce emotional stress during volatile market movements.
Consistency: By maintaining a fixed risk percentage per trade, your results become more predictable and controlled.
Compounding Growth: Smaller, consistent losses allow capital to compound over time rather than being eroded by large drawdowns.
5. The Role of Stop-Loss in Position Sizing
Stop-loss orders are essential in defining how much you risk per trade. Without a stop-loss, you can’t calculate your position size accurately because you don’t know where the trade is invalidated.
When traders set their stop-loss, they define:
The maximum loss per share/unit, and
The total amount they’re willing to lose on that trade.
For instance, a wider stop-loss (say ₹50 per share) means you must take a smaller position to maintain the same total risk. Conversely, a tighter stop-loss (₹10 per share) allows for a larger position. Thus, stop-loss distance directly affects position size.
6. Fixed Fractional Position Sizing
One of the most common risk management methods is Fixed Fractional Position Sizing, where you risk a fixed percentage (usually 1–2%) of your total account on every trade.
If your account grows, your risk amount grows proportionally; if your account shrinks, the amount you risk decreases automatically. This approach ensures you adapt to both profits and drawdowns dynamically.
Example:
Account Size 2% Risk per Trade ₹ Risk Amount Stop Loss (₹10) Position Size
₹100,000 2% ₹2,000 ₹10 200 shares
₹120,000 2% ₹2,400 ₹10 240 shares
₹80,000 2% ₹1,600 ₹10 160 shares
This method helps traders scale their positions safely as they grow their capital.
7. Risk-to-Reward Ratio and Position Size
While position size controls risk, the risk-to-reward ratio (R:R) determines whether a trade is worth taking. Traders typically look for trades where the potential reward outweighs the risk — often at least 1:2 or 1:3.
For instance, if your stop-loss is ₹10 below entry and your target is ₹30 above, your R:R is 1:3. Even with a 40% win rate, you can still be profitable because your winning trades yield more than your losses.
Position sizing ensures that even if you lose multiple trades in a row, your average loss remains small, while profitable trades make up for the setbacks.
8. The Psychological Connection
Traders often underestimate the psychological comfort that comes from correct position sizing. Over-leveraging — taking oversized positions relative to account size — leads to stress, fear, and impulsive decisions. On the other hand, trading too small may limit returns and confidence.
A well-calibrated position size:
Reduces fear of loss
Prevents emotional overreaction
Builds trading discipline
Psychologically, traders who respect their risk limits are more consistent because they are not emotionally attached to single trades — they think in terms of probabilities rather than outcomes.
9. Advanced Approaches to Position Sizing
Professional traders often use adaptive or dynamic position sizing models, which adjust based on volatility, performance, or confidence level.
Volatility-Based Position Sizing: Uses tools like Average True Range (ATR) to adjust position size. If volatility increases, position size decreases to maintain consistent risk.
Kelly Criterion: A mathematical model used to maximize long-term growth by balancing risk and return.
Equity Curve-Based Adjustments: Increasing risk slightly after winning streaks or reducing it during drawdowns to manage performance-based emotions.
These methods fine-tune the balance between aggression and safety.
10. The Balance Between Risk and Opportunity
The relationship between risk and position size is about finding equilibrium — taking enough risk to grow your capital but not so much that you blow up after a few losses.
Trading is not about avoiding risk entirely; it’s about controlling and pricing it intelligently. When position sizing is aligned with your risk tolerance, trading edge, and emotional stability, you achieve consistency — the key to long-term profitability.
Conclusion
The relationship between risk and position size defines the foundation of successful trading. Without proper position sizing, even the best strategies can fail due to uncontrolled losses. By managing risk per trade, setting disciplined stop-losses, and aligning position size with account capital, traders can survive drawdowns and thrive during profitable phases.
Ultimately, trading is not about predicting every move — it’s about managing uncertainty. Position sizing transforms that uncertainty into a controlled and measurable risk, giving traders the confidence and consistency needed to succeed in any market environment.
In short: Position sizing is not just a number — it’s your safety net, your strategy, and your survival plan.
Types of Trading Strategies1. Scalping Strategy
Scalping is one of the fastest trading styles, where traders aim to profit from small price movements within very short timeframes — sometimes just seconds or minutes. Scalpers make multiple trades throughout the day, capturing small gains that can accumulate into significant profits over time.
Key Features:
Very short-term trades (seconds to minutes).
High number of trades per day.
Focus on liquidity and tight spreads.
Heavy reliance on technical indicators such as moving averages, Bollinger Bands, and volume indicators.
Advantages:
Quick results and high trading frequency.
Reduced exposure to overnight risk.
Disadvantages:
Requires constant monitoring and quick decision-making.
High transaction costs due to frequent trades.
Scalping is best suited for highly experienced traders with fast execution systems and access to low transaction fees.
2. Day Trading Strategy
Day trading involves buying and selling financial instruments within the same trading day to capitalize on intraday price movements. Traders close all positions before the market closes to avoid overnight risks like unexpected news or global events.
Key Features:
Positions last from minutes to hours.
No overnight holdings.
Heavy use of technical analysis and intraday charts like 5-minute or 15-minute timeframes.
Common Tools Used:
VWAP (Volume Weighted Average Price)
Relative Strength Index (RSI)
MACD (Moving Average Convergence Divergence)
Support and resistance levels
Advantages:
Avoids overnight market gaps and risks.
Multiple opportunities within a single session.
Disadvantages:
High emotional and mental pressure.
Requires significant time and attention during market hours.
Day trading is popular among retail traders and professionals who thrive in fast-paced environments.
3. Swing Trading Strategy
Swing trading is a medium-term strategy that aims to capture price "swings" within a trend. Traders hold positions for several days to weeks, seeking to benefit from short-term momentum.
Key Features:
Time horizon: few days to a few weeks.
Combination of technical and fundamental analysis.
Focus on trend reversals and continuation patterns.
Tools & Indicators:
Trendlines and channels
Moving averages (20, 50, 200 EMA)
Fibonacci retracement levels
Candlestick patterns
Advantages:
Less time-intensive than day trading.
Opportunity to capture larger price moves.
Disadvantages:
Exposure to overnight or weekend risks.
Requires patience and discipline.
Swing trading is ideal for part-time traders who cannot monitor the market all day but still want to actively participate in trading opportunities.
4. Position Trading Strategy
Position trading is a long-term approach where traders hold positions for weeks, months, or even years. It relies more on fundamental analysis—such as company earnings, interest rate trends, or macroeconomic indicators—than on short-term price patterns.
Key Features:
Long-term holding period.
Minimal monitoring compared to short-term trading.
Focus on underlying market fundamentals.
Examples:
Buying undervalued stocks for long-term appreciation.
Holding commodities or currencies based on economic cycles.
Advantages:
Lower transaction costs.
Reduced stress and less market noise.
Disadvantages:
Capital gets locked for longer periods.
Market reversals can lead to larger drawdowns.
Position trading suits investors with patience and a long-term vision.
5. Momentum Trading Strategy
Momentum traders aim to capture profits by trading stocks or assets showing strong price movement in one direction with high volume. The idea is to “ride the wave” of momentum until signs of reversal appear.
Key Features:
Focus on assets with strong trend and volume.
Technical indicators like RSI, MACD, and moving averages are crucial.
Entry often occurs after a breakout from key levels.
Advantages:
Can generate large profits in trending markets.
Simple concept based on market psychology.
Disadvantages:
Reversal risk: momentum can fade suddenly.
Requires strict stop-loss management.
Momentum trading is effective in volatile markets where price trends are strong and sustained.
6. Breakout Trading Strategy
Breakout trading focuses on entering trades when price breaks through a predefined support or resistance level with strong volume. The idea is that once a key level is broken, price tends to continue moving in that direction.
Key Features:
Entry upon confirmed breakout (above resistance or below support).
Stop-loss often placed near the breakout point.
Works well in trending markets.
Advantages:
Early entry in new trends.
High reward potential when breakouts are strong.
Disadvantages:
False breakouts can lead to losses.
Requires confirmation with volume and momentum indicators.
Breakout traders often use chart patterns such as triangles, flags, or rectangles to identify setups.
7. Mean Reversion Strategy
The mean reversion concept assumes that prices will eventually revert to their historical average or “mean.” Traders look for assets that have deviated significantly from their average and place trades expecting a correction.
Key Tools:
Bollinger Bands
Moving Averages
Z-score or Standard Deviation
Example:
If a stock trades far above its average price, a trader might short it expecting a pullback; if it’s below average, they might go long.
Advantages:
Works well in range-bound markets.
Statistically driven and often systematic.
Disadvantages:
Ineffective during strong trending periods.
Risk of extended deviations before mean reversion happens.
Mean reversion is popular in algorithmic and quantitative trading systems.
8. Arbitrage Strategy
Arbitrage trading exploits price differences of the same or related assets across different markets or platforms. It involves buying an asset at a lower price in one market and selling it at a higher price in another.
Types of Arbitrage:
Spatial arbitrage: Same asset on different exchanges.
Statistical arbitrage: Price inefficiencies identified through algorithms.
Merger arbitrage: Trading based on corporate event outcomes.
Advantages:
Low risk when executed properly.
Often provides consistent, small profits.
Disadvantages:
Requires large capital and fast execution systems.
Opportunities are short-lived due to market efficiency.
Arbitrage is mostly used by institutional and algorithmic traders.
9. Algorithmic (Algo) Trading Strategy
Algorithmic trading uses computer programs to execute trades automatically based on pre-defined rules and market conditions. It eliminates emotional bias and can process vast amounts of data quickly.
Key Aspects:
Quantitative models and statistical analysis.
Uses technical indicators, price action, and AI-based decision systems.
Can include high-frequency trading (HFT).
Advantages:
Precision and speed.
Emotion-free and backtestable strategies.
Disadvantages:
Requires programming knowledge and infrastructure.
High risk of system errors or overfitting.
Algo trading dominates institutional markets and is increasingly popular among advanced retail traders.
10. News-Based or Event-Driven Trading Strategy
News-based traders take advantage of volatility caused by economic releases, earnings reports, or geopolitical events. They analyze how markets react to new information and place trades accordingly.
Examples of Events:
Central bank rate decisions.
Corporate earnings announcements.
Political elections or wars.
Advantages:
High volatility offers quick profit opportunities.
Based on real-time data rather than chart patterns.
Disadvantages:
Extremely risky due to unpredictability.
Slippage and widening spreads can occur during volatile events.
This strategy requires sharp analytical skills and real-time information access.
Conclusion
Each trading strategy has its own risk, reward potential, and time commitment. Scalping and day trading suit active traders seeking quick profits, while swing and position trading cater to those preferring a more relaxed pace. Momentum and breakout strategies thrive in trending markets, while mean reversion and arbitrage strategies work in stable or range-bound conditions.
The key to successful trading lies not in using the most popular strategy, but in finding one that fits your personality, capital, time, and risk appetite. Consistent discipline, risk management, and continuous learning form the foundation of every profitable trading strategy.
Top Big Tech Stocks Leading the Rebound1. Understanding the Big Tech Rebound
The Big Tech rebound can be attributed to a mix of macroeconomic stability, improving corporate earnings, and renewed investor appetite for growth-oriented stocks. Over the past year, inflation has started cooling, and the U.S. Federal Reserve has signaled a pause or potential cuts in interest rates, which directly benefits technology stocks. Lower interest rates make future earnings more attractive in discounted cash flow models, leading investors to reallocate funds toward growth sectors like technology.
Moreover, strong quarterly earnings and improved forward guidance from top tech firms have reinforced faith in their long-term profitability. The adoption of Artificial Intelligence (AI), cloud computing, and digital transformation across industries has provided these companies with new growth engines that extend beyond their traditional business models.
2. Key Factors Fueling the Rally
Several fundamental and structural factors are driving the Big Tech rebound:
Artificial Intelligence Boom:
AI remains the central growth story. Companies integrating AI tools into their ecosystems — from data analytics to automation — are seeing exponential growth in demand. Nvidia’s dominance in AI chips and Microsoft’s integration of AI into its software suite are prime examples.
Easing Interest Rate Pressure:
With inflation moderating, investors expect the U.S. Federal Reserve to adopt a less aggressive stance on rate hikes. This environment favors high-growth tech firms, as it lowers borrowing costs and supports capital investments.
Resilient Earnings Performance:
Despite macro challenges, Big Tech firms have maintained strong profit margins through cost optimization, efficient operations, and diversification of revenue streams.
Massive Cash Reserves and Buybacks:
Big Tech companies hold enormous cash reserves, allowing them to fund innovation, make acquisitions, and repurchase shares — all of which support stock prices.
Digital Transformation Trends:
Enterprises worldwide continue to migrate to cloud-based systems and AI-enhanced tools, reinforcing demand for services offered by Big Tech leaders.
3. Top Big Tech Stocks Leading the Rebound
Let’s explore the key players spearheading this resurgence:
a. Apple Inc. (AAPL)
Apple remains a cornerstone of the global technology market. Despite slower iPhone sales in certain regions, the company’s growing ecosystem of services — including Apple Music, iCloud, and Apple TV+ — has provided stable recurring revenue. The tech giant is also expanding into wearable devices and exploring opportunities in AI and mixed reality through its Vision Pro headset.
Apple’s share repurchase programs and strong brand loyalty continue to attract investors seeking stability and consistent returns. As supply chains normalize and product innovation continues, Apple’s long-term growth outlook remains robust.
b. Microsoft Corporation (MSFT)
Microsoft is arguably the biggest beneficiary of the AI revolution. Through its partnership with OpenAI, Microsoft has embedded AI capabilities into its Office 365 and Azure Cloud platforms, transforming productivity tools and enterprise software. Azure continues to be a major growth driver, accounting for a significant portion of revenue expansion.
The company’s diversification — spanning gaming (Xbox and Activision Blizzard acquisition), enterprise software, and AI-driven applications — provides resilience against economic cycles. Microsoft’s consistent earnings growth and forward-looking AI strategy have made it a market leader in the current rebound.
c. Alphabet Inc. (GOOGL)
Alphabet, Google’s parent company, has also staged a strong comeback. Its core advertising business, powered by YouTube and Search, remains highly profitable, while its Google Cloud segment continues to grow rapidly. The company is leveraging AI to enhance ad efficiency, content moderation, and user personalization.
Alphabet’s AI model, Gemini, positions it as a key player in the race for generative AI dominance. Additionally, Alphabet’s investments in autonomous driving (Waymo) and quantum computing illustrate its long-term innovation strategy.
d. Amazon.com Inc. (AMZN)
Amazon has rebounded strongly on the back of its cloud computing arm, Amazon Web Services (AWS), which remains a market leader. The company’s focus on cost optimization and automation has improved profit margins across its e-commerce operations. Amazon’s AI integration — from logistics and inventory management to Alexa’s generative capabilities — underscores its adaptability.
Additionally, Amazon’s ventures into advertising and streaming (Prime Video) provide new avenues for revenue growth. With the company returning to strong earnings growth, investors see Amazon as a key pillar of the Big Tech rally.
e. Nvidia Corporation (NVDA)
No discussion of the Big Tech rebound is complete without Nvidia. As the world’s leading designer of AI chips and GPUs, Nvidia is the driving force behind the current AI revolution. Its chips power data centers, machine learning models, and autonomous systems globally.
Nvidia’s market capitalization has skyrocketed as demand for AI accelerators from companies like Microsoft, Meta, and Amazon continues to soar. With expanding product lines and leadership in semiconductor innovation, Nvidia is arguably the biggest winner of the current tech boom.
f. Meta Platforms Inc. (META)
Meta has undergone a remarkable transformation. After facing challenges related to advertising slowdown and regulatory scrutiny, the company refocused its strategy under the “Year of Efficiency” initiative. Cost reductions, AI-driven advertising tools, and enhanced engagement on platforms like Instagram and Threads have reignited investor confidence.
While Meta continues to invest heavily in the metaverse and augmented reality, its near-term growth is largely driven by AI-powered ad targeting and short-form video content. The company’s improved margins and strategic execution have made it one of the best-performing Big Tech stocks this year.
g. Tesla Inc. (TSLA)
Tesla’s inclusion in the Big Tech narrative reflects its position at the intersection of technology and mobility. The company’s leadership in electric vehicles (EVs) and advancements in autonomous driving and AI-based energy solutions have made it a market disruptor.
Despite facing margin pressures due to global EV competition, Tesla’s focus on innovation, cost reduction, and energy storage diversification keeps it a critical component of the tech-driven growth story. With new product lines and expansion into energy grids, Tesla remains a vital part of the rebound theme.
4. Broader Market Impact
The Big Tech rally has far-reaching implications. These companies collectively represent over 25% of the S&P 500’s market capitalization, meaning their performance significantly influences the overall index movement. The rebound has restored investor confidence, leading to capital inflows not only into tech ETFs but also into sectors that benefit indirectly — such as semiconductors, software, and digital infrastructure.
Furthermore, global markets are mirroring the U.S. trend, with Asian and European tech firms also witnessing renewed demand as investors bet on the global AI and digitalization wave.
5. Risks and Considerations
While the Big Tech rebound is promising, investors should remain mindful of potential risks:
Regulatory Challenges: Governments worldwide are tightening scrutiny on data privacy, competition, and AI ethics.
Valuation Concerns: Elevated valuations may lead to volatility if earnings growth slows.
Global Supply Chain Risks: Semiconductor supply constraints and geopolitical tensions can impact operations.
Economic Slowdowns: Any resurgence in inflation or aggressive rate hikes could dampen tech valuations.
6. Conclusion
The rebound of Big Tech stocks marks a renewed era of innovation-driven growth. Companies like Microsoft, Nvidia, Apple, Amazon, and Alphabet are not just bouncing back — they are leading the world into the next phase of technological evolution powered by AI, cloud computing, and digital ecosystems.
For investors and learners alike, this rebound offers an important lesson: long-term technological innovation tends to prevail over short-term market fluctuations. As Big Tech continues to shape industries, drive productivity, and redefine the global economy, their leadership in this market rebound underscores their enduring influence in the financial and technological landscape.

Global Cues & GIFT Nifty TradingIntroduction
In today’s interconnected financial ecosystem, no market operates in isolation. Global economic events, central bank policies, geopolitical tensions, and market trends from the U.S., Europe, and Asia all influence trading sentiment in India. This interconnectedness is what we call “global cues.” Traders closely watch these cues to anticipate how the GIFT Nifty (formerly SGX Nifty) and the Indian stock markets might open or behave during the trading day.
GIFT Nifty serves as a key pre-market indicator for the Indian equity market, offering traders a glimpse into potential market direction even before the domestic markets open. Let’s explore how global cues interact with GIFT Nifty trading and shape the overall sentiment in India’s financial markets.
What Are Global Cues?
Global cues refer to signals or influences originating from international markets that impact domestic trading behavior. These cues include movements in:
Major Global Indices like the Dow Jones, S&P 500, NASDAQ, FTSE 100, Nikkei 225, Hang Seng, and DAX.
Commodity Prices, such as crude oil, gold, and base metals.
Currency Movements, particularly USD/INR, EUR/USD, and other major pairs.
Bond Yields and global interest rates.
Macroeconomic Data, including inflation, GDP growth, and employment figures from key economies.
Geopolitical Events, such as wars, sanctions, trade agreements, or political instability.
These global indicators collectively affect investor confidence, risk appetite, and capital flows — which ultimately influence Indian markets and the GIFT Nifty.
Understanding GIFT Nifty
GIFT Nifty, officially known as GIFT Nifty 50 Futures, is traded on the NSE International Exchange (NSE IX), located in the GIFT City (Gujarat International Finance Tec-City) in India. It replaced the SGX Nifty (Singapore Exchange Nifty), which was previously traded in Singapore until 2023.
The transition to GIFT Nifty marked India’s effort to bring offshore Nifty trading back within its borders, giving Indian regulators more control and transparency over derivatives linked to Indian markets.
Key features of GIFT Nifty:
Traded almost 21 hours a day, bridging Asian, European, and U.S. time zones.
Denominated in U.S. dollars, attracting foreign institutional participation.
Tracks the performance of the Nifty 50 index, India’s leading stock market benchmark.
Serves as a pre-market indicator for the direction of the Indian equity market.
Because GIFT Nifty trades while Indian markets are closed, its price movement gives traders an idea of how the Indian stock market may open the next morning.
The Role of Global Cues in GIFT Nifty Movements
GIFT Nifty is highly sensitive to global cues due to its extended trading hours overlapping with international markets. Here’s how global factors typically influence its performance:
1. U.S. Market Performance
The U.S. markets, especially indices like Dow Jones, S&P 500, and NASDAQ, play a dominant role in setting global risk sentiment. A strong rally on Wall Street often leads to bullish sentiment in Asian markets and GIFT Nifty, whereas a sharp decline usually results in bearish trends.
For instance, if the NASDAQ closes higher due to strong tech earnings, GIFT Nifty futures may rise overnight, hinting at a positive start for Indian markets.
2. Asian Market Trends
Since GIFT Nifty overlaps with Asian trading hours, performance in indices like Nikkei 225 (Japan), Hang Seng (Hong Kong), and Shanghai Composite (China) can significantly impact it. Weak Chinese data or yen fluctuations can trigger risk aversion across Asian equities, pulling down GIFT Nifty as well.
3. Crude Oil Prices
India is a major importer of crude oil. Rising oil prices increase India’s import bill, widen the current account deficit, and can fuel inflation—all negatives for the Indian economy. As a result, higher oil prices often pressure GIFT Nifty and the Indian rupee. Conversely, a sharp fall in oil prices tends to boost GIFT Nifty sentiment.
4. Currency Movements (USD/INR)
A weakening Indian rupee against the U.S. dollar usually signals foreign outflows and inflationary pressure, which dampen investor sentiment. GIFT Nifty tends to fall in such scenarios. On the other hand, a strengthening rupee supports positive sentiment and may lift GIFT Nifty.
5. U.S. Federal Reserve and Global Interest Rates
The Federal Reserve’s monetary policy decisions are closely tracked worldwide. Any hint of rate hikes or hawkish tone increases global risk aversion, leading to sell-offs in equities and a drop in GIFT Nifty. Conversely, dovish policies (rate cuts or liquidity support) boost risk-taking and lift markets globally.
6. Geopolitical Developments
Geopolitical events such as wars, trade conflicts, or sanctions can cause market volatility. For example, the Russia-Ukraine war initially led to a spike in oil prices and a global risk-off sentiment, dragging GIFT Nifty lower. Similarly, easing geopolitical tensions can trigger recovery rallies.
How Traders Use Global Cues in GIFT Nifty Trading
GIFT Nifty traders often analyze global cues to predict short-term price action and hedge positions in Indian equities. Some common strategies include:
Pre-Market Direction Prediction:
Traders track U.S. and European market closings to gauge where GIFT Nifty may open. This helps in planning trades for the Indian session.
Arbitrage Opportunities:
Since GIFT Nifty trades almost round-the-clock, traders exploit price differences between GIFT Nifty and NSE Nifty futures when domestic markets open.
Hedging FII Exposure:
Foreign institutional investors (FIIs) use GIFT Nifty to hedge their positions in Indian equities based on global risk factors.
Event-Based Trading:
Key global events like U.S. CPI data, Federal Reserve meetings, or OPEC announcements can trigger quick GIFT Nifty reactions. Traders position themselves accordingly before these announcements.
Example: How Global Cues Drive GIFT Nifty
Imagine this scenario:
The Dow Jones surges by 2% overnight on strong U.S. GDP data.
Brent crude drops below $80/barrel, easing inflation fears.
Asian markets open positive.
Result: GIFT Nifty futures jump 100–150 points, signaling a bullish opening for Indian markets the next morning.
In contrast, if:
U.S. bond yields rise sharply,
Crude oil climbs to $95/barrel, and
China reports weak factory data,
GIFT Nifty might fall 150–200 points, reflecting bearish sentiment before the Indian market opens.
Impact of Global Cues on Domestic Market Opening
Because GIFT Nifty trades overnight, it directly influences pre-market sentiment in India. News anchors and analysts frequently refer to “GIFT Nifty indicates a positive/negative start for the Indian markets.”
For example:
If GIFT Nifty is trading 100 points higher, it indicates a likely gap-up opening for Nifty 50.
If it’s 150 points lower, a gap-down opening can be expected.
This helps traders, especially intraday and short-term players, plan their strategies before the NSE opens.
The Future of GIFT Nifty and Global Integration
GIFT Nifty has strengthened India’s position in the global financial ecosystem. With extended trading hours and growing foreign participation, it acts as a bridge between Indian and international investors. As more global funds use GIFT Nifty for exposure to Indian markets, liquidity and volume are expected to rise.
Additionally, the establishment of GIFT City as a global financial hub aligns with India’s vision of becoming a major player in international finance. Over time, more derivative products linked to Indian indices and sectors may be introduced in GIFT City, further deepening market integration.
Conclusion
Global cues and GIFT Nifty trading are tightly interlinked, forming a vital part of India’s financial market ecosystem. Global economic data, geopolitical developments, commodity prices, and central bank policies directly impact GIFT Nifty’s movement — which, in turn, serves as a real-time barometer for the next day’s market sentiment in India.
For traders, understanding these relationships is essential. Those who effectively analyze global cues can make informed trading decisions, manage risk better, and anticipate market direction with greater accuracy. In essence, GIFT Nifty is not just a derivative product — it is India’s window to the world of global finance.

Market Structure and Price Action1. Introduction
In trading, understanding market structure and price action is like learning the grammar and vocabulary of the market’s language. Market structure defines the overall framework of how prices move — the trend, swing highs and lows, and turning points. Price action, on the other hand, tells the story of how buyers and sellers interact within that structure. Together, they form the foundation of technical trading and are essential for making informed decisions without relying solely on indicators.
2. What Is Market Structure?
Market structure is the framework that shows how price behaves over time. It represents the sequence of highs and lows that reveal whether a market is trending upward, downward, or moving sideways.
At its core, market structure is built on three phases:
Uptrend (Bullish Structure):
Characterized by Higher Highs (HH) and Higher Lows (HL).
Each swing high surpasses the previous one, and each retracement forms a higher low, showing strong buying pressure.
Downtrend (Bearish Structure):
Characterized by Lower Highs (LH) and Lower Lows (LL).
Prices fail to make new highs, and sellers dominate, pushing the market downward.
Range (Consolidation):
Occurs when price moves sideways within a fixed zone of support and resistance.
Buyers and sellers are in balance, often leading to accumulation or distribution before a breakout.
3. Phases of Market Structure
Markets typically move through repeating cycles. Understanding these helps traders anticipate potential trend reversals.
A. Accumulation Phase
Happens after a downtrend when price begins to stabilize.
Institutional traders start buying gradually without causing big price spikes.
Price moves sideways, forming a base or range.
Volume often increases slightly during this phase.
B. Mark-Up Phase
The market breaks above resistance, confirming an uptrend.
Retail traders begin to notice the strength, and buying accelerates.
Higher highs and higher lows form clearly.
Corrections are shallow as demand outweighs supply.
C. Distribution Phase
After a strong uptrend, large players start offloading positions.
Price forms a top or range — similar to accumulation but at higher levels.
Market shows exhaustion; volume may decline.
Often followed by a breakdown below support.
D. Mark-Down Phase
Price breaks below key support levels.
Sellers take control, leading to lower highs and lower lows.
Panic selling and bearish sentiment dominate.
The phase often ends when buyers start reaccumulating again — completing the cycle.
4. How to Identify Market Structure
To read market structure effectively:
Identify swing highs and swing lows.
Label the structure: HH, HL (uptrend) or LH, LL (downtrend).
Mark key zones: support, resistance, and break of structure (BOS).
Look for structural shifts: When a higher low breaks below a previous low, it signals a potential reversal.
Example:
If the market has been forming HH and HL but suddenly forms a Lower Low (LL) followed by a Lower High (LH) — that’s a shift in market structure from bullish to bearish.
5. What Is Price Action?
Price action is the study of price movement on a chart without using lagging indicators. It shows how market participants react to various price levels in real time.
Traders use candlestick patterns, support-resistance zones, and trendlines to interpret price action and anticipate future movement.
In essence, price action reflects market psychology — how greed, fear, and expectations manifest in price.
6. Key Elements of Price Action
A. Candlestick Behavior
Candlestick charts are the foundation of price action analysis.
Each candle shows the battle between buyers and sellers in a given period:
Bullish Candle: Buyers are stronger (close > open).
Bearish Candle: Sellers are stronger (close < open).
Important candle signals:
Pin Bar / Hammer: Reversal signal showing rejection of lower prices.
Engulfing Candle: Strong reversal sign where one candle engulfs the previous one.
Doji: Indecision or potential reversal area.
B. Support and Resistance
Price tends to react repeatedly at certain zones:
Support: A level where demand pushes prices up.
Resistance: A level where supply pushes prices down.
Price action traders look for breakouts, retests, and false breaks around these levels to find trade entries.
C. Trendlines and Channels
Drawing trendlines connecting swing highs or lows helps visualize structure.
A series of higher lows connected by a trendline confirms bullish control.
Similarly, parallel channels help identify overbought or oversold zones within a trend.
D. Market Rejection and Imbalance
When price moves sharply in one direction leaving a “gap” or imbalance, it signals strong institutional activity.
Traders often look for price to retrace to fill these imbalances before continuing the main trend.
7. Relationship Between Market Structure and Price Action
Price action and market structure are inseparable. Market structure provides the macro context — the overall direction — while price action gives the micro details for timing entries and exits.
For example:
In an uptrend, traders use price action to buy during pullbacks (at HLs).
In a downtrend, traders use price action to sell rallies (at LHs).
During range markets, price action helps identify breakouts or reversals at boundaries.
A price action setup has higher probability when it aligns with the market structure trend.
For instance, a bullish engulfing candle at a higher low within a bullish structure is more reliable than one forming randomly.
8. Tools and Techniques for Price Action Traders
Though price action trading avoids heavy indicators, some tools can enhance clarity:
Volume Profile: Reveals where most trading occurred — key areas of interest.
Order Blocks: Institutional zones where large orders were previously placed.
Fair Value Gaps (FVGs): Gaps showing inefficiency between buyers and sellers.
Liquidity Zones: Areas above highs or below lows where stop losses are accumulated.
These concepts, part of Smart Money Concepts (SMC), integrate price action with institutional market structure understanding.
9. Common Price Action Strategies
A. Break of Structure (BOS) Entry
When price breaks a previous high or low, traders wait for a retest to enter in the direction of the breakout.
B. Rejection from Key Zones
Look for reversal candlesticks (like pin bars) near support/resistance or order blocks.
C. Trend Continuation
After a pullback to a higher low (in an uptrend), wait for bullish confirmation candles to rejoin the trend.
D. Fakeout Strategy
When price briefly breaks support/resistance but fails to sustain, it traps traders and reverses sharply — an opportunity for contrarian entries.
10. The Psychology Behind Market Structure and Price Action
Every candle and structure shift represents the emotion of market participants.
Uptrends show confidence and optimism.
Downtrends reflect fear and panic.
Consolidations show indecision or accumulation.
Recognizing these emotional patterns helps traders align themselves with the smart money rather than reacting impulsively.
11. Importance for Traders
Mastering market structure and price action:
Eliminates dependence on lagging indicators.
Improves timing and accuracy of trades.
Provides clarity on trend direction and key zones.
Builds confidence through understanding why price moves.
Professional traders, institutional desks, and even algorithmic systems rely on structure and price movement — not random signals — because they reflect real market intent.
12. Conclusion
Market structure and price action form the core foundation of technical trading. Market structure shows the skeleton — the trend, phases, and key levels — while price action gives the heartbeat — how buyers and sellers interact within that framework.
By studying swing points, candlestick behavior, and the rhythm of higher highs and lows, traders can interpret the market’s language without confusion. Whether you trade intraday, swing, or positional setups, understanding structure and price action ensures you’re trading with the flow, not against it.
Part 9 Trading Master Class With Experts How Option Pricing Works
Option prices are determined by several factors, most notably:
Intrinsic Value – The real value if exercised today (difference between the current price and strike price).
Time Value – The additional amount traders are willing to pay due to the time left until expiration.
Volatility – Higher volatility means higher uncertainty, leading to higher premiums.
Interest Rates and Dividends – These also affect pricing but to a lesser degree.
The most popular model for calculating option prices is the Black-Scholes Model, which uses these variables to estimate fair value.

Tamilnad Mercantile Bank – 1D Chart | Strong Resistance Zone🟢 Tamilnad Mercantile Bank (TMB) – 1D Chart | Strong Resistance Zone Ahead
📊 Chart Setup:
TMB is testing its major 1-year resistance zone around ₹510, a key level that has capped price movements for months. A strong daily close above ₹510 could trigger momentum towards higher targets.
🔹 Resistance: ₹510 (Major 1-year resistance)
🔹 Targets on Breakout: ₹535 / ₹600
🔹 Supports: ₹466 / ₹440
🔹 View: Price consolidating near breakout zone. Sustained close above ₹510 can signal trend continuation.
🏦 Fundamental Update – Q2 FY26 Results Highlights:
Tamilnad Mercantile Bank delivered steady performance with profit growth and improved asset quality.
• Net Profit: ₹318 Cr ↑ (▲4.95% YoY)
• Total Business: ↑11.40%
• Deposits: ₹55,421 Cr ↑12.32%
• Advances: ↑10.5%
• Net Interest Income: ₹597 Cr ↑0.17%
• Gross NPA: ↓ to 1.01%
• Net NPA: ↓ to 0.26%
• Capital Adequacy Ratio (CAR): Strong at 30.96%
➡️ Stable performance, improving asset quality, and strong capital base add confidence to the technical setup.
📈 For educational purpose only. Not a buy/sell recommendation.

Supriya Lifescience Stock is showing rounding bottom formation on weekly time frame basis and trying to brake out 1 year range 640~840.
Immediate hurdles will be psychological 800 resistance and 840 previous high. Once its brake we can expect target of approx 900 /-
Volume is also supporting on weekly basis.
Momentum indicator RSI is above 60 showing positive strength.
Weekly candle support the above forming hammer formation.

Part 8 Trading Master Class With ExpertsTypes of Options Based on Exercise Style
Options can also differ based on when they can be exercised:
American Options: Can be exercised any time before expiry (used in U.S. markets).
European Options: Can only be exercised on the expiry date (common in India and Europe).
On Indian exchanges like NSE, most index and stock options are European-style.

Part 6 Learn Institutional Trading How Option Trading Works
When you trade options, there are two sides to every contract: the buyer and the seller.
Option Buyer: Pays the premium for the right to exercise the option. Their risk is limited to the premium paid but potential profit is unlimited (in calls) or substantial (in puts).
Option Seller (Writer): Receives the premium upfront but assumes an obligation if the buyer exercises the option. Their potential loss can be large, depending on market movement.
For example:
Let’s say stock XYZ is trading at ₹100.
You buy a call option with a strike price of ₹105, paying a premium of ₹3.
If XYZ rises to ₹115 before expiry, your profit = (115 – 105) – 3 = ₹7 per share.
If it stays below ₹105, your loss is limited to ₹3 (the premium paid).

Part 4 Learn Institutional Trading Key Terminology in Option Trading
To understand options, one must be familiar with some basic terms:
Underlying Asset: The instrument on which the option is based (e.g., stock, index, or commodity).
Strike Price: The price at which the option holder can buy (call) or sell (put) the asset.
Premium: The cost paid by the option buyer to acquire the contract.
Expiration Date: The date when the option contract becomes void.
In-the-Money (ITM): A call option is ITM when the underlying price is above the strike; a put is ITM when the price is below the strike.
Out-of-the-Money (OTM): The opposite of ITM. The call option has no intrinsic value when the price is below the strike; a put option has none when the price is above the strike.
At-the-Money (ATM): When the underlying price and strike price are nearly equal.
Intrinsic Value: The actual profit if the option were exercised immediately.
Time Value: The portion of the premium that reflects the probability of the option gaining value before expiry.

Part 3 Learn Institutional Trading What Are Options?
An option is a derivative contract whose value is derived from an underlying asset such as a stock, index, commodity, or currency. The buyer of an option pays a premium to the seller (also called the writer) for the right—but not the obligation—to execute the trade under specified terms.
There are two main types of options:
Call Option: Gives the buyer the right to buy the underlying asset at a fixed price (called the strike price) before or on the expiry date.
Put Option: Gives the buyer the right to sell the underlying asset at the strike price before or on the expiry date.
These contracts can be traded on exchanges (like NSE, BSE, CBOE) or over-the-counter (OTC).

GAIL 1 Hour Time Frame✅ Key Levels
Resistance zone: ~ ₹186-₹190 — the stock recently tried to challenge this region (see intraday high ~₹191 in some sessions).
Support zone: ~ ₹174-₹176 — the lower bound of recent trading range (Moneycontrol shows recent low ~₹174.64).
Intermediate pivot: ~ ₹180-₹182 — currently acting as the mid-zone / equilibrium in 1-hour structure.
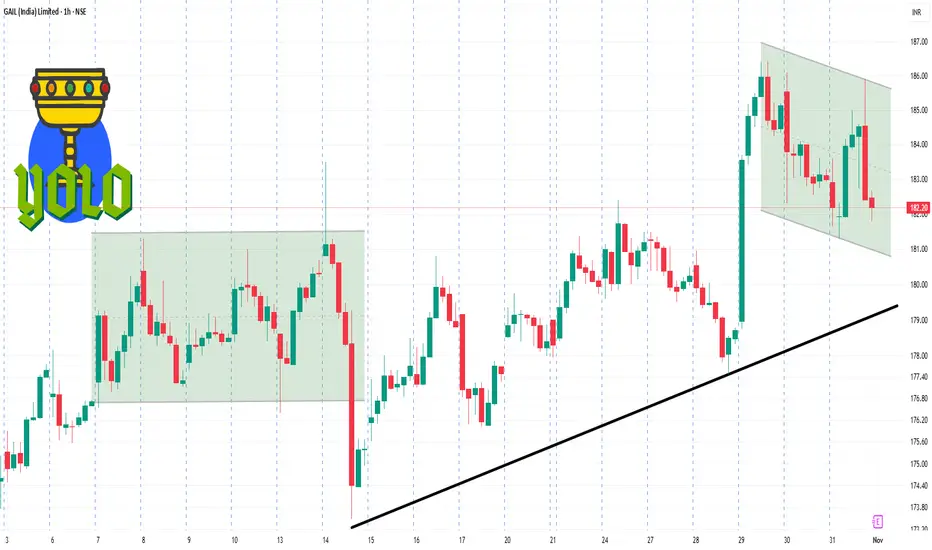
Intraday and Scalping Strategies: Mastering Short-Term Trading1. Introduction
In the fast-paced world of stock trading, two of the most active and adrenaline-filled approaches are intraday trading and scalping. These trading styles revolve around capturing small price movements within the same trading session—without holding positions overnight. Traders using these methods aim to exploit market volatility, volume spikes, and short-term trends to generate profits.
While both intraday and scalping share the same principle—quick trades—they differ in timeframes, position sizes, and profit expectations. Intraday traders hold positions for minutes to hours, while scalpers operate on a much shorter horizon, often seconds or a few minutes. Success in these methods requires discipline, technical analysis mastery, and a deep understanding of market structure and momentum.
2. Understanding Intraday Trading
Definition
Intraday trading, also known as day trading, involves buying and selling financial instruments—such as stocks, indices, commodities, or forex—within a single trading day. Traders aim to profit from short-term price fluctuations without carrying overnight risk.
Objective
The core objective of intraday trading is to capitalize on daily volatility. Traders focus on price action, news-driven moves, and liquidity zones to identify opportunities.
Timeframe
Intraday traders typically use charts ranging from 1-minute to 15-minute intervals for entries and exits, while analyzing higher timeframes like the 1-hour or 4-hour chart for overall trend direction.
3. The Mechanics of Intraday Trading
a. Market Selection
Intraday traders prefer stocks or instruments that have:
High liquidity (easy entry and exit)
Volatility (to create meaningful price movements)
Strong volume participation
For example, large-cap stocks, index futures (like NIFTY, BANK NIFTY), and active currency pairs (like EUR/USD) are common choices.
b. Time of Entry
The most volatile and profitable intraday periods are:
Opening hour (9:15–10:30 AM IST) – when overnight news is absorbed.
Closing hour (2:30–3:30 PM IST) – as institutional traders adjust their positions.
c. Leverage
Intraday traders often use margin trading, which magnifies both profits and risks. For instance, with 5x leverage, a 1% move can yield a 5% profit—or loss.
d. Tools and Indicators
Some of the most popular technical tools used by intraday traders include:
Moving Averages (MA): Identifying short-term trend direction.
VWAP (Volume Weighted Average Price): Used as an intraday benchmark.
MACD & RSI: Momentum indicators signaling strength or weakness.
Support and Resistance Levels: Key zones where price often reacts.
Volume Profile: To identify price levels with maximum trading activity.
4. Popular Intraday Trading Strategies
a. Momentum Trading
Momentum traders seek stocks that are moving strongly in one direction with high volume. The goal is to “ride the momentum” until signs of reversal appear.
Example:
If a stock breaks above a key resistance with high volume, a trader may buy with a stop-loss below the breakout level.
b. Breakout Trading
This strategy focuses on entering positions when the price breaks through well-defined support or resistance levels.
Entry: When price closes above resistance or below support.
Stop-loss: Just outside the breakout zone.
Target: Based on previous swing or risk-reward ratio (often 1:2).
c. Reversal Trading
Contrarian traders look for signs that a trend is about to reverse, such as:
Divergences in RSI or MACD
Candlestick reversal patterns (e.g., hammer, shooting star)
Volume exhaustion
d. Gap Trading
Traders exploit price gaps created by overnight news, earnings, or global cues. For example:
Gap-up open: Short if the stock fails to hold early gains.
Gap-down open: Buy if the price recovers with strong volume.
e. VWAP Strategy
The VWAP line acts as a fair value indicator for intraday traders.
Above VWAP: Indicates bullish bias.
Below VWAP: Indicates bearish bias.
Institutional traders often use VWAP to execute large orders efficiently.
5. Understanding Scalping
Definition
Scalping is the fastest form of trading, involving dozens—or even hundreds—of trades within a single session. Scalpers aim to capture tiny profits (5–10 paise or a few ticks) multiple times throughout the day.
Objective
The goal is to exploit micro-price movements and order flow inefficiencies. Scalpers rely on high liquidity and rapid execution rather than large price swings.
Timeframe
Scalpers operate in seconds to a few minutes. They rely heavily on 1-minute charts, tick charts, and order book depth for decision-making.
6. Key Principles of Scalping
a. Speed and Precision
Scalpers depend on fast execution and tight spreads. Even a few seconds of delay can turn a winning trade into a loss.
b. Small Targets, Strict Stops
A scalper might target 0.05–0.2% profit per trade with equally small stop-losses.
The focus is on high accuracy and consistency rather than big gains.
c. High Trade Frequency
Scalpers execute many trades in a session. For example, if a trader makes 50 trades with a ₹100 average profit, total profit = ₹5,000.
d. Leverage Usage
Because profits per trade are small, scalpers often use higher leverage—but this also magnifies risk.
e. Market Depth Analysis
Scalpers monitor Level II data (order book) to anticipate short-term imbalances in buying and selling pressure.
7. Popular Scalping Techniques
a. Bid-Ask Spread Scalping
Traders take advantage of the small difference between the bid and ask prices.
This method requires ultra-fast execution and often direct market access (DMA) platforms.
b. Moving Average Cross Scalping
Uses two short-term moving averages (e.g., 9 EMA and 21 EMA):
Buy signal: When shorter EMA crosses above longer EMA.
Sell signal: When it crosses below.
c. Price Action Scalping
Relies purely on candlestick patterns and support/resistance zones without indicators. Traders look for micro-trends or breakout candles for quick entries.
d. News-Based Scalping
During economic releases (like inflation data, RBI announcements, or Fed decisions), markets become volatile. Scalpers exploit rapid price moves right after such events.
e. Range Scalping
When markets move sideways, scalpers buy at the bottom of the range and sell near the top repeatedly—profiting from oscillations.
8. Tools and Platforms for Scalping and Intraday Trading
Both strategies demand real-time precision, so traders rely on:
Advanced charting platforms: TradingView, MetaTrader, ThinkorSwim, Zerodha Kite, etc.
Fast order execution: Brokers offering low-latency trading.
Level II data & market depth: To analyze liquidity zones.
Hotkeys and algorithms: For instant order placement.
High-speed internet and dual-screen setups are common among serious intraday traders.
9. Risk Management: The Heart of Short-Term Trading
Both intraday and scalping strategies can yield consistent returns—but only with strict risk control.
Key Rules:
Use Stop-Losses: Never trade without predefined exits.
Position Sizing: Risk only 1–2% of total capital per trade.
Avoid Overtrading: Stick to your setup; don’t chase losses.
Set Daily Limits: Stop trading after hitting max loss or profit goals.
Control Emotions: Greed and fear are the biggest threats in short-term trading.
Risk-Reward Example:
If your stop-loss is ₹2 and target is ₹4, you maintain a 1:2 ratio. Even with 50% accuracy, you remain profitable.
10. Psychology Behind Short-Term Trading
Scalping and intraday trading test a trader’s discipline and emotional control. Success depends not only on strategy but also on mindset:
Patience: Waiting for perfect setups.
Emotional neutrality: No excitement after wins or frustration after losses.
Focus: Constant screen time and attention to detail.
Adaptability: Changing tactics as market conditions shift.
A calm, rule-based approach outperforms impulsive decision-making every time.
11. Best Practices for Successful Execution
Start Small: Begin with small capital and low-risk trades.
Backtest Strategies: Analyze performance on historical data.
Journal Every Trade: Record reasons, outcomes, and emotions.
Avoid News Noise: Focus on technical levels, not random headlines.
Improve Continuously: Refine setups based on win-rate analysis.
12. Combining Scalping and Intraday Approaches
Some professional traders blend both:
Use scalping during volatile periods (opening or news hours).
Use intraday swing trades during calmer, trend-driven phases.
This hybrid model balances frequency and profitability—allowing flexibility based on volatility and market mood.
Conclusion
Intraday and scalping strategies offer exciting opportunities to profit from short-term market movements. They demand speed, discipline, and sharp technical skills. Unlike long-term investing, where time cushions errors, intraday and scalping reward precision and risk management.
The secret to mastering these techniques lies not in trading more, but in trading smart—with a consistent plan, strict stops, and psychological balance. For those willing to put in the effort, the art of short-term trading can become both a profitable skill and a professional edge.