Part 3 Technical Analysis VS. Institutional Trading Hedging Using Options
Hedging protects your capital.
Example:
You hold ₹10 lakh worth of Nifty stocks.
You can buy PE options to protect your portfolio from a fall.
This is why options were originally created—not for speculation, but for risk management.
Trendlineanalysis

Part 2 Candle Stick Patterns Strategies in Options Trading
Investors have a wide range of option trading methods at their disposal. Here are the most often-used option trading methods:
Covered Call Technique
In this somewhat cautious strategy, an investor purchases a stock and afterwards sells the call option for a profit. The investor can keep the additional gains if the share price increases.
Bull Spread
The bull call spread approach entails the purchase and sale of call options with various strike prices. The investor might potentially profit from the difference between the two options by purchasing the one with a lower strike price for a cheaper price.
Long Put Approach
The investor purchases a put option. The investor can earn from the difference in the prices of stocks at the time of buying and selling the options contract. Even if the stock price declines, the options holder has the right to sell the asset at the price prevailing at the time of purchase.
Iron Condor Approach
This sophisticated strategy entails the simultaneous purchase and sale of both put and call options having various strike prices by the investor. The investor can earn when the stock price remains inside the band of the strike price. Learn more about the PCR ratio and how it can help you trade stocks at Share India.

Part 1 Candle Sticck Patterns Types of Options
There are basically two types of options; Call and Put.
Call: Call options give the buyer the right to buy an asset at a specific price on a fixed date.
Put: Put options give the buyer the right to sell an asset at a predetermined price. Similar to call options, Put options also have a certain expiration date.
To buy both calls and puts, the investors must pay a fee called the premium to the option seller.

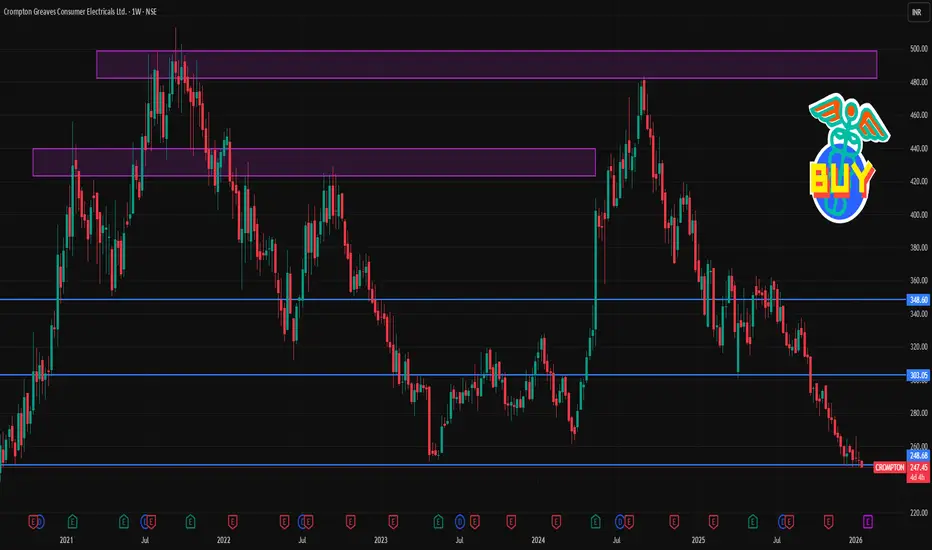
CROMPTON 1 Week Timw Frame 📊 Current Price Snapshot (Recent Close)
📌 Last traded price: ~₹251–₹255 range (as per latest market data).
📈 Key 1‑Week Technical Levels (Support & Resistance)
🔻 Support Levels — Where Buyers May Step In
Immediate support: ~₹248–₹252 (current level area)
Secondary support: ~₹245–₹247 (short‑term downside buffer)
Lower support: ~₹241–₹242 (deeper short‑term demand zone)
➡️ If price stays above ~₹248, short‑term weakness may stabilize.
🔺 Resistance Levels — Where Selling Might Appear
R1 (first resistance): ~₹255–₹256 (near immediate intraday hurdle)
R2 (next resistance): ~₹259–₹260 (near short‑term pivot barrier)
R3 (higher resistance): ~₹262–₹263 (short‑term rally target on strength)
➡️ A breakout above ~₹259–₹260 with volume could signal a short‑term bounce.
📅 1‑Week Scenario Outlook
➡️ Bearish scenario (higher probability given current momentum):
Price remains below ₹259–₹260 resistance → likely to trade lower toward ₹245 and possibly at ₹241–₹242 zone.
➡️ Bullish reversal setup (requires catalyst):
Price breaks and sustains above ₹259–₹260 with decent volume → could see rally toward ₹262+ within week.
⚠️ Important Notes
This is a technical perspective only (not investment advice).
Price movements can change rapidly with market news, volumes, and macro catalysts.
Use stop‑loss and risk management if planning any trades.
HAL 1 Week Time Frame 📌 Current Approximate Price
HAL’s latest price is around ₹4,440 – ₹4,480 on NSE (varies with live market moves).
📊 Weekly Technical Levels (1‑Week View)
📈 Resistance Levels (Upside)
These are levels where price may struggle to break above on the weekly timeframe:
R1 (Immediate): ~₹4,500 – ₹4,550 — first resistance zone.
R2 (Medium): ~₹4,540 – ₹4,580 — next resistance cluster.
R3 (Bullish / extended): ~₹4,580 – ₹4,670 — higher resistance if buyers take control.
Key breakout barrier to watch: sustaining above ₹4,580–₹4,600 may strengthen bullish bias for the week.
📉 Support Levels (Downside)
These are levels where price may find buying interest if it declines:
S1 (Immediate): ~₹4,420 – ₹4,380 — first support for this week.
S2 (Secondary): ~₹4,380 – ₹4,340 — deeper support if sellers push lower.
S3 (Lower): ~₹4,340 – ₹4,300 — key demand zone historically.
Key downside pivot: break below ~₹4,380 could extend selling into the ₹4,300 area.
📐 Weekly Pivot Reference
Pivot Point: ~₹4,460 – ₹4,470 — midpoint reference level for direction bias.
Above this pivot → bullish bias
Below this pivot → bearish/neutral bias
📝 Summary Weekly Levels Table
Level Price Zone
🟥 R3 ~₹4,580 – ₹4,670
🟧 R2 ~₹4,540 – ₹4,580
🟨 R1 ~₹4,500 – ₹4,550
⚪ Pivot ~₹4,460 – ₹4,470
🟦 S1 ~₹4,420 – ₹4,380
🟩 S2 ~₹4,380 – ₹4,340
🟪 S3 ~₹4,340 – ₹4,300

Earnings Season Trading: Opportunities, Risks, and StrategiesWhat Is Earnings Season and Why It Matters
Earnings season typically occurs four times a year, following the end of each financial quarter. In India, major earnings seasons usually unfold in April, July, October, and January. During this period, companies announce their financial performance, including earnings per share (EPS), revenue, margins, debt levels, and management commentary. Markets react not only to whether results are good or bad, but also to how they compare with expectations already priced into the stock.
Stock prices are forward-looking. This means a company can report strong earnings and still see its share price fall if results fail to meet market expectations. Conversely, a company with weak numbers may rally if the outcome is “less bad” than anticipated or if guidance improves. This expectation-versus-reality dynamic makes earnings season particularly powerful for short-term traders.
Volatility: The Core Feature of Earnings Trading
The defining characteristic of earnings season trading is volatility. Stocks often experience sharp price gaps on the day results are announced, especially if the earnings surprise is significant. These gaps can occur upward or downward and may range from a few percent to double-digit moves in extreme cases. For intraday traders, this volatility creates momentum-based opportunities, while swing traders look to capture post-earnings trends that may last days or weeks.
However, volatility cuts both ways. Sudden adverse moves can trigger stop-losses or cause significant losses if risk is not controlled. Therefore, earnings trading demands disciplined position sizing, predefined exit strategies, and an understanding that outcomes can be unpredictable.
Earnings Expectations and Market Psychology
A critical element of earnings season trading is market psychology. Analysts issue earnings estimates well in advance, and these numbers shape investor expectations. Traders closely monitor consensus EPS, revenue forecasts, and “whisper numbers” circulating in the market. The stock’s price movement before earnings often reflects these expectations, with rallies signaling optimism and declines indicating caution.
During earnings season, traders focus on three major aspects: actual results, comparison with estimates, and management guidance. Among these, guidance often has the strongest influence because it affects future valuations. A company beating estimates but lowering future guidance may still face selling pressure, while a modest miss combined with strong forward outlook can trigger buying interest.
Common Earnings Season Trading Strategies
Several strategies are commonly used during earnings season. One approach is pre-earnings momentum trading, where traders ride the price trend leading up to the results, exiting positions before the announcement to avoid uncertainty. This strategy benefits from speculation and anticipation but avoids overnight risk.
Another method is post-earnings reaction trading, where traders wait for results and then trade based on the market’s reaction. This reduces uncertainty and allows traders to align with confirmed momentum, though the initial move may already be partially priced in.
Derivative traders often use options-based strategies such as straddles, strangles, or spreads to benefit from volatility rather than direction. These strategies aim to profit from large price swings regardless of whether the stock moves up or down, but they require a solid understanding of implied volatility and option pricing.
Sector and Index-Level Impact
Earnings season does not affect all stocks equally. Heavyweight companies in sectors like banking, IT, FMCG, and metals can significantly influence broader indices such as the Nifty 50 or Sensex. Strong results from large banks or IT firms can lift the entire market, while disappointments can drag indices lower even if other stocks perform well.
Traders often analyze sector-wide earnings trends to identify leadership or weakness. For example, if multiple companies in a sector report margin expansion and strong demand, traders may adopt bullish positions across that sector. Conversely, widespread earnings downgrades may signal structural issues, prompting defensive or short-selling strategies.
Risk Management During Earnings Season
Risk management is especially important during earnings season trading. Price gaps can bypass stop-loss orders, leading to slippage. To manage this, traders often reduce position sizes, avoid holding leveraged positions overnight, or hedge exposure using options. Clear risk-reward ratios and strict discipline help protect capital during unpredictable market reactions.
Another important practice is avoiding overtrading. The abundance of opportunities during earnings season can tempt traders to take excessive positions. Successful traders focus on high-quality setups rather than chasing every earnings announcement.
Long-Term Perspective vs Short-Term Trading
While earnings season is popular among short-term traders, long-term investors also use this period to reassess portfolio holdings. Consistent earnings growth, improving margins, and strong guidance reinforce long-term investment theses. For traders, understanding this long-term context helps interpret short-term price movements more accurately.
A stock that corrects sharply after earnings may offer opportunities if the long-term fundamentals remain intact. Conversely, a sharp rally driven purely by short-term enthusiasm may fade if earnings quality is weak.
Conclusion
Earnings season trading is a powerful but demanding aspect of the stock market. It offers unique opportunities driven by volatility, expectations, and market psychology, but it also carries heightened risks. Successful earnings traders combine fundamental understanding with technical analysis, focus on expectations rather than headlines, and practice strict risk management. Whether trading stocks, indices, or derivatives, mastering earnings season dynamics can significantly enhance a trader’s ability to navigate markets with confidence and discipline.

Quantitative Trading The Science of Data-Driven Financial MarketCore Concept of Quantitative Trading
At its core, quantitative trading is built on the belief that market behavior follows identifiable patterns that can be measured, modeled, and exploited. Quant traders collect vast amounts of historical and real-time market data—such as price movements, volume, volatility, interest rates, and macroeconomic indicators—and apply mathematical techniques to uncover statistically significant relationships. These insights are then converted into precise trading rules that computers can execute automatically.
The goal is not to predict markets with certainty, but to gain a probabilistic edge. Even a small statistical advantage, when applied consistently across many trades, can lead to meaningful long-term profitability.
Key Components of Quantitative Trading
Quantitative trading systems typically consist of several interlinked components. First is data acquisition, where clean, high-quality data is gathered from exchanges, economic reports, and alternative sources such as satellite data or social media sentiment. Second is model development, where traders use mathematics, statistics, and machine learning to design strategies. These models may focus on trends, mean reversion, arbitrage, or volatility patterns.
Next comes backtesting, a critical step in which strategies are tested against historical data to evaluate performance, risk, and robustness. Finally, execution and risk management ensure that trades are placed efficiently while controlling losses through position sizing, stop-loss rules, and portfolio diversification.
Common Quantitative Trading Strategies
Several well-known strategies form the foundation of quantitative trading. Trend-following strategies aim to capture sustained market movements by identifying upward or downward momentum. Mean reversion strategies assume that prices tend to return to their historical averages after extreme movements. Statistical arbitrage seeks to exploit temporary price discrepancies between related securities, often across stocks, futures, or ETFs.
Another important category is high-frequency trading (HFT), which uses ultra-fast algorithms to execute large numbers of trades within milliseconds, profiting from small price inefficiencies. Factor-based investing, commonly used by hedge funds and asset managers, ranks securities based on factors such as value, momentum, quality, and low volatility.
Role of Technology and Algorithms
Technology is the backbone of quantitative trading. Powerful computers process massive datasets, while programming languages such as Python, R, and C++ are used to build and deploy models. Machine learning and artificial intelligence have further expanded the scope of quant trading by enabling systems to adapt, learn from new data, and improve performance over time.
Algorithmic execution minimizes transaction costs by intelligently splitting large orders and timing trades to reduce market impact. As markets become more competitive, speed, efficiency, and technological sophistication often determine success.
Risk Management in Quantitative Trading
Risk management is just as important as strategy design. Quantitative traders focus on controlling downside risk through diversification, volatility targeting, and strict drawdown limits. Since quant strategies often rely on historical relationships, unexpected market events—such as financial crises or geopolitical shocks—can cause models to fail. Robust risk frameworks help mitigate these risks by limiting exposure and adapting to changing market conditions.
Stress testing and scenario analysis are widely used to evaluate how strategies might perform under extreme conditions. This disciplined approach helps protect capital and ensures long-term sustainability.
Advantages of Quantitative Trading
One of the biggest advantages of quantitative trading is objectivity. Decisions are based on data and rules rather than emotions like fear or greed. Quant strategies are also scalable, allowing traders to manage large portfolios across multiple markets simultaneously. Automation improves consistency, ensuring that strategies are executed exactly as designed without human error.
Additionally, quantitative trading can uncover opportunities that are invisible to the human eye, especially in complex, fast-moving markets where manual analysis is impractical.
Challenges and Limitations
Despite its strengths, quantitative trading is not without challenges. Developing reliable models requires deep expertise in mathematics, programming, and financial theory. Data quality issues, overfitting, and changing market dynamics can reduce effectiveness. As more participants adopt similar strategies, competition increases and profit margins shrink.
Regulatory constraints, technological costs, and the risk of model breakdowns during extreme events also pose significant hurdles. Successful quant traders must continuously research, refine, and adapt their models.
Future of Quantitative Trading
The future of quantitative trading is closely tied to advancements in artificial intelligence, big data, and cloud computing. Alternative data sources, such as satellite imagery and real-time consumer behavior, are expanding the analytical toolkit of quant traders. As markets evolve, quantitative trading is expected to become even more sophisticated, integrating human insight with machine intelligence.
Conclusion
Quantitative trading represents the fusion of finance, mathematics, and technology. By transforming market data into systematic strategies, it offers a disciplined and scalable approach to trading. While it requires significant expertise and resources, quantitative trading continues to shape modern financial markets, redefining how trades are analyzed, executed, and managed in an increasingly data-driven world.

Understanding Ownership, Value, and Investment in Stock MarketWhat Are Shares?
A share is a unit of ownership in a company. When a company needs capital to start, expand, or modernize its operations, it may choose to raise funds by issuing shares to the public or to private investors. Each share represents a small portion of the company’s ownership. Shareholders, therefore, become part-owners of the business.
For example, if a company issues one million shares and an investor owns ten thousand of them, that investor owns one percent of the company. Ownership through shares can entitle investors to certain rights, such as voting on major company decisions and receiving a portion of the company’s profits.
Why Companies Issue Shares
Companies issue shares primarily to raise capital without taking on debt. Unlike loans, the money raised through shares does not need to be repaid. Instead, shareholders share in the risks and rewards of the business. This capital can be used for various purposes such as launching new products, expanding into new markets, upgrading technology, or paying off existing liabilities.
Issuing shares also helps companies improve their credibility and visibility, especially when they are listed on a stock exchange. Publicly listed companies are often perceived as more transparent and reliable due to regulatory requirements and regular disclosures.
Types of Shares
Shares can be broadly classified into two main types: equity shares and preference shares.
Equity shares are the most common form of shares. Equity shareholders are the true owners of the company and have voting rights. They benefit from capital appreciation when the company grows and may receive dividends when profits are distributed. However, equity shareholders are last in line to receive assets if the company is liquidated, making these shares riskier.
Preference shares offer preferential treatment in terms of dividend payments and capital repayment during liquidation. Preference shareholders usually receive a fixed dividend, regardless of the company’s profitability, but they generally do not have voting rights. These shares are considered less risky than equity shares but offer limited growth potential.
How Share Prices Are Determined
The price of a share is determined by supply and demand in the stock market. When more investors want to buy a share than sell it, the price rises. Conversely, when more investors want to sell than buy, the price falls. Several factors influence this demand and supply dynamic, including company performance, earnings reports, industry trends, economic conditions, interest rates, and investor sentiment.
Fundamental factors such as revenue growth, profitability, management quality, and future prospects play a crucial role in determining a company’s intrinsic value. Technical factors, such as market trends and trading volumes, also influence short-term price movements.
Benefits of Investing in Shares
Investing in shares offers several advantages. One of the most important benefits is the potential for high returns over the long term. Historically, equities have outperformed many other asset classes such as fixed deposits and bonds, especially when investments are held for extended periods.
Shares also provide an opportunity to earn dividends, which can serve as a regular income stream. Additionally, investing in shares helps protect wealth against inflation, as growing companies tend to increase their revenues and profits over time, which is reflected in rising share prices.
Another key benefit is liquidity. Shares listed on stock exchanges can be easily bought and sold, allowing investors to convert their investments into cash relatively quickly.
Risks Associated with Shares
While shares offer attractive returns, they also come with risks. Market risk is the most common, where share prices fluctuate due to economic changes, political events, or global developments. Company-specific risks, such as poor management decisions, increased competition, or regulatory issues, can also negatively impact share prices.
Volatility is another risk, particularly in the short term. Share prices can rise or fall sharply, which may be unsettling for new investors. In extreme cases, if a company goes bankrupt, shareholders may lose their entire investment.
Role of Shares in Wealth Creation
Shares play a vital role in long-term wealth creation. By investing in fundamentally strong companies and holding shares over time, investors can benefit from compounding returns. Reinvesting dividends further enhances wealth accumulation.
Shares also contribute to economic growth by channeling savings into productive investments. The capital raised through shares enables companies to innovate, create jobs, and expand operations, which in turn supports overall economic development.
Shares and the Stock Market
The stock market acts as a platform where shares are issued, bought, and sold. Primary markets allow companies to issue new shares through initial public offerings (IPOs), while secondary markets enable investors to trade existing shares. Stock exchanges ensure transparency, liquidity, and fair pricing through regulated trading mechanisms.
Conclusion
Shares represent a powerful financial instrument that connects investors with businesses and economic growth. They offer ownership, the potential for high returns, and participation in a company’s success, while also carrying risks that require careful evaluation. Understanding shares—how they are issued, priced, and traded—helps investors make informed decisions and build long-term wealth. For anyone aiming to grow their financial knowledge or investment portfolio, shares remain a cornerstone of modern finance and an essential component of the global economic system.

Algorithmic AI Trading Strategies: Transforming Modern Markets1. Meaning of Algorithmic AI Trading
Algorithmic AI trading refers to the use of computer programs powered by AI to execute trades based on predefined rules and adaptive learning models.
Unlike traditional algorithmic trading, AI-based systems can learn from historical and real-time data, improving decisions over time.
These strategies reduce emotional bias and enable data-driven decision-making.
2. Core Components of AI Trading Strategies
Data Collection: Market prices, volume, order book data, news, social media sentiment, and macroeconomic indicators.
Data Processing: Cleaning, normalization, and feature extraction for accurate analysis.
AI Models: Machine learning, deep learning, reinforcement learning, and neural networks.
Execution Engine: Automatically places, modifies, and exits trades at optimal prices.
Risk Management Module: Controls exposure, position sizing, and drawdowns.
3. Types of Algorithmic AI Trading Strategies
Trend-Following Strategies:
AI identifies price momentum and trends using historical patterns.
Trades are placed in the direction of the prevailing trend.
Mean Reversion Strategies:
AI assumes prices revert to historical averages.
Trades are triggered when prices deviate significantly from the mean.
Arbitrage Strategies:
AI detects price inefficiencies across markets or instruments.
Executes simultaneous buy and sell orders to lock risk-free or low-risk profits.
Market-Making Strategies:
AI places buy and sell orders continuously to capture bid-ask spreads.
Requires ultra-low latency and precise risk control.
Sentiment-Based Strategies:
AI analyzes news, earnings reports, and social media sentiment.
Trades are aligned with positive or negative market sentiment signals.
4. Role of Machine Learning in Trading
Supervised Learning:
Uses labeled data to predict price direction or volatility.
Unsupervised Learning:
Identifies hidden patterns, clusters, and market regimes.
Reinforcement Learning:
AI learns by trial and error, optimizing strategies through rewards and penalties.
Deep Learning:
Neural networks analyze complex, non-linear relationships in market data.
5. Strategy Development Process
Idea Generation: Identifying inefficiencies or repeatable patterns.
Backtesting: Testing strategies on historical data to evaluate performance.
Optimization: Fine-tuning parameters to improve risk-adjusted returns.
Paper Trading: Simulating trades in real-time without real money.
Live Deployment: Executing strategies in real market conditions.
6. Risk Management in AI Trading
Position Sizing: Limits capital allocation per trade.
Stop-Loss Mechanisms: Automatically exit losing trades.
Diversification: Trading across multiple assets and strategies.
Drawdown Control: Prevents excessive losses during adverse market phases.
Model Risk Monitoring: Detects when AI models stop performing effectively.
7. Advantages of Algorithmic AI Trading
Speed and Efficiency: Executes trades in milliseconds.
Emotion-Free Trading: Eliminates fear, greed, and hesitation.
Scalability: Can trade multiple markets simultaneously.
Consistency: Follows rules strictly without deviation.
Data Utilization: Analyzes vast datasets beyond human capability.
8. Limitations and Challenges
Overfitting Risk: Models may perform well historically but fail in live markets.
Data Quality Issues: Poor data can lead to inaccurate signals.
Market Regime Changes: AI models may struggle during unexpected events.
High Infrastructure Costs: Requires powerful hardware and low-latency systems.
Regulatory Constraints: Compliance with market regulations is essential.
9. Ethical and Regulatory Considerations
Market Fairness: High-frequency AI trading can disadvantage retail traders.
Transparency: Black-box AI models are difficult to interpret.
Risk of Flash Crashes: Rapid automated trading can amplify volatility.
Regulatory Oversight: Authorities monitor algorithmic trading to prevent manipulation.
10. Role of AI Trading in Retail vs Institutional Markets
Institutional Traders:
Use advanced AI systems with large datasets and capital.
Focus on high-frequency and statistical arbitrage strategies.
Retail Traders:
Use simplified AI tools, bots, and platforms.
Emphasize swing trading, trend-following, and signal-based automation.
11. Integration with Other Technologies
Cloud Computing: Enables scalable data processing and storage.
Big Data Analytics: Enhances pattern recognition and forecasting.
Blockchain Integration: Improves transparency and settlement efficiency.
APIs and Trading Platforms: Allow seamless execution and monitoring.
12. Future of Algorithmic AI Trading
AI systems will become more adaptive and self-learning.
Greater use of alternative data such as satellite images and web traffic.
Improved explainable AI models for better transparency.
Increased regulatory frameworks to ensure market stability.
Wider adoption among retail traders through user-friendly platforms.
13. Conclusion
Algorithmic AI trading strategies represent a major evolution in financial markets.
They enhance efficiency, accuracy, and scalability of trading operations.
Despite challenges, proper risk management and ethical practices can make AI trading sustainable.
As technology advances, AI-driven strategies will continue to redefine how markets operate and how traders participate globally.

Part 2 Technical VS. Institutional Common Options Trading Strategies
Options trading is not limited to buying calls and puts. Some widely used strategies include:
Covered Call: Holding a stock and selling a call option to earn premium income.
Protective Put: Buying a put option to protect a stock holding from downside risk.
Straddle: Buying both a call and a put at the same strike price to profit from high volatility.
Strangle: Similar to a straddle but with different strike prices.
Spread Strategies: Using multiple options to limit risk, such as bull spreads and bear spreads.
These strategies allow traders to tailor risk and reward according to their market outlook.

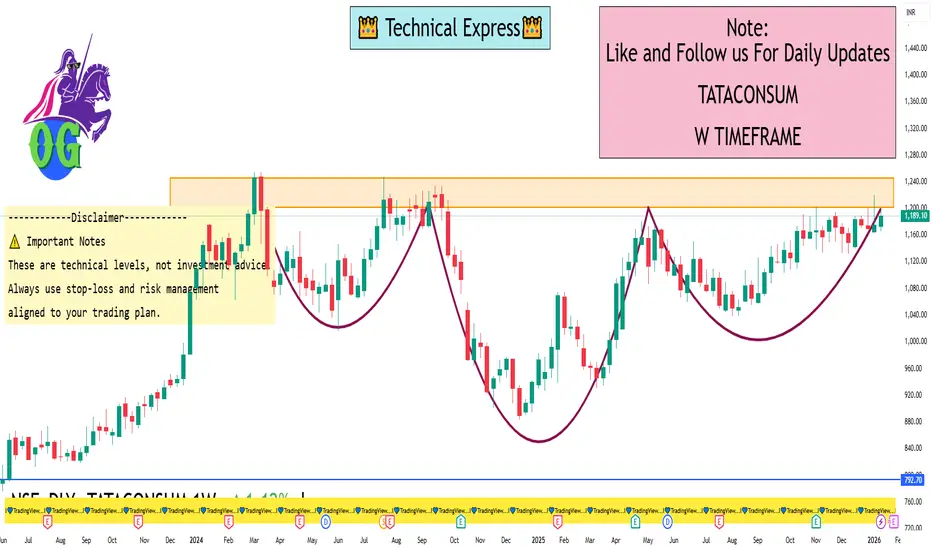
TATACONSUM 1 Week View 📊 Weekly Support & Resistance – Current Levels
Resistance Levels (Upside Targets)
R1: ~₹1,182 – first weekly resistance zone.
R2: ~₹1,200 – medium resistance.
R3: ~₹1,212–₹1,218 – higher resistance cluster.
Major weekly zone: ~₹1,243–₹1,265 – extended upside possible if breakout happens.
Support Levels (Downside Levels)
S1: ~₹1,152–₹1,153 – primary weekly support.
S2: ~₹1,131 – next support zone.
S3: ~₹1,097 – deeper support if S2 breaks.
Lower supports: ~₹1,136–₹1,151 cluster from other pivots.
📌 Weekly Pivot Reference (Live-ish)
Current price is around ₹1,185–₹1,190 region, indicating the balance zone for the week.
📈 How to Use These Levels This Week
Bullish Scenario
A sustained move above ₹1,200 → could accelerate toward ₹1,212–₹1,218 and then ₹1,243+.
Hold above ₹1,182 keeps near-term upside intact.
Bearish Scenario
A break below ₹1,152 → could see correction down to ₹1,131 & ₹1,097.
Weekly close below ₹1,131 may signal deeper selling.
Neutral/Range
If price stays between ₹1,152–₹1,200 → we could see consolidation before a breakout direction.
🧠 Additional Current Indicators (Context)
RSI & SMA readings on daily suggest neutral to mixed momentum, not extreme overbought/oversold.
Moving averages around 1,180–1,171 zones give overlapping support confluence.
⚠️ Important Notes
These are technical levels, not investment advice.
Weekly levels are based on recent technical support/resistance analysis — actual prices may vary intra-session.
Always use stop-loss and risk management aligned to your trading plan.
RSI Indicator: Sector-Wise Analysis and Its Importance in MarketUnderstanding RSI in Brief
RSI is plotted on a scale of 0 to 100. Traditionally:
An RSI above 70 indicates an overbought condition.
An RSI below 30 suggests an oversold condition.
RSI around 50 reflects a neutral or balanced momentum.
At the sector level, RSI does not focus on a single stock but instead represents the collective momentum of a group of stocks belonging to the same industry, such as banking, IT, pharmaceuticals, metals, FMCG, or energy.
Concept of Sector-Wise RSI
Sector-wise RSI measures the strength or weakness of an entire sector relative to its recent price performance. For example, if the banking sector index shows an RSI of 75, it implies strong bullish momentum and possibly overheating conditions across banking stocks. Conversely, if the IT sector RSI is at 28, it signals sector-wide weakness and potential undervaluation.
This approach helps market participants move beyond stock-specific noise and understand where institutional money is flowing. Since large investors often rotate capital between sectors rather than individual stocks, sector RSI becomes a powerful indicator of market rotation.
Importance of Sector RSI in Market Analysis
One of the biggest advantages of sector-wise RSI is its ability to identify leading and lagging sectors. When a sector’s RSI consistently remains above 60, it indicates sustained strength and leadership. Sectors with RSI stuck below 40 often represent laggards, showing weak demand or bearish sentiment.
Sector RSI also helps traders avoid false signals. A stock may show bullish RSI, but if its sector RSI is weak, the rally might be short-lived. On the other hand, when both stock RSI and sector RSI align, the probability of a successful trade increases significantly.
Sector RSI and Market Cycles
Markets move in cycles, and sector RSI plays a crucial role in identifying different phases of these cycles. During the early stage of a bull market, cyclical sectors like metals, capital goods, and banking often show rising RSI values. In the mid-phase, sectors such as IT and infrastructure may gain momentum. In the late phase, defensive sectors like FMCG and pharmaceuticals usually display stronger RSI as investors seek stability.
Similarly, during bear markets, sector RSI helps identify which sectors are experiencing aggressive selling and which ones are showing resilience. Defensive sectors often maintain higher RSI levels even during broader market corrections.
Overbought and Oversold Conditions at Sector Level
While overbought and oversold levels are useful, they should not be interpreted in isolation. A sector RSI above 70 does not always mean an immediate reversal. In strong bull markets, sectors can remain overbought for extended periods. In such cases, RSI staying between 60 and 80 is a sign of healthy strength rather than weakness.
Likewise, an oversold sector RSI below 30 may indicate panic selling or extreme pessimism. Long-term investors often use these zones to identify value opportunities, especially when supported by strong fundamentals.
Sector RSI and Relative Strength Comparison
Sector RSI is also used to compare relative strength between different sectors. For instance, if the auto sector RSI is 65 while the FMCG sector RSI is 45, it suggests that autos are outperforming FMCG in terms of momentum. This comparison helps investors allocate capital more efficiently toward sectors with better risk-reward potential.
Portfolio managers frequently rebalance portfolios based on sector RSI trends, increasing exposure to strong sectors and reducing allocation in weak ones.
Combining Sector RSI with Other Indicators
Although sector RSI is powerful, it works best when combined with other technical and fundamental tools. Trend indicators like moving averages help confirm whether a sector is in an uptrend or downtrend. Volume analysis reveals whether RSI movements are supported by strong participation. Macroeconomic factors such as interest rates, inflation, and government policies also influence sector performance and should be considered alongside RSI.
For example, a rising RSI in the banking sector combined with improving credit growth and stable interest rates strengthens the bullish case. Similarly, a falling RSI in the metal sector alongside declining global commodity prices reinforces bearish sentiment.
Sector RSI for Different Market Participants
Short-term traders use sector RSI to identify momentum trades and sector-based breakouts. Swing traders look for RSI reversals near key support or resistance levels. Long-term investors use sector RSI to time entry and exit points within broader asset allocation strategies.
For beginners, sector RSI provides a simplified view of the market by reducing the complexity of tracking hundreds of stocks individually. It allows them to focus on broader trends and make more informed decisions.
Limitations of Sector RSI
Despite its usefulness, sector RSI has limitations. It is a lagging indicator and reflects past price movements rather than future certainty. Sudden news events, policy changes, or global shocks can quickly invalidate RSI signals. Additionally, sector indices may be dominated by a few heavyweight stocks, which can skew RSI readings.
Therefore, relying solely on sector RSI without context can lead to incorrect conclusions. It should always be used as part of a comprehensive analysis framework.
Conclusion
The RSI indicator at the sector level is a valuable tool for understanding market momentum, identifying sector rotation, and improving decision-making across trading and investment horizons. By analyzing sector-wise RSI, market participants gain clarity on which industries are gaining strength, which are losing momentum, and where potential opportunities or risks lie. When combined with trend analysis, volume, and fundamental insights, sector RSI becomes a powerful guide in navigating dynamic financial markets. In an environment where sector performance often drives overall market direction, sector-wise RSI analysis is not just useful—it is essential.

Part 8 Trading Master Class With Experts Option Trading and Volume Profile
Option traders use volume profile to identify:
Value area
Low volume nodes
High volume nodes
Breakout zones
Reversal zones
Options premiums react strongly around:
POC
Imbalance zones
Market structure shifts

RBLBANK 1 Day Time Frame 📊 Daily Support & Resistance Levels
Immediate resistances:
~₹315–₹318 area — observed short-term resistance zone and recent highs.
~₹325–₹330 — upper resistance band near recent 52-week highs.
Immediate supports:
~₹300–₹295 — important short-term support zone on daily charts.
~₹285–₹280 — next support cluster if breakdown below ₹295 occurs.
📉 Pivot & Intraday Levels (Indicative)
(These are based on typical pivot calculations from recent sessions — actual values will vary daily)
Pivot: around ₹290–₹295.
R1: ~₹295–₹300
R2: ~₹300–₹305
S1: ~₹285–₹280
S2: ~₹280–₹275
(Pivot-based levels give clues for intraday trading and are often recalculated each day.)
📈 Technical Indicator Context (Daily)
RSI (~50) — neutral momentum, neither overbought nor oversold.
Short MA structure shows mixed signals; some shorter SMAs/EMAs near current price.
MACD slightly bearish to neutral on some sources.
🧠 Notes for Daily Traders
Bullish break above ~₹318–₹320 with volume can open up short-term upside towards ₹325–₹330+.
A daily close below ~₹295 may signal short-term weakness and can expose deeper support around ₹285–₹280.

Trading Plan for SuccessUnderstanding the Purpose of a Trading Plan
The primary purpose of a trading plan is to bring structure and clarity to your trading activities. Markets are unpredictable, and no strategy works all the time. A trading plan does not eliminate losses, but it ensures that losses are controlled and gains are maximized when the market moves in your favor. It defines what you trade, when you trade, how much you trade, and why you trade. By following predefined rules, traders avoid emotional decisions such as overtrading, revenge trading, or holding losing positions for too long.
A trading plan also helps in maintaining consistency. Consistency is more important than occasional big profits. When you apply the same rules repeatedly, you can evaluate your performance objectively and make data-driven improvements.
Defining Clear Trading Goals
Every successful trading plan begins with clear and realistic goals. These goals should align with your financial situation, risk tolerance, and time commitment. Instead of focusing only on profits, goals should emphasize process-oriented objectives such as maintaining discipline, following risk management rules, and improving accuracy over time.
Short-term goals may include learning a specific strategy, reducing impulsive trades, or achieving consistent monthly returns. Long-term goals might involve building capital steadily, transitioning to full-time trading, or generating supplemental income. Clearly defined goals provide motivation and direction while keeping expectations realistic.
Choosing the Right Market and Time Frame
A good trading plan specifies the markets you will trade, such as stocks, indices, commodities, forex, or options. It is important to focus on a limited number of instruments rather than trading everything available. Specialization allows you to understand the behavior, volatility, and patterns of specific markets.
Time frame selection is equally important. Intraday traders focus on shorter time frames like 5-minute or 15-minute charts, while swing traders may use daily or weekly charts. Long-term investors rely on monthly or weekly time frames. Your choice should match your personality, lifestyle, and available time. A plan that does not fit your routine is difficult to follow consistently.
Developing a Trading Strategy
The trading strategy is the core of your trading plan. It defines the conditions under which you enter and exit trades. A strategy may be based on technical analysis, price action, indicators, volume analysis, or a combination of these. Regardless of the method, the strategy must have clear, objective rules.
Entry rules should specify the exact conditions that trigger a trade. Exit rules should define profit targets and stop-loss levels before entering the trade. A successful trading plan never leaves exits to guesswork. Risk-to-reward ratio plays a critical role here. Many professional traders aim for trades where potential reward is at least twice the potential risk, ensuring profitability even with a moderate win rate.
Risk Management: The Key to Survival
Risk management is the most critical component of a trading plan. Even the best strategy can fail without proper risk control. A trading plan must define how much capital you are willing to risk on each trade. Most successful traders risk only a small percentage of their trading capital, typically 1–2% per trade.
Position sizing is directly linked to risk management. It ensures that no single trade can cause significant damage to your account. Stop-loss placement must be logical and based on market structure rather than emotional comfort. Risk management protects traders from large drawdowns and helps them stay in the game during unfavorable market phases.
Emotional Discipline and Trading Psychology
Trading success is not just about strategy; it is also about mindset. Fear and greed are the biggest enemies of traders. A trading plan helps manage emotions by providing predefined rules, but discipline is required to follow those rules consistently.
Traders must accept that losses are part of the process. A loss does not mean failure; it means the plan is working as intended. Overconfidence after winning streaks and frustration after losses can lead to deviation from the plan. Maintaining emotional balance and trusting the process are essential for long-term success.
Maintaining a Trading Journal
A trading journal is an integral part of a successful trading plan. It records every trade, including entry, exit, reasoning, emotional state, and outcome. Over time, the journal becomes a powerful tool for self-analysis. It helps identify strengths, weaknesses, and recurring mistakes.
Reviewing the journal regularly allows traders to refine their strategies, eliminate bad habits, and reinforce good behavior. Continuous improvement is only possible when performance is measured and analyzed objectively.
Continuous Learning and Adaptation
Markets evolve, and a trading plan should be flexible enough to adapt to changing conditions. Continuous learning through market observation, backtesting, and performance review is necessary. However, frequent strategy changes should be avoided. Adjustments should be based on data and experience, not short-term results.
Successful traders treat trading as a business, not a gamble. They invest time in education, stay updated with market developments, and continuously work on improving their skills.
Conclusion
A trading plan for success is a combination of strategy, risk management, discipline, and self-awareness. It provides structure in an uncertain environment and transforms trading from an emotional activity into a systematic process. While profits are the ultimate goal, consistency, discipline, and risk control are the true pillars of long-term success. By creating, following, and refining a well-defined trading plan, traders significantly increase their chances of achieving sustainable success in the financial markets.

Cryptocurrency as a Digital Asset1. Introduction to Cryptocurrency
Cryptocurrency is a form of digital or virtual asset that uses cryptography for security.
Unlike traditional money, it exists only in digital form and is not issued by any central authority like a government or central bank.
Bitcoin, launched in 2009, was the first cryptocurrency, followed by thousands of others such as Ethereum, Solana, and Ripple.
Cryptocurrencies operate on blockchain technology, which ensures transparency and security.
2. Meaning of Digital Asset
A digital asset is any asset that exists in electronic format and has economic value.
Cryptocurrencies qualify as digital assets because they can be:
Owned
Transferred
Traded
Stored digitally
Examples of digital assets include cryptocurrencies, NFTs, digital tokens, and stablecoins.
3. Blockchain Technology as the Foundation
Blockchain is a distributed ledger that records all cryptocurrency transactions.
It is decentralized, meaning no single authority controls it.
Each transaction is stored in a block, and blocks are linked together, forming a chain.
This structure makes data immutable, reducing fraud and manipulation.
4. Decentralization and Trustless System
Cryptocurrencies operate in a trustless environment, meaning users do not need to trust each other or intermediaries.
Transactions are verified by network participants (miners or validators).
Decentralization reduces dependence on banks and financial institutions.
It empowers users with full control over their assets.
5. Ownership and Digital Wallets
Ownership of cryptocurrency is determined by private keys.
Digital wallets store these private keys and allow users to send, receive, and hold crypto assets.
Wallets can be:
Hot wallets (online)
Cold wallets (offline hardware wallets)
Losing a private key can result in permanent loss of assets.
6. Cryptocurrency as an Investment Asset
Cryptocurrencies are widely used as investment instruments.
Investors buy crypto expecting price appreciation.
Some cryptocurrencies offer staking rewards and yield opportunities.
High volatility makes crypto attractive for traders but risky for conservative investors.
7. Limited Supply and Scarcity
Many cryptocurrencies have a fixed maximum supply.
Bitcoin, for example, has a cap of 21 million coins.
Scarcity increases perceived value, similar to precious metals like gold.
This feature makes crypto appealing as a store of value.
8. Transparency and Security
All transactions are publicly visible on the blockchain.
Advanced cryptographic algorithms protect transaction data.
Hacking the blockchain is extremely difficult due to its decentralized structure.
However, exchanges and wallets can still be vulnerable if security is weak.
9. Global and Borderless Nature
Cryptocurrencies can be transferred across borders instantly.
They eliminate the need for currency conversion and banking delays.
This makes them useful for international payments and remittances.
Transaction costs are often lower than traditional banking systems.
10. Use in Payments and Commerce
Many businesses accept cryptocurrency as a form of payment.
It enables peer-to-peer transactions without intermediaries.
Smart contracts automate payments when conditions are met.
Adoption is growing in e-commerce, gaming, and online services.
11. Role in Decentralized Finance (DeFi)
DeFi uses cryptocurrencies to create financial services without banks.
Services include lending, borrowing, insurance, and trading.
Users retain control of their assets through smart contracts.
DeFi expands financial access to people without traditional banking.
12. Regulatory Perspective
Governments classify cryptocurrency as a digital asset rather than currency in many countries.
Regulations aim to prevent money laundering and fraud.
Legal clarity is still evolving across jurisdictions.
Regulation can impact crypto prices and adoption rates.
13. Volatility and Risk Factors
Cryptocurrency prices can fluctuate sharply within short periods.
Market sentiment, regulations, and global events influence prices.
Lack of investor protection increases risk.
Proper risk management is essential for crypto investors.
14. Taxation of Digital Assets
Cryptocurrencies are often subject to capital gains tax.
Tax treatment varies from country to country.
Transactions, trading profits, and staking rewards may be taxable.
Accurate record-keeping is crucial for compliance.
15. Comparison with Traditional Assets
Unlike stocks, crypto does not represent ownership in a company.
Unlike bonds, it does not guarantee fixed returns.
Compared to gold, crypto is easier to store and transfer.
It offers higher potential returns but also higher risk.
16. Environmental Concerns
Some cryptocurrencies consume high energy due to mining.
Bitcoin mining has raised environmental concerns.
Newer blockchains use energy-efficient consensus mechanisms.
Sustainability is becoming a key focus in crypto development.
17. Technological Innovation and Growth
Continuous innovation drives the crypto ecosystem.
Developments include Layer-2 solutions, scalability improvements, and interoperability.
Tokenization allows real-world assets to be represented digitally.
Innovation increases the utility of crypto as a digital asset.
18. Financial Inclusion
Cryptocurrencies provide access to finance for unbanked populations.
Anyone with internet access can participate.
This promotes economic empowerment and inclusion.
It reduces reliance on centralized financial systems.
19. Long-Term Value Proposition
Cryptocurrencies represent a shift toward digital ownership.
They challenge traditional financial models.
Institutional adoption is increasing.
Long-term value depends on adoption, regulation, and technology.
20. Conclusion
Cryptocurrency is a revolutionary digital asset reshaping global finance.
It combines technology, economics, and decentralization.
While it offers transparency, security, and innovation, it also carries risks.
As adoption grows, cryptocurrencies are likely to play a major role in the future digital economy.

Smart Money SecretsHow Institutional Investors Really Win in Financial Markets
In financial markets, the term “smart money” refers to capital controlled by institutions, professional traders, hedge funds, banks, and experienced investors who possess deep knowledge, superior resources, and disciplined strategies. Unlike retail traders, smart money does not chase headlines or react emotionally to short-term price fluctuations. Instead, it moves markets quietly, strategically, and with a long-term perspective. Understanding smart money secrets can help individual traders and investors align themselves with market strength rather than fight against it.
Understanding Who Smart Money Is
Smart money represents participants with access to advanced research, large capital, insider-level understanding of market mechanics, and professional risk management systems. These include mutual funds, pension funds, insurance companies, proprietary trading desks, and seasoned investors. Their decisions are not impulsive; they are based on data, probability, and macro-to-micro analysis. While retail traders often focus on indicators alone, smart money focuses on price behavior, liquidity, and market structure.
Smart Money Thinks in Probabilities, Not Predictions
One of the biggest secrets of smart money is that it never tries to predict the market with certainty. Instead, it operates on probabilities. Every trade is viewed as a calculated risk where losses are controlled and profits are allowed to grow. Smart money accepts losses as part of the game and avoids emotional attachment to any single position. This mindset allows institutions to survive long-term, even through volatile market conditions.
Liquidity Is the Real Target
Smart money does not enter or exit trades randomly. It seeks liquidity—areas in the market where many orders are placed, such as stop-loss zones above resistance or below support. These zones provide enough volume for large players to enter or exit positions without causing extreme price disruption. Many sudden price spikes or sharp reversals occur because smart money is collecting liquidity from retail traders who place predictable stop losses.
Market Structure Over Indicators
Retail traders often overload charts with indicators, while smart money primarily studies market structure—higher highs, lower lows, break of structure (BOS), and change of character (CHOCH). Institutions analyze how price moves from one liquidity zone to another. Indicators may lag, but structure reveals the true intent of price movement. Smart money enters trades during consolidation phases and exits during expansion phases, when retail traders are just entering.
Accumulation and Distribution Phases
A key smart money secret lies in understanding accumulation and distribution. During accumulation, institutions quietly build positions while price moves sideways and volatility remains low. Retail traders often get bored and exit during this phase. Once accumulation is complete, price expands rapidly, attracting retail participation. At the top, smart money distributes its holdings while retail traders buy aggressively, believing the trend will continue forever.
Time Is a Strategic Weapon
Smart money is patient. It can wait weeks, months, or even years for the right opportunity. Retail traders, on the other hand, often feel pressure to trade daily. Institutions understand that not trading is also a position. They focus on high-quality setups aligned with broader trends rather than constant activity. This patience allows smart money to enter at optimal prices and avoid unnecessary losses.
Risk Management Is Non-Negotiable
Another powerful secret is strict risk management. Smart money never risks a large percentage of capital on a single trade. Position sizing is calculated precisely, ensuring survival even during losing streaks. Institutions focus more on capital preservation than on making quick profits. This approach allows compounding to work over time, which is the true source of long-term wealth in markets.
Emotions Are Removed From Decisions
Smart money operates through systems, rules, and predefined strategies. Emotional trading—driven by fear, greed, or revenge—is eliminated as much as possible. Decisions are made before entering a trade, including entry, stop-loss, and exit points. Retail traders often react emotionally to market noise, while institutions remain calm and disciplined.
News Is Used, Not Followed
While retail traders often react to news events, smart money prepares in advance. Institutions understand that markets often price in news before it becomes public. By the time headlines appear, smart money may already be exiting positions. News is used as a liquidity event rather than a signal to enter blindly. This is why markets sometimes move opposite to expectations after major announcements.
Following Smart Money Instead of Fighting It
The most valuable lesson for retail traders is not to compete with smart money, but to align with it. This means trading with the trend, respecting key levels, understanding volume and price behavior, and avoiding overtrading. Observing how price reacts at support and resistance, how breakouts behave, and where false moves occur can offer clues to smart money activity.
Conclusion: Turning Knowledge Into Advantage
Smart money secrets are not about hidden tricks or insider information; they are about discipline, patience, structure, and risk control. Institutions win because they think differently, manage risk professionally, and understand how markets truly function. Retail traders who adopt these principles—focusing on probability, liquidity, market structure, and emotional control—can dramatically improve their performance.
Ultimately, the goal is not to outsmart smart money, but to trade alongside it. When you stop chasing the market and start understanding how and why price moves, you shift from being liquidity for smart money to becoming a more informed and strategic market participant.

Part 4 Learn Institutional TradingRisk in Option Trading
1. For Buyers
Time decay
Sudden volatility drop
Wrong direction → total premium loss
2. For Sellers
Unlimited loss on naked selling
Requires high margin
Needs strict risk management

Part 3 Learn Institutional TradingOptions vs Futures
Feature Options Futures
Obligation No (buyer), Yes (seller) Yes
Risk Buyer limited Unlimited
Capital Low Higher
Strategies Very flexible Limited

Part 2 Ride The Big Moves Option Trading Psychology
Avoid emotions
Don’t overtrade
Keep strict stop-loss
Avoid averaging when wrong
Follow market structure
Learn volume profile & volatility patterns
Success in options comes from discipline, not luck.

Part 1 Ride The Big Moves Key Participants in Option Trading
There are two primary participants:
Option Buyer
Pays a premium to buy the option
Has limited risk (maximum loss is the premium paid)
Has potentially unlimited profit (in certain cases)
Option Seller (Writer)
Receives the premium
Has limited profit (only the premium received)
Bears higher or unlimited risk
Understanding the mindset of buyers and sellers is crucial because option prices are driven by their interaction.

Part 2 Technical Analysis vs. Institutional Option TradingPut Options (PE) – Explained
A Put Option gives the buyer the right to sell the underlying asset at the strike price.
Why Buy a Put Option?
You buy a put when you expect the price to fall.
Example:
BANKNIFTY is at 49,000
You buy 49,000 PE @ ₹120
If BANKNIFTY falls to 48,500:
Intrinsic value = 49,000 – 48,500 = 500
Profit = 500 – 120 = ₹380 x lot size
If BANKNIFTY stays above 49,000:
Put expires worthless
Loss = ₹120 premium
Why Sell a Put Option?
You sell a put when you expect market to stay above strike.
Put Seller View:
Market will rise OR stay sideways
Premium will decay with time

Part 1 Technical Analysis vs. Institutional Option Trading Call Options (CE) – Explained
A Call Option gives the buyer the right to buy the underlying asset at the strike price.
Why Buy a Call Option?
You buy a call when you expect the price to rise.
Example:
NIFTY is at 22,000
You buy NIFTY 22,000 CE @ ₹100
If NIFTY goes to 22,400 at expiry:
Intrinsic value = 22,400 – 22,000 = 400
Profit = 400 – 100 = ₹300 x lot size
If NIFTY stays below 22,000:
Your call expires worthless
Loss = Premium = ₹100
Why Sell a Call Option?
You sell a call when you expect the price to stay below strike.
Call Seller View:
Market will fall OR stay sideways
Premium will decrease (time decay)
