Part 11 Trading Master ClassCall and Put Options Explained
A Call Option gives the buyer the right to purchase an asset at a specific price (strike price) before or on the expiry date. Investors buy calls when they expect the asset’s price to rise. Conversely, a Put Option gives the buyer the right to sell the asset at the strike price, used when expecting a price fall. Sellers of options (writers) have obligations—call writers must sell, and put writers must buy if exercised. The interplay between call and put options allows for complex strategies, such as spreads and straddles. Understanding how both function is vital for predicting market direction and building profitable positions.
Trendlinebounce

Trade Rate Sensitive Assets: An In-depth Analysis1. Understanding Trade Rate Sensitive Assets
Trade rate sensitive assets refer to financial instruments or investments whose values fluctuate in response to changes in interest rates, trade volumes, or trade-related policies. The term combines two dimensions:
Interest Rate Sensitivity: Many financial assets, particularly fixed-income securities like bonds and debentures, exhibit price fluctuations when market interest rates change.
Trade Sensitivity: Assets involved in international trade, export-import businesses, or commodities often respond to shifts in trade policies, tariffs, currency fluctuations, and global demand-supply dynamics.
In essence, trade rate sensitive assets are influenced by both monetary factors (interest rates) and macroeconomic factors (trade activities).
2. Key Types of Trade Rate Sensitive Assets
A. Fixed-Income Securities
Bonds, debentures, and other debt instruments are classic examples of trade rate sensitive assets. Their prices are inversely related to interest rate movements. When interest rates rise, existing bonds with lower coupon rates lose market value, and vice versa.
Government Bonds: These are highly sensitive to interest rate changes due to their low risk and fixed coupon payments.
Corporate Bonds: The sensitivity varies depending on the credit rating and maturity period of the bond.
Treasury Bills (T-Bills): Short-term instruments whose yields are directly impacted by central bank rate changes.
Example: Suppose an investor holds a 10-year government bond paying 5% interest. If market rates rise to 6%, the bond’s market price falls because new bonds offer higher returns.
B. Equities of Interest Rate-Sensitive Sectors
Certain industries and companies are more affected by interest rate changes due to their capital structure, borrowing requirements, or trade exposure.
Financial Institutions: Banks and insurance companies are sensitive to interest rate fluctuations because they affect loan demand, net interest margins, and investment income.
Real Estate Companies: High debt dependency makes them vulnerable to rising interest rates.
Export-Oriented Industries: Companies engaged in international trade are sensitive to trade policies, tariffs, and currency exchange rates.
Example: A company exporting electronic goods to the US may experience profit fluctuations if rising interest rates in the US strengthen the dollar against the local currency.
C. Foreign Exchange and Trade-Linked Assets
Assets denominated in foreign currencies, or those linked to international trade, react to both interest rate changes and trade dynamics.
Forex Holdings: Exchange rates are influenced by differential interest rates between countries.
Trade Receivables in Foreign Currency: Companies may face gains or losses due to fluctuating currency rates and interest rate adjustments by central banks.
Commodity Exports: Prices of oil, metals, and agricultural products are sensitive to global demand and trade policies.
D. Derivatives and Structured Products
Derivative instruments such as interest rate swaps, futures, and options are inherently sensitive to interest rate changes. These tools are often used to hedge against or speculate on rate fluctuations.
Interest Rate Swaps: Allow companies to exchange fixed-rate debt for floating-rate debt to mitigate interest rate risk.
Options on Bonds: Their value changes as underlying bond prices fluctuate due to rate movements.
Currency Futures: Used by traders to hedge against foreign exchange and trade-related risks.
3. Factors Influencing Trade Rate Sensitive Assets
Several interrelated factors determine the performance of trade rate sensitive assets:
A. Central Bank Policies
Interest rate adjustments by central banks are among the most direct influencers of trade rate sensitive assets. For instance, rate hikes increase borrowing costs, reducing corporate profits and lowering bond prices. Conversely, rate cuts tend to boost asset values.
B. Inflation Expectations
High inflation often prompts central banks to raise interest rates, affecting both fixed-income and equity markets. Assets with longer maturities or high debt exposure are particularly vulnerable.
C. Global Trade Conditions
Trade-sensitive assets are influenced by international demand, tariffs, and supply chain disruptions. Changes in trade policies, such as import/export restrictions, can dramatically affect commodity-linked equities and currencies.
D. Currency Exchange Rates
Assets involved in cross-border trade are sensitive to exchange rate movements. Interest rate differentials between countries can strengthen or weaken currencies, impacting the value of trade-linked assets.
E. Economic Growth
Economic expansion or contraction influences interest rate decisions, trade volumes, and asset demand. For example, during a recession, central banks may lower interest rates, which typically supports bond prices but may depress export revenues due to reduced global demand.
4. Risks Associated with Trade Rate Sensitive Assets
Investing in trade rate sensitive assets carries multiple risks that investors must carefully consider:
A. Interest Rate Risk
This is the most direct risk, especially for fixed-income securities. Rising interest rates reduce the market value of existing bonds and increase borrowing costs for companies.
B. Currency Risk
Assets tied to foreign trade or denominated in foreign currency are exposed to currency fluctuations. Exchange rate volatility can amplify gains or losses.
C. Market Risk
Equities and commodities linked to trade are vulnerable to broader market swings and geopolitical events. Trade wars, sanctions, or supply chain disruptions can lead to sudden asset price changes.
D. Liquidity Risk
Some trade rate sensitive assets, particularly certain corporate bonds or niche commodities, may have limited market liquidity, making them difficult to sell without incurring losses.
E. Credit Risk
For corporate bonds or trade receivables, the possibility of default adds another layer of risk. Rising interest rates can strain financially leveraged companies, increasing default probability.
5. Measuring Sensitivity: Duration and Convexity
To quantify interest rate sensitivity, financial analysts often use metrics such as duration and convexity:
Duration: Measures the weighted average time it takes to receive bond cash flows. Higher duration implies higher sensitivity to interest rate changes.
Convexity: Accounts for the non-linear relationship between bond prices and interest rate changes. It refines duration estimates and helps in better risk management.
For equities and commodities, beta coefficients and sensitivity to macroeconomic indicators can measure their exposure to rate and trade-related fluctuations.
6. Strategies for Managing Trade Rate Sensitivity
Investors employ multiple strategies to manage risks associated with trade rate sensitive assets:
A. Diversification
Spreading investments across multiple asset classes, industries, and geographies can reduce the impact of interest rate or trade shocks.
B. Hedging
Using derivatives like interest rate swaps, options, and futures can hedge against adverse movements in interest rates or currency fluctuations.
C. Laddering Bonds
Investing in bonds with staggered maturities reduces exposure to interest rate risk and ensures liquidity over time.
D. Focus on Low-Volatility Sectors
Investors may prefer sectors less sensitive to interest rate changes, such as consumer staples or utilities, for stability during volatile periods.
E. Active Monitoring of Trade Policies
For trade-sensitive assets, monitoring international trade agreements, tariffs, and global supply-demand trends is crucial for timely adjustments.
7. Case Studies and Real-World Examples
A. US Federal Reserve Rate Hikes
When the Fed increases interest rates, US Treasury yields rise, causing the prices of existing bonds to drop. This also impacts equities in interest-sensitive sectors like real estate and utilities.
B. India’s Export-Oriented IT Companies
Indian IT exporters earn revenue in foreign currency. Appreciation of the Indian Rupee due to global rate hikes can reduce dollar-denominated profits, affecting stock prices.
C. Commodity Trade Disruptions
Oil prices, a trade-sensitive commodity, reacted sharply during global trade disputes and geopolitical tensions, highlighting how trade policies and international interest rates influence asset values.
8. Implications for Investors and Policymakers
Understanding trade rate sensitive assets is crucial for:
Investors: To optimize portfolio returns and manage interest rate and trade-related risks.
Corporations: To strategize financing, hedging, and trade operations efficiently.
Policymakers: To predict market reactions to interest rate changes, trade policies, and macroeconomic interventions.
Investors need to balance risk and return while factoring in global economic conditions, interest rate forecasts, and trade trends.
9. Conclusion
Trade rate sensitive assets are integral components of modern financial markets. Their values are intricately linked to interest rates, global trade dynamics, currency fluctuations, and economic policies. While they offer significant opportunities for returns, they also come with substantial risks that require careful assessment and strategic management.
By understanding the types of trade rate sensitive assets, the factors influencing their performance, and effective risk management techniques, investors can make informed decisions in both domestic and international markets. Whether through diversification, hedging, or active monitoring of trade policies, navigating the complexities of trade rate sensitive assets demands vigilance, analytical skill, and a proactive investment approach.
In an era of globalization, rapidly changing interest rates, and trade volatility, mastering the dynamics of trade rate sensitive assets is not just advantageous—it is essential for sustainable financial growth and risk management.
SME IPO Buzz for Huge ProfitsUnderstanding SME IPOs
An SME IPO is an offering where small and medium-sized enterprises list their shares on a stock exchange specifically designed for SMEs. Unlike the main board of stock exchanges such as NSE or BSE, SME platforms provide an alternative for companies that may not meet the rigorous requirements of the main board. For instance, the BSE SME platform and NSE Emerge cater exclusively to SMEs, offering a regulated space for capital-raising while giving investors a chance to enter early-stage growth companies.
SME IPOs serve multiple purposes for companies:
Raising Capital for Expansion: SMEs often require funds for scaling operations, launching new products, or entering new markets.
Enhancing Visibility and Credibility: Listing on a stock exchange enhances transparency and corporate governance, boosting investor confidence.
Providing Liquidity for Founders: Early investors and promoters gain an exit route or partial liquidity.
Attracting Institutional and Retail Investors: SME listings bring in a wider investor base, including retail, institutional, and high-net-worth individuals.
Why SME IPOs are Attractive for Investors
Investors are drawn to SME IPOs for several compelling reasons:
1. Early-Stage Growth Potential
SMEs typically operate in niche markets with high growth trajectories. Investing at an early stage allows investors to ride the growth curve before the company becomes a large-cap entity. If the SME successfully scales operations and captures market share, the returns can be significant.
2. Price Discovery Advantage
SME IPOs are often priced at lower levels compared to established companies. This provides investors the chance to buy shares at a relatively affordable valuation, amplifying potential upside if the company performs well.
3. Portfolio Diversification
Including SME stocks in a portfolio introduces diversity by sector, size, and growth profile. Many SMEs operate in innovative sectors such as fintech, healthtech, renewable energy, and manufacturing, providing exposure beyond conventional blue-chip stocks.
4. Potential for High Listing Gains
A well-performing SME IPO can witness immediate listing gains, creating short-term profit opportunities for investors. Investors often see a surge in stock price upon listing due to the novelty and excitement surrounding these companies.
Risks Associated with SME IPO Investments
While SME IPOs hold the promise of huge profits, they also come with inherent risks that investors must understand:
1. Limited Track Record
Many SMEs have a short operating history and limited financial data, making it challenging to evaluate long-term sustainability. Investors rely heavily on management quality, business model, and market potential rather than historical performance.
2. Liquidity Concerns
SME stocks often have lower trading volumes compared to mainboard stocks. This limited liquidity can result in price volatility and difficulties in buying or selling large quantities without impacting the stock price.
3. High Volatility
Due to small market capitalization and sensitivity to business performance, SME stocks can be highly volatile. A single news event, earnings report, or market sentiment shift can significantly affect stock prices.
4. Regulatory and Compliance Risks
Though SME exchanges provide regulatory oversight, SMEs may be more prone to operational or governance challenges. Investors must scrutinize financial statements, management credibility, and compliance with listing norms.
5. Market Sentiment Dependency
SME IPO performance is often heavily influenced by investor sentiment and market trends. A bearish market or economic slowdown can dampen IPO performance irrespective of the company’s fundamentals.
The Regulatory Framework for SME IPOs in India
The Securities and Exchange Board of India (SEBI) has established clear guidelines to protect investors while enabling SMEs to raise capital efficiently. Key features include:
Eligibility Criteria:
Minimum net worth requirements for promoters.
Track record of profitability for a specific period.
Minimum post-IPO capital to ensure sustainability.
Disclosure Norms:
SMEs must submit a detailed prospectus (Offer Document) including:
Business overview and expansion plans.
Financial statements audited by certified professionals.
Risks and uncertainties associated with operations.
Listing Norms:
SME shares can be listed on SME exchanges with less stringent norms compared to the main board.
Mandatory compliance with SEBI regulations regarding corporate governance, reporting, and investor protection.
Investor Protection:
Retail investors often receive a preferential allotment.
SEBI mandates transparency to reduce fraudulent practices and enhance trust.
Strategies to Maximize Profits from SME IPOs
Investing in SME IPOs requires a blend of research, timing, and strategy. Here are some approaches:
1. Research the Company Thoroughly
Before investing, study the SME’s business model, revenue streams, management team, competitive advantage, and sector growth potential. Understanding the company’s market positioning can help identify whether it has the potential for long-term profits.
2. Evaluate the IPO Valuation
Analyze the price-to-earnings (P/E) ratio, price-to-book (P/B) ratio, and industry benchmarks. SMEs with reasonable valuations relative to their growth prospects tend to offer better returns.
3. Focus on Management Quality
The credibility, vision, and track record of promoters and key management personnel play a critical role in determining success. Experienced and visionary leadership increases the likelihood of sustainable growth.
4. Diversify Investments
Investing in multiple SME IPOs can mitigate risk. Diversification reduces dependence on the performance of a single company and increases the chances of capturing profitable opportunities.
5. Timing of Exit
Decide whether to pursue short-term listing gains or long-term growth. Some SME IPOs provide immediate listing gains due to high initial demand, while others may take months or years to realize their full potential.
6. Monitor Post-Listing Performance
After listing, monitor quarterly earnings, operational performance, and market trends. Consistent growth and positive news flow often lead to sustained price appreciation.
Sector Trends Driving SME IPOs
Several sectors are fueling the SME IPO buzz:
Technology and IT Services: SMEs in software development, fintech, and cloud solutions are attracting investors due to exponential growth potential.
Healthcare and Pharmaceuticals: Healthtech and pharma SMEs benefit from rising healthcare demands and innovation in diagnostics and therapeutics.
Renewable Energy: With global emphasis on sustainability, SMEs in solar, wind, and green technologies are capturing investor interest.
Consumer Goods and Retail: SMEs catering to niche markets in FMCG, e-commerce, and specialty products show promising revenue growth.
Manufacturing and Infrastructure: SMEs in specialized manufacturing and infrastructure contribute to India’s industrial growth, providing strong profit potential.
The Investor Psychology Behind SME IPO Buzz
The excitement around SME IPOs is partly driven by investor psychology. Early investors are drawn to stories of rapid growth, innovation, and market disruption. Media coverage, social buzz, and peer discussions often create a sense of urgency, amplifying demand. Additionally, success stories of SME IPOs delivering massive returns reinforce optimism and speculation. While this buzz can lead to profitable opportunities, it can also inflate valuations and increase short-term volatility.
Case Studies of Profitable SME IPOs
Several SMEs have generated significant returns post-IPO:
Company A (IT SME): Listed at ₹50 per share and scaled rapidly in cloud services. Within two years, the share price appreciated fivefold.
Company B (Healthcare SME): A diagnostics company leveraged innovative technology to capture market share, yielding substantial listing gains for early investors.
Company C (Renewable SME): Focused on solar energy solutions and benefited from government incentives, leading to consistent stock appreciation post-IPO.
These examples illustrate that careful selection, backed by research and market understanding, can translate SME IPO investments into substantial profits.
Conclusion
SME IPOs represent a dynamic and profitable segment of the Indian capital market, offering investors a chance to participate in early-stage growth companies. The potential for huge profits stems from affordable valuations, high growth potential, and market excitement. However, these opportunities are accompanied by risks such as limited track record, volatility, and liquidity challenges.
A successful SME IPO investment strategy requires thorough research, careful evaluation of management quality, diversification, and monitoring post-listing performance. By balancing risk and reward, investors can capitalize on the SME IPO buzz while contributing to the growth of India’s vibrant entrepreneurial ecosystem.
Ultimately, SME IPOs are not just investment vehicles—they are gateways to participating in the nation’s growth story, offering both financial returns and the satisfaction of supporting innovative enterprises that shape the future of the economy.

Modern Market Explosion: Understanding the Phenomenon1. Historical Context of Market Evolution
To understand the modern market explosion, it is essential to consider the historical evolution of markets. Traditional markets were largely localized. Traders and merchants operated within geographic constraints, and trade was limited by logistical, technological, and regulatory barriers. Economic activity was driven by physical commodities, and transactions were largely cash-based or involved simple barter systems.
The Industrial Revolution marked a turning point. Mass production, improved transportation networks, and the rise of factories enabled businesses to scale operations beyond local markets. Subsequently, the 20th century witnessed further market expansion with globalization, advancements in communication, and the liberalization of trade policies. Multinational corporations began operating across continents, and financial markets expanded in size and scope, laying the foundation for today’s explosive market growth.
2. Drivers of the Modern Market Explosion
The modern market explosion is driven by several interrelated factors:
2.1 Technological Advancements
Technology is the primary catalyst for market expansion. The digital revolution, characterized by the rise of the internet, mobile technology, and cloud computing, has created new markets and transformed existing ones. E-commerce platforms, fintech applications, and digital payment systems have made it possible for businesses to reach consumers globally with minimal cost. Artificial intelligence (AI), machine learning, and big data analytics have enhanced market efficiency by enabling predictive modeling, targeted marketing, and personalized consumer experiences.
Blockchain and cryptocurrency technologies have introduced decentralized finance (DeFi) and digital assets, adding entirely new dimensions to global markets. Technology also supports real-time communication and logistics management, reducing transaction friction and enabling just-in-time supply chains.
2.2 Globalization
Globalization has exponentially increased market reach. Trade liberalization, the reduction of tariffs, and the establishment of free trade agreements have integrated economies worldwide. Businesses can now source raw materials from one continent, manufacture in another, and sell products globally. This integration has expanded consumer bases, diversified product offerings, and intensified competition. Globalization has also facilitated cross-border investments, enabling capital to flow more freely and boosting market liquidity.
2.3 Financial Innovation
Modern financial markets have grown through innovation. Derivatives, exchange-traded funds (ETFs), and securitization have increased market complexity while providing investors with diverse opportunities for risk management and profit generation. The rise of retail investing, supported by digital trading platforms and mobile apps, has democratized access to markets, contributing to higher transaction volumes and market participation.
2.4 Consumer Behavior and Social Trends
Changing consumer behavior has further accelerated market growth. Modern consumers demand convenience, variety, and personalized experiences. The rise of social media and influencer culture has altered purchasing patterns, creating viral trends that can rapidly inflate demand for products and services. Millennials and Gen Z, in particular, prioritize experiences, sustainability, and digital engagement, shaping market offerings in unprecedented ways.
2.5 Policy and Regulatory Environment
Governments and regulatory authorities play a critical role in enabling market expansion. Policies that promote entrepreneurship, protect intellectual property, and ensure financial stability encourage business growth. Conversely, relaxed regulations in digital finance and cross-border commerce have facilitated innovative market models, including fintech startups, gig economy platforms, and decentralized marketplaces.
3. Characteristics of Modern Market Explosion
The modern market explosion exhibits several distinctive characteristics:
3.1 Scale and Speed
Modern markets operate on an unprecedented scale and at extraordinary speed. Global supply chains, e-commerce, and digital finance allow businesses to scale rapidly. Information spreads instantly, enabling consumers to respond to trends in real-time, which amplifies market volatility and opportunity.
3.2 Diversification
Markets are increasingly diversified. Beyond traditional goods and services, there are emerging sectors such as renewable energy, artificial intelligence, electric vehicles, digital entertainment, and virtual assets. This diversification reduces reliance on single industries while creating new economic opportunities and employment avenues.
3.3 Interconnectedness
Modern markets are highly interconnected. Economic events in one region can rapidly affect global markets, as witnessed during the 2008 financial crisis and the COVID-19 pandemic. Interconnectedness increases both the potential for growth and the susceptibility to shocks.
3.4 Consumer-Centricity
The explosion of modern markets is heavily driven by consumer-centric models. Businesses leverage data analytics and AI to anticipate consumer needs, personalize offerings, and optimize engagement. Direct-to-consumer (D2C) models, subscription services, and platform-based marketplaces exemplify this shift.
3.5 Financialization
Financialization of markets—where financial markets and instruments dominate economic activity—has accelerated growth. Companies can raise capital more efficiently, investors can access diverse asset classes, and speculative trading contributes to rapid market expansion. However, this also increases systemic risk, as market bubbles and crashes can propagate quickly.
4. Technological Catalysts in Depth
4.1 E-commerce and Digital Platforms
E-commerce platforms like Amazon, Alibaba, and Flipkart have revolutionized retail markets. Consumers can purchase products from anywhere, while businesses can reach global audiences without investing in physical stores. Digital marketplaces reduce barriers to entry for small and medium-sized enterprises (SMEs), fostering entrepreneurship and competition.
4.2 Artificial Intelligence and Automation
AI and automation enhance efficiency in supply chains, inventory management, customer service, and financial trading. AI-driven algorithms can predict market trends, optimize pricing strategies, and personalize consumer experiences, accelerating market activity and growth.
4.3 Cryptocurrency and Blockchain
Blockchain technology enables decentralized markets that operate independently of traditional financial systems. Cryptocurrencies, smart contracts, and NFTs (non-fungible tokens) have created entirely new investment avenues, attracting retail and institutional participation alike.
5. Economic and Social Implications
The explosion of modern markets has profound economic and social consequences:
5.1 Economic Growth
Market expansion drives economic growth by increasing production, employment, and consumer spending. Emerging sectors, particularly in technology and renewable energy, stimulate innovation and long-term economic resilience.
5.2 Inequality and Market Access
While markets have grown, access is not uniform. Digital divides, regulatory barriers, and capital concentration can exacerbate inequality. Wealth and market influence often cluster among large corporations and tech giants, raising concerns about monopoly power and market fairness.
5.3 Volatility and Risk
Rapid market expansion increases volatility. High-frequency trading, speculative investment, and global interconnectivity mean that shocks can propagate rapidly. Regulatory oversight and risk management are crucial to prevent systemic crises.
5.4 Consumer Empowerment
Consumers benefit from greater choice, convenience, and competitive pricing. The explosion of markets empowers individuals to make informed decisions, access global products, and influence market trends through social and digital platforms.
6. Case Studies of Market Explosion
6.1 Technology Sector
The rise of technology companies exemplifies market explosion. Firms like Apple, Google, Microsoft, and Amazon have scaled rapidly, creating new market categories while reshaping existing ones. Their influence spans multiple sectors, from cloud computing to entertainment, reflecting the interconnected nature of modern markets.
6.2 E-commerce and Retail
E-commerce has transformed retail markets globally. During events like Black Friday or festive seasons, platforms witness unprecedented transaction volumes. Social commerce, live-stream selling, and digital marketing have accelerated consumer engagement and market growth.
6.3 Renewable Energy
The renewable energy market has exploded due to global sustainability goals, policy incentives, and technological innovation. Solar, wind, and battery storage markets have expanded rapidly, attracting investment and creating new industries, illustrating how market growth aligns with social and environmental priorities.
7. Challenges and Risks
Despite opportunities, the modern market explosion presents challenges:
Market Volatility: Rapid growth and speculation can lead to sudden crashes.
Regulatory Lag: Regulations often struggle to keep pace with innovation, particularly in digital finance and cryptocurrencies.
Inequality: Concentration of wealth and market power can marginalize smaller players.
Sustainability: Unsustainable business practices may undermine long-term market stability.
8. Future Outlook
The future of market growth will likely be shaped by emerging technologies such as AI, quantum computing, and advanced robotics. Sustainability and ESG (Environmental, Social, Governance) considerations will increasingly influence investment and consumer decisions. Global markets will continue to integrate, but geopolitical tensions, trade conflicts, and technological competition will introduce uncertainties.
The democratization of markets through digital platforms, social media, and decentralized finance will continue to empower individuals and SMEs. However, balancing innovation with regulation, stability, and inclusivity will be critical to ensuring sustainable growth.
Conclusion
The modern market explosion is a defining characteristic of the 21st-century economy. It is driven by technological innovation, globalization, financial innovation, and changing consumer behavior. While it offers unprecedented opportunities for growth, entrepreneurship, and consumer empowerment, it also presents challenges related to volatility, inequality, and regulatory oversight. Understanding this phenomenon requires a holistic view of the interconnected social, technological, and economic forces shaping modern markets. As markets continue to evolve at a rapid pace, stakeholders—from policymakers to businesses and consumers—must navigate both the opportunities and risks to harness the full potential of this extraordinary expansion.

Carbon Credits and ESG Investing1. Understanding Carbon Credits
1.1 Definition
A carbon credit is a tradable certificate or permit that represents the right to emit one ton of carbon dioxide (CO₂) or an equivalent amount of another greenhouse gas (GHG). Essentially, it is a financial instrument designed to cap emissions while incentivizing reductions. Carbon credits are central to market-based approaches for controlling global carbon emissions.
1.2 Types of Carbon Credits
Carbon credits can be broadly classified into two categories:
Compliance Carbon Credits:
These are generated and traded under mandatory national or international regulatory frameworks, such as the European Union Emissions Trading System (EU ETS) or the Kyoto Protocol mechanisms. Companies exceeding emission limits can purchase credits to meet compliance.
Voluntary Carbon Credits:
These are used by companies or individuals on a voluntary basis to offset emissions beyond regulatory requirements. The voluntary market supports projects like reforestation, renewable energy, and methane capture.
1.3 Mechanism of Carbon Credits
The carbon credit system operates on the “cap-and-trade” principle:
Cap: Governments or regulatory bodies set a cap on total carbon emissions for specific sectors or organizations.
Allocation: Companies are allocated emission allowances equivalent to the cap.
Trade: If a company emits less than its allowance, it can sell excess credits. Conversely, companies exceeding their limits must purchase credits to comply.
This system creates a financial incentive for companies to reduce emissions efficiently, while providing flexibility in achieving environmental goals.
1.4 Benefits of Carbon Credits
Environmental Impact: Encourages the reduction of greenhouse gas emissions and supports renewable energy and conservation projects.
Economic Incentives: Provides a cost-effective mechanism for companies to manage emission limits.
Global Cooperation: Facilitates cross-border collaboration in combating climate change.
Innovation: Encourages technological advancements in energy efficiency and clean technologies.
1.5 Challenges
Verification and Transparency: Ensuring the authenticity and impact of carbon credits can be difficult, especially in voluntary markets.
Market Volatility: Prices of carbon credits can fluctuate, affecting corporate planning.
Risk of “Greenwashing”: Companies may misuse credits to appear environmentally responsible without genuine sustainability efforts.
2. ESG Investing
2.1 Definition
ESG investing is an investment strategy that integrates Environmental, Social, and Governance factors into financial decision-making. Unlike traditional investment approaches that focus solely on financial returns, ESG investing evaluates how companies manage sustainability risks and social responsibilities.
Environmental: Examines a company’s environmental footprint, including energy use, emissions, waste management, and climate impact.
Social: Focuses on human capital management, labor standards, community relations, and diversity and inclusion.
Governance: Assesses corporate governance practices, board structure, transparency, shareholder rights, and ethical conduct.
2.2 History and Evolution
The concept of ESG investing has evolved over decades:
1960s–1980s: Ethical investing emerged, primarily focused on avoiding “sin stocks” like tobacco and weapons.
1990s–2000s: Socially responsible investing (SRI) began incorporating broader social and environmental concerns.
2010s–Present: ESG investing became mainstream, driven by climate change concerns, regulatory pressure, and growing investor awareness of long-term risks.
2.3 ESG Integration Strategies
Investors can adopt several approaches to integrate ESG factors:
Screening: Excluding companies or sectors that do not meet ESG criteria (negative screening) or including those that do (positive screening).
Integration: Embedding ESG factors into fundamental financial analysis to assess long-term risks and opportunities.
Impact Investing: Targeting investments that generate measurable social and environmental benefits alongside financial returns.
Shareholder Engagement: Using ownership rights to influence company policies on sustainability and corporate governance.
2.4 Importance of ESG Investing
Risk Management: ESG factors help identify potential environmental, social, or governance risks that could impact financial performance.
Long-term Value Creation: Companies with strong ESG performance tend to demonstrate resilience and sustainable growth.
Regulatory Compliance: Governments and regulators are increasingly mandating ESG disclosures and reporting.
Reputation and Consumer Demand: ESG-aligned companies attract customers, employees, and investors seeking responsible businesses.
2.5 Challenges in ESG Investing
Standardization: Lack of uniform ESG metrics and reporting standards makes comparisons difficult.
Greenwashing: Companies may exaggerate ESG credentials to attract investors without real impact.
Short-term vs Long-term: ESG benefits often manifest over the long term, while market pressures may favor short-term gains.
Data Quality: Reliable ESG data can be scarce, inconsistent, or biased.
3. Intersection of Carbon Credits and ESG Investing
Carbon credits and ESG investing are closely linked. Carbon credits primarily address environmental factors, which form a significant part of ESG considerations. Here’s how they intersect:
3.1 Carbon Credits as ESG Tools
Companies can purchase carbon credits to offset emissions, demonstrating commitment to environmental sustainability.
Carbon credits serve as measurable ESG actions that investors can evaluate when assessing environmental performance.
Integration of carbon credits into corporate ESG strategies enhances credibility and transparency in emissions reduction reporting.
3.2 Driving ESG-Compliant Investments
Investors increasingly consider companies’ carbon footprint and offset strategies when making investment decisions. Firms actively participating in carbon markets often attract ESG-focused capital, creating a feedback loop:
Investor Pressure: ESG-conscious investors demand action on climate-related risks.
Corporate Response: Companies adopt carbon offset projects, improve energy efficiency, and reduce emissions.
Market Incentive: This enhances long-term corporate value and reduces exposure to regulatory or environmental risks.
3.3 Role in Sustainable Finance
Sustainable finance refers to integrating ESG factors into financial systems to promote sustainable development. Carbon credits, green bonds, and ESG funds are instruments enabling sustainable finance:
Green Bonds: Proceeds are used for environmentally sustainable projects.
ESG Funds: Allocate capital to companies with strong ESG practices, often including carbon reduction initiatives.
Carbon Markets: Provide financial incentives for emissions reductions, complementing ESG investment strategies.
4. Global Trends and Market Dynamics
4.1 Carbon Market Growth
The global carbon market has expanded rapidly. According to the World Bank:
The market reached over $300 billion in value by 2023, with both compliance and voluntary markets growing.
Regulatory initiatives like the EU ETS, California Cap-and-Trade Program, and China’s national carbon market are driving compliance credit demand.
Voluntary carbon markets are increasingly used by multinational corporations to meet net-zero targets.
4.2 ESG Investment Growth
Global ESG assets are projected to surpass $50 trillion by 2025, representing over a third of total assets under management.
Institutional investors, pension funds, and sovereign wealth funds are incorporating ESG criteria into mainstream investment decisions.
ESG-focused indices and funds are becoming standard offerings in global capital markets.
4.3 Regional Variations
Europe: Leading in ESG adoption due to regulatory frameworks like the EU Sustainable Finance Disclosure Regulation (SFDR).
United States: ESG investing is growing, though regulatory clarity is evolving.
Asia-Pacific: Rapid adoption driven by corporate sustainability initiatives and investor demand, especially in Japan, India, and China.
5. Challenges and Criticisms
5.1 Carbon Credits
Lack of uniform verification standards.
Risk of over-reliance on offsets instead of direct emission reductions.
Potential for double counting or non-additionality (credits not leading to actual emission reductions).
5.2 ESG Investing
ESG rating agencies may use different methodologies, causing discrepancies.
Greenwashing remains a significant concern.
Measuring impact remains complex; financial returns are sometimes uncertain.
5.3 Integration Challenges
Combining ESG investment strategies with carbon credit mechanisms requires robust reporting and transparency.
Investors must carefully evaluate whether carbon offsets genuinely contribute to sustainability or merely serve marketing purposes.
Harmonization of global ESG standards is needed to streamline investment decisions.
6. Future Outlook
6.1 Regulatory Developments
Governments worldwide are introducing stricter ESG reporting and carbon disclosure requirements. These regulations are expected to:
Improve transparency in carbon markets.
Enhance corporate ESG reporting.
Encourage the adoption of standardized ESG metrics.
6.2 Technological Innovations
Blockchain: Enhances transparency in carbon credit trading and ESG reporting.
AI and Big Data: Improve ESG data collection, analysis, and predictive modeling.
Clean Technology: Investments in renewable energy, carbon capture, and sustainable agriculture will expand ESG and carbon credit opportunities.
6.3 Investor Behavior
Younger investors increasingly prioritize sustainability, pushing companies toward ESG compliance.
Impact investing and socially responsible funds will continue to grow.
Integration of carbon pricing into financial models will help assess corporate climate risk more accurately.
Conclusion
Carbon credits and ESG investing are pivotal in the transition toward a sustainable global economy. Carbon credits provide a mechanism to limit greenhouse gas emissions, incentivize environmental projects, and facilitate corporate accountability. ESG investing, on the other hand, allows investors to integrate sustainability into financial decisions, promoting ethical, responsible, and long-term value creation.
The synergy between these two concepts is crucial. Carbon credits complement ESG strategies by providing measurable environmental actions, while ESG investing channels capital toward sustainable and responsible enterprises. Together, they represent a shift in the financial world where profitability, sustainability, and societal impact are no longer mutually exclusive but increasingly interconnected.
As the global community confronts the challenges of climate change, resource scarcity, and social inequality, carbon credits and ESG investing will continue to play transformative roles in shaping investment strategies, corporate behavior, and ultimately, the sustainability of our planet.

Intraday Trading vs Swing Trading1. Definition and Concept
Intraday Trading:
Intraday trading, often referred to as day trading, involves buying and selling financial instruments within the same trading day. The positions are opened and closed during market hours, ensuring that no trades are carried overnight. The primary objective is to capitalize on short-term price fluctuations, often measured in minutes or hours. Intraday traders rely heavily on technical analysis, real-time charts, and market news to make rapid decisions.
Swing Trading:
Swing trading, on the other hand, is a medium-term strategy where traders aim to profit from price “swings” or trends over several days to weeks. Unlike intraday trading, positions in swing trading are not confined to a single day and may be held for multiple sessions. Swing traders attempt to capture significant market moves rather than minute-to-minute fluctuations, employing both technical and fundamental analysis.
Key Difference:
The central distinction is time horizon. Intraday trading is about short bursts of activity within a day, whereas swing trading spans multiple days to weeks, targeting broader trends.
2. Time Commitment
Intraday Trading:
Intraday trading demands significant attention and engagement throughout the trading session. Traders need to monitor charts, order flows, and news events continuously. This makes intraday trading time-intensive and akin to a full-time job for active traders. Missing even a short market movement can result in lost opportunities or losses.
Swing Trading:
Swing trading requires less constant monitoring. Since positions are held for several days, traders can check the market periodically, adjusting their positions as trends develop. This makes swing trading more suitable for part-time traders or those with other professional commitments.
3. Capital Requirements and Leverage
Intraday Trading:
Day trading often involves high leverage to magnify small price movements into meaningful profits. Many brokers offer intraday margin, allowing traders to take positions several times larger than their actual capital. While leverage increases profit potential, it also amplifies risk, making risk management crucial.
Swing Trading:
Swing trading generally requires more capital upfront because positions are held overnight and are exposed to market gaps and volatility. Leverage may still be used, but it is usually lower than in intraday trading, as the focus is on capturing larger moves rather than rapid micro-fluctuations.
Key Takeaway:
Intraday trading is more capital-efficient due to leverage but riskier in a short timeframe. Swing trading needs more upfront capital, but risk is spread across time, allowing more measured position sizing.
4. Risk and Volatility
Intraday Trading:
Intraday trading exposes traders to high volatility, but the exposure is limited to a single trading session. Traders can use stop-loss orders to manage risk aggressively. However, markets can move unpredictably within minutes, leading to rapid gains or losses.
Swing Trading:
Swing traders face overnight and weekend risk, where significant news events or economic developments can cause price gaps. While daily volatility may be less critical, holding positions overnight increases the potential for unexpected swings, which requires careful risk management.
Comparison:
Intraday trading: High short-term risk, low overnight exposure.
Swing trading: Moderate daily risk, higher overnight/holding risk.
5. Analytical Approach
Intraday Trading:
The strategy relies almost entirely on technical analysis, including:
Candlestick patterns
Intraday charts (1-minute, 5-minute, 15-minute)
Volume analysis
Moving averages, RSI, MACD
News and economic data for intraday sentiment
Fundamental factors are usually secondary, as their impact manifests over a longer timeframe.
Swing Trading:
Swing traders use a blend of technical and fundamental analysis:
Technical analysis identifies entry and exit points using daily or weekly charts.
Fundamental analysis helps assess whether a stock or commodity has the potential for multi-day trends, based on earnings reports, economic indicators, or sectoral developments.
Key Insight:
Intraday trading focuses on price action and market psychology in the very short term, while swing trading integrates market trends with underlying financial health.
6. Profit Potential and Target
Intraday Trading:
Targets small profits per trade, often measured in a few percentage points or fractions thereof.
High frequency of trades is necessary to accumulate meaningful gains.
Profit depends heavily on timing and execution.
Swing Trading:
Targets larger profits per trade, sometimes 5–20% or more depending on the instrument and trend duration.
Fewer trades are executed, but each trade aims to capture a substantial portion of the trend.
Patience is key; missing a trend reversal can significantly affect profitability.
7. Psychological and Emotional Factors
Intraday Trading:
Highly stressful due to rapid decision-making and constant monitoring.
Emotional discipline is critical to avoid impulsive trades based on fear or greed.
Traders often experience burnout, especially during volatile markets.
Swing Trading:
Less stressful in daily execution but requires patience and emotional control over longer periods.
Traders need to resist the urge to exit early or chase market reversals.
Swing trading fosters a calmer, more strategic mindset, focusing on trend-following rather than rapid reaction.
8. Costs and Expenses
Intraday Trading:
Higher transaction costs due to frequent trading.
Broker commissions, spreads, and taxes can eat into profits if not managed efficiently.
Swing Trading:
Lower transaction costs, as trades are less frequent.
Overnight exposure may involve financing costs if positions are leveraged in margin accounts.
Key Observation:
Intraday trading requires high-volume, low-margin efficiency, while swing trading benefits from fewer trades with larger profit potential per trade.
9. Suitability for Different Traders
Intraday Trading:
Suitable for traders with high risk tolerance, strong analytical skills, and the ability to monitor markets constantly.
Ideal for individuals seeking quick returns and able to handle high stress.
Swing Trading:
Better suited for part-time traders, investors who prefer moderate risk, or those who value trend-based strategies.
Aligns with individuals focusing on longer-term wealth accumulation without the need for constant market monitoring.
10. Tools and Technology
Intraday Trading:
Requires real-time data feeds, fast execution platforms, charting software, and news alerts.
Algorithmic trading and automated systems are commonly used to capitalize on micro-movements.
Swing Trading:
Can operate with daily charts, trend indicators, and fundamental reports.
Automation is less critical; research and strategic analysis often suffice.
11. Advantages and Disadvantages
Aspect Intraday Trading Swing Trading
Time Horizon Same-day Several days to weeks
Time Commitment High Moderate
Risk High short-term, low overnight Moderate daily, higher overnight
Profit Potential Small per trade, frequent Larger per trade, less frequent
Capital Efficiency High (via leverage) Requires more capital upfront
Stress Level High Moderate
Analytical Focus Technical only Technical + Fundamental
Transaction Costs High due to frequent trades Low to moderate
Suitability Full-time, active, risk-tolerant traders Part-time, trend-followers, moderate risk
12. Conclusion
Both intraday and swing trading are viable strategies but cater to different personality types, financial goals, and lifestyles. Intraday trading offers the thrill of rapid decision-making and potential for quick profits but requires high dedication, real-time analysis, and exceptional risk management. Swing trading, by contrast, offers a more patient, strategic approach, balancing market analysis with trend-based decisions, suitable for those who cannot dedicate full trading hours but still seek substantial returns.
Choosing between intraday and swing trading depends on multiple factors:
Risk tolerance
Time availability
Capital allocation
Emotional resilience
Market knowledge and analytical skill
Ultimately, successful trading in either domain demands discipline, strategy, and continuous learning. Understanding the nuances of intraday versus swing trading can help traders craft a personalized approach, optimizing both profitability and sustainability in financial markets.

Part 3 learn Institutional Trading The Role of the Strike Price and Expiry Date
Each option contract includes a strike price and an expiry date. The strike price determines the level at which the asset can be bought or sold, while the expiry date sets the time limit. The relationship between the strike price and the market price determines whether an option is in-the-money (ITM), at-the-money (ATM), or out-of-the-money (OTM). As expiry nears, the option’s time value decreases—a concept known as time decay. Short-term options lose value faster, while long-dated ones retain time premium longer. Successful option traders always monitor how close prices are to the strike and how much time remains to expiry before making or exiting trades.

The Rise of the Indian Stock MarketIntroduction
The Indian stock market has undergone a phenomenal transformation over the past three decades, evolving from a largely unregulated and paper-based trading system into one of the most dynamic and technologically advanced financial markets in the world. Once perceived as volatile and opaque, India’s equity market has now become a pillar of the nation’s economic growth, attracting both domestic and global investors. This rise is not just a reflection of corporate profitability or market capitalization—it symbolizes India’s journey toward financial maturity, economic resilience, and global competitiveness.
The rise of the Indian stock market is a story shaped by reforms, innovation, globalization, and a growing culture of financial participation. From the establishment of modern stock exchanges like the NSE to the adoption of cutting-edge technology and the inclusion of millions of retail investors, India’s capital market has become a robust ecosystem that supports entrepreneurship, infrastructure, and economic expansion.
Historical Evolution of the Indian Stock Market
The origins of the Indian stock market can be traced back to the Bombay Stock Exchange (BSE), established in 1875, making it one of the oldest stock exchanges in Asia. However, for much of its early history, the market was dominated by a small group of brokers and traders, with limited transparency and accessibility. The real transformation began in the 1990s, when India embarked on a series of economic liberalization reforms.
The 1991 economic reforms, spearheaded by then Finance Minister Dr. Manmohan Singh, marked a turning point. India opened its economy to global competition, reduced trade barriers, and modernized financial systems. These reforms created the foundation for a modern capital market structure.
In 1992, the establishment of the Securities and Exchange Board of India (SEBI) as the market regulator played a crucial role in enforcing transparency, protecting investors, and curbing malpractices. The same year saw the Harshad Mehta scam, which exposed systemic weaknesses but also accelerated regulatory modernization. The subsequent launch of the National Stock Exchange (NSE) in 1994 brought technological innovation and electronic trading, replacing the traditional open outcry system.
Technological Advancements and Market Modernization
Technology has been the single most important driver of efficiency in the Indian stock market. The introduction of electronic trading systems by NSE revolutionized how securities were bought and sold. It eliminated the physical share certificates and enabled dematerialization, making trading faster, safer, and more transparent.
The establishment of National Securities Depository Limited (NSDL) in 1996 and Central Depository Services Limited (CDSL) in 1999 allowed investors to hold securities in electronic form. This move significantly reduced the risks of forgery, delays, and settlement failures.
With the advent of online trading platforms, mobile applications, and discount brokers, the stock market became more accessible to retail investors. Platforms like Zerodha, Groww, and Upstox have democratized participation by allowing individuals to trade at minimal cost with just a smartphone. The rise of algorithmic trading and high-frequency trading (HFT) further enhanced liquidity and market depth.
Today, the Indian stock market operates on a T+1 settlement cycle, one of the fastest globally, showcasing its efficiency and readiness for the digital age.
Growth in Market Capitalization and Global Standing
The Indian equity market has grown exponentially in terms of market capitalization. As of 2025, India’s total market capitalization exceeds USD 5 trillion, making it the fifth-largest stock market in the world, surpassing major economies like the UK and France.
Indices such as the Nifty 50 and Sensex have delivered substantial long-term returns, reflecting strong corporate performance and economic growth. The Sensex, which stood at around 1,000 points in 1990, has now crossed 80,000 points, symbolizing the massive wealth creation potential of the Indian market.
India’s rise has also been fueled by inclusion in global investment indices such as the MSCI Emerging Markets Index, which has drawn billions in Foreign Institutional Investor (FII) inflows. Despite global volatility, India’s market remains one of the most resilient, backed by a strong domestic investor base.
The Role of Domestic Investors
One of the most defining features of the Indian stock market’s rise has been the growing participation of domestic investors. Traditionally, Indian households preferred gold, real estate, and fixed deposits as investment avenues. However, over the last decade, a financial literacy wave and increased access to digital investment platforms have encouraged millions to invest in equities and mutual funds.
The number of Demat accounts in India has surged from around 2 crore in 2014 to over 15 crore by 2025. Systematic Investment Plans (SIPs) have become a cultural phenomenon, with monthly inflows surpassing ₹20,000 crore in 2025. This consistent domestic participation provides a stable base of liquidity and reduces dependency on foreign capital.
The rise of retail investors has also changed market dynamics. Retail participation now accounts for over 40% of total trading volume, bringing diversification and depth to the equity market. This broad-based engagement makes the Indian market less vulnerable to foreign outflows during global shocks.
Policy Reforms and Regulatory Strength
The rise of India’s stock market is inseparable from the country’s robust regulatory framework. SEBI, as the watchdog of capital markets, has implemented reforms to ensure transparency, fairness, and investor protection. Key policy initiatives include:
Implementation of Disclosure Norms: Companies are required to disclose financial and operational details regularly to ensure transparency.
Corporate Governance Reforms: The introduction of independent directors, audit committees, and stricter compliance mechanisms has improved trust in listed companies.
Market Surveillance: Advanced monitoring systems detect suspicious trading patterns and insider trading.
Investor Education Programs: SEBI conducts workshops and campaigns to promote financial literacy.
Ease of Listing: The introduction of the SME Platform and Innovators Growth Platform (IGP) enables startups and small enterprises to raise capital efficiently.
Additionally, tax incentives, liberalization of FDI norms, and the establishment of the GIFT City (Gujarat International Finance Tec-City) as an international financial hub have strengthened India’s global appeal.
Integration with Global Markets
India’s integration with global capital markets has been a vital catalyst for its stock market growth. The liberalization of foreign investment norms in the early 1990s allowed Foreign Institutional Investors (FIIs) and Foreign Portfolio Investors (FPIs) to participate actively in Indian equities. Today, FIIs hold a significant share in top Indian companies, contributing to liquidity and global visibility.
Global financial institutions like Goldman Sachs, BlackRock, and Vanguard have a major presence in India. The introduction of GIFT Nifty, an international version of Nifty trading in USD at GIFT City, has further strengthened India’s connection with global investors, allowing round-the-clock trading linked to global time zones.
This global integration not only brings foreign capital but also instills best practices in governance, risk management, and compliance.
Sectoral Growth and Corporate Expansion
The Indian stock market’s rise has been powered by the growth of multiple sectors. The IT sector, led by companies like Infosys, TCS, and Wipro, established India as a global technology hub. The banking and financial services sector has seen massive expansion, driven by private banks and NBFCs. The pharmaceutical, automobile, and energy sectors have also played crucial roles.
The emergence of new-age companies in e-commerce, fintech, and renewable energy—such as Zomato, Paytm, and Adani Green Energy—has diversified the market landscape. India’s start-up ecosystem, now the world’s third-largest, increasingly taps equity markets for funding, reflecting the market’s role in supporting innovation and entrepreneurship.
Impact of Macroeconomic Factors
India’s sustained GDP growth, demographic dividend, and policy stability have all contributed to the stock market’s rise. The country’s young population, rising middle-class consumption, and growing digital economy fuel long-term corporate earnings growth. Additionally, fiscal measures like Goods and Services Tax (GST) and Production Linked Incentive (PLI) schemes have boosted formalization and manufacturing competitiveness.
Even during global crises such as the COVID-19 pandemic, India’s markets rebounded sharply due to monetary support from the Reserve Bank of India (RBI), government stimulus, and strong retail investor confidence. This resilience highlights India’s growing independence from external shocks.
Challenges and Risks Ahead
Despite its remarkable progress, the Indian stock market faces several challenges:
Market Volatility: Global economic uncertainties and geopolitical tensions can trigger sharp fluctuations.
Corporate Governance Issues: While regulations have improved, lapses in governance occasionally erode investor trust.
Valuation Concerns: At times, high valuations raise concerns of speculative bubbles.
Dependence on Policy Support: Excessive reliance on government incentives could distort market efficiency.
Financial Literacy Gap: A significant section of the population still lacks understanding of market risks and diversification.
Addressing these issues is essential to sustain long-term growth and stability.
The Road Ahead
The future of the Indian stock market looks promising. With projections indicating that India could become the third-largest economy by 2030, the equity market is poised to expand further. The government’s continued focus on infrastructure development, digital transformation, and manufacturing growth under initiatives like Make in India will provide significant momentum.
Emerging trends such as sustainable investing (ESG), AI-driven trading analytics, and financial inclusion will define the next phase of growth. Moreover, the deepening of bond markets, REITs, and InvITs will diversify India’s capital market landscape.
If reforms continue and investor education expands, the Indian stock market could well emerge as a global powerhouse, rivaling mature markets in the U.S. and Europe.
Conclusion
The rise of the Indian stock market is a testament to the country’s economic resilience, policy vision, and technological innovation. From a fragmented system in the 1980s to a digital-first, globally integrated marketplace in 2025, India’s equity market has come a long way. It has empowered investors, funded industries, and contributed significantly to national growth.
As India stands on the cusp of becoming a global economic leader, its stock market will continue to play a crucial role—not only as a barometer of economic health but as a driver of wealth creation and innovation. The journey of the Indian stock market is far from over; it is entering a new phase of maturity, global relevance, and inclusiveness that promises a bright financial future for millions of investors and the nation as a whole.
Option Greeks and Advanced Hedging Strategies1. Introduction to Option Greeks
Options are derivative instruments that derive their value from an underlying asset, such as stocks, indices, commodities, or currencies. Unlike equities, the price of an option depends on several factors, including the underlying asset's price, volatility, time to expiration, and interest rates. Option Greeks quantify how sensitive an option’s price is to these variables, offering actionable insights into risk management.
There are five primary Greeks: Delta, Gamma, Theta, Vega, and Rho. Each provides a unique perspective on the risks and potential rewards associated with holding an option. Understanding these Greeks is critical for designing hedging strategies, structuring trades, and managing portfolio exposure.
2. Delta (Δ): Price Sensitivity to the Underlying
Delta measures the sensitivity of an option’s price to a $1 change in the price of the underlying asset. It ranges from 0 to 1 for call options and -1 to 0 for put options.
Call Options: Delta ranges from 0 to +1. A delta of 0.5 implies that if the underlying asset rises by $1, the option’s price will increase by $0.50.
Put Options: Delta ranges from -1 to 0. A delta of -0.5 indicates that a $1 increase in the underlying asset decreases the put option’s price by $0.50.
Delta also represents the probability of an option expiring in-the-money (ITM). For example, a delta of 0.7 suggests a 70% chance of finishing ITM. Traders use delta to gauge directional exposure, and delta can also serve as a foundational element in hedging strategies such as delta-neutral hedging, which will be discussed later.
3. Gamma (Γ): Rate of Change of Delta
Gamma measures the rate of change of delta in response to a $1 change in the underlying asset. While delta provides a linear approximation, gamma accounts for the curvature of option pricing.
High gamma indicates that delta can change significantly with small movements in the underlying asset, which is common for at-the-money (ATM) options nearing expiration.
Low gamma implies more stable delta, typical of deep-in-the-money (ITM) or far-out-of-the-money (OTM) options.
Gamma is crucial for traders managing delta-neutral portfolios. A high gamma position requires frequent rebalancing to maintain neutrality, as the delta shifts rapidly with price movements.
4. Theta (Θ): Time Decay of Options
Theta measures the sensitivity of an option’s price to the passage of time, assuming all other factors remain constant. Time decay is especially significant for options traders, as options lose value as expiration approaches.
Long options (buying calls or puts) have negative theta, meaning they lose value over time.
Short options (selling calls or puts) have positive theta, benefiting from the erosion of time value.
Theta is a critical factor in strategies such as calendar spreads or short straddles, where time decay can be exploited to generate profit.
5. Vega (ν): Sensitivity to Volatility
Vega measures an option’s sensitivity to changes in the volatility of the underlying asset. Volatility reflects market uncertainty; higher volatility increases the probability that an option will expire ITM, thus raising its premium.
Long options benefit from rising volatility (positive vega).
Short options benefit from declining volatility (negative vega).
Understanding vega is essential for strategies like straddles, strangles, and volatility spreads, where traders aim to profit from changes in implied volatility rather than directional price movements.
6. Rho (ρ): Sensitivity to Interest Rates
Rho measures the sensitivity of an option’s price to changes in the risk-free interest rate. While often overlooked in equity options due to low short-term interest rate fluctuations, rho becomes important for long-dated options (LEAPS) or currency options.
Call options increase in value with rising interest rates (positive rho).
Put options decrease in value with rising interest rates (negative rho).
Rho is generally less significant for short-term trading but critical for interest rate-sensitive instruments.
7. Combining Greeks for Holistic Risk Management
Individually, each Greek provides insight into one risk factor. However, professional traders consider them collectively to understand an option's total risk profile.
Delta addresses directional risk.
Gamma adjusts for changes in delta.
Theta manages time decay exposure.
Vega quantifies volatility risk.
Rho handles interest rate risk.
By monitoring these Greeks, traders can develop robust hedging strategies that dynamically adjust to market conditions.
8. Advanced Hedging Strategies
Hedging in options trading involves taking positions that offset risk in an underlying asset or portfolio. Advanced strategies often combine multiple Greeks to achieve delta-neutral, gamma-neutral, or vega-sensitive hedges, minimizing exposure to adverse market movements.
8.1 Delta-Neutral Hedging
Delta-neutral strategies aim to neutralize the directional exposure of a portfolio. Traders adjust their positions in the underlying asset or options to achieve a net delta of zero.
Example: Holding a long call option (delta = 0.6) and shorting 60 shares of the underlying stock (delta = -1 per share) results in a delta-neutral position.
Benefits: Protects against small price movements, ideal for traders who want to profit from volatility or time decay.
Limitations: Requires frequent rebalancing, especially with high gamma positions.
8.2 Gamma Hedging
Gamma hedging focuses on controlling the rate of change of delta. High gamma positions can result in delta swings, exposing traders to unexpected losses.
Traders achieve gamma neutrality by combining options with offsetting gamma values.
Example: A long ATM call (high gamma) may be hedged with OTM calls or puts to stabilize delta changes.
Benefits: Provides stability for delta-neutral portfolios.
Limitations: Complex to implement and can involve high transaction costs.
8.3 Vega Hedging
Vega hedging mitigates volatility risk. Traders who expect volatility to fall may sell options (short vega) while hedging long options (positive vega) to offset exposure.
Example: A trader long on an option may sell a different option with similar vega exposure to create a neutral vega position.
Benefits: Protects against unexpected spikes or drops in implied volatility.
Limitations: Requires deep understanding of options pricing and volatility behavior.
8.4 Theta Management and Calendar Spreads
Theta management involves leveraging time decay to generate income while maintaining a controlled risk profile.
Calendar spreads involve buying long-dated options and selling short-dated options on the same underlying asset.
Traders profit as the short-term option decays faster than the long-term option, benefiting from positive theta differential.
Benefits: Generates steady income and exploits time decay patterns.
Limitations: Sensitive to volatility changes, requiring careful vega management.
8.5 Multi-Greek Hedging
Professional traders often hedge portfolios using combinations of Greeks to achieve a multi-dimensional hedge.
Delta-Gamma-Vega Hedging: Neutralizes directional risk, delta swings, and volatility exposure simultaneously.
Useful for institutional traders managing large, complex portfolios where single-Greek hedges are insufficient.
Requires continuous monitoring and dynamic rebalancing to adapt to changing market conditions.
9. Practical Considerations in Hedging
While advanced Greek-based hedging strategies offer theoretical precision, practical implementation involves challenges:
Transaction Costs: Frequent rebalancing and multiple trades can reduce profitability.
Liquidity Risk: Some options may lack sufficient market liquidity, complicating execution.
Model Risk: Greeks are derived from mathematical models like Black-Scholes; real-world deviations can affect hedging effectiveness.
Market Gaps: Sudden, large price moves may bypass delta or gamma adjustments, leading to losses.
Traders must weigh the trade-offs between hedge precision and operational feasibility.
10. Real-World Applications
Option Greeks and hedging strategies are widely used in various contexts:
Institutional Portfolios: Delta-gamma-vega hedges protect large portfolios from market shocks.
Volatility Trading: Traders exploit implied vs. realized volatility differences using vega strategies.
Income Generation: Theta-positive strategies like covered calls and credit spreads provide steady cash flows.
Risk Management: Corporations with exposure to commodity prices or foreign exchange rates use option hedges to stabilize earnings.
11. Conclusion
Option Greeks are indispensable tools for understanding and managing the risks inherent in options trading. They provide a quantitative framework for measuring price sensitivity to underlying asset movements, time decay, volatility changes, and interest rates. Advanced hedging strategies leverage these Greeks to create positions that mitigate directional, volatility, and time-related risks.
While Greek-based hedging can be complex, the benefits are substantial: enhanced risk control, improved portfolio stability, and the ability to profit in diverse market conditions. Success requires a deep understanding of each Greek, continuous monitoring of market dynamics, and a disciplined approach to portfolio management. By mastering Option Greeks and advanced hedging strategies, traders gain a powerful edge in navigating the sophisticated world of derivatives trading.
Buy Opportunity in USOILAn upside opportunity is being developed. Scenario.
1. Choch has happened and price retracing towards FVG.
2. it is also taking support from trendlines.
3. If price rejects with volume in FVG zone, it may lead to good upside trade.
P.s. - It is just analysis not trading recommendation.

Reversal trade in BTCBTC seems taking reversal on 4H chart after creating a W pattern, breaking it, pull back and move in the direction.
it may high RnR trade.
P.S. - this is just a technical analysis not a trade advice.

1H USDCHF reversal buy tradeHere is a good opportunity in USDCHF 1 hour time frame. Price has returned to the confluence of trendline and resistance of W.
there my be and opportunity if price show rejection at this confluence and supported with value.
this may be a good and high RnR opportunity if things move as per plan.

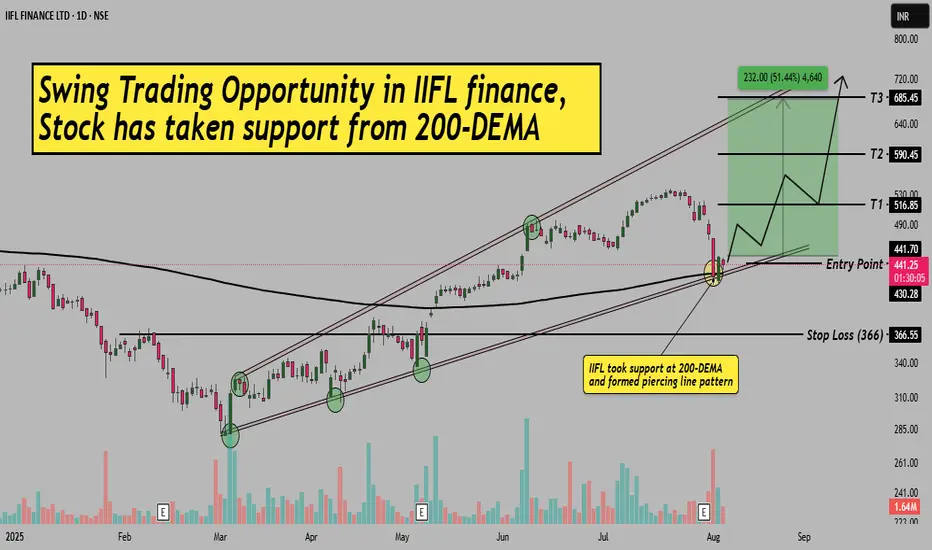
IIFL Finance–Swing Setup from 200-DEMA Support & Piercing Line!Hello Everyone, I hope you all are doing well in life and in trading!
Today I’ve brought a fresh swing trading opportunity in IIFL Finance , where the stock has taken support from the 200-EMA and is formed a bullish Piercing Line pattern.
After a strong uptrend, the stock corrected and has now taken trendline support (from channel base) along with the 200-day EMA confluence, a high-probability reversal zone. A clear bullish candle indicates a potential bounce from here.
The best part? The stock still offers a great risk-reward with defined entry, stop-loss, and 3 possible targets. Please refer to the chart for full trade setup details.
This setup is purely based on price action, moving average confluence, and support zone behavior.
If you are a swing or positional trader, this setup is worth keeping on your radar!
If you found this helpful, don’t forget to LIKE & FOLLOW for more such clean technical ideas.
Disclaimer: This idea is for educational purposes only. Always do your own research before taking trades.
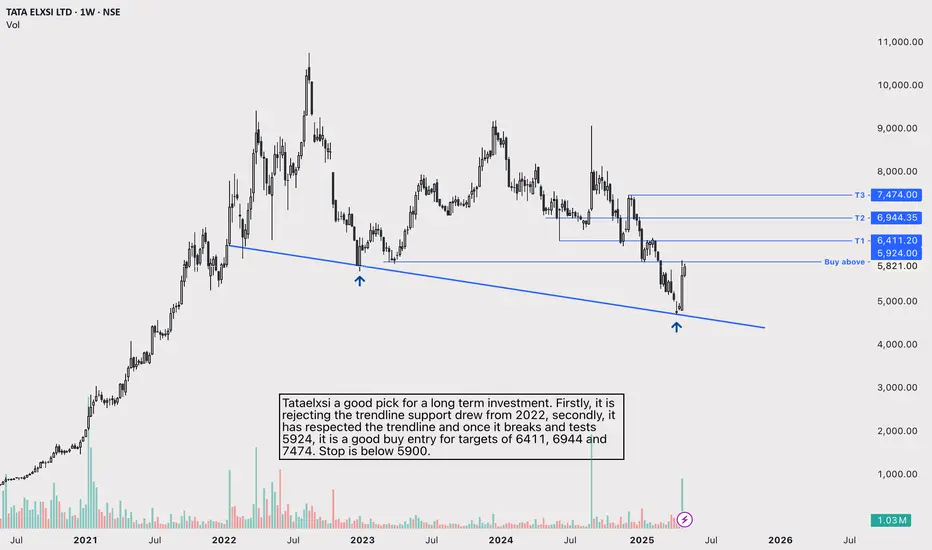
Bullish setup for TATAELXSITataelxsi a good pick for a long term investment. Firstly, it is rejecting the trendline support drew from 2022, secondly, it has respected the trendline and once it breaks and tests 5924, it is a good buy entry for targets of 6411, 6944 and 7474. Stop is below 5900.
New Gen a low risk good reward setup.#Newgensoftware.
Looks promising.
- At trendline support.
- Good RR setup.
-Pull-back volume is low.
-Risk is 10%
❗️It is trading right below 50 DMA.
❗️Market is still sell on the rise.
Trade with limited quantity. Most of the setups are prone to failure in such market conditions. Add this to your WL and study.
The chart is shared only for educational purposes only.

Trendline bounce in Bank of BarodaNSE:BANKBARODA A trendline retracement has occurred, with EMA 44 crossing over, which indicates the stock's bullishness.
Buy at the current level with the SL at the swing low for the first target of 280 and subsequent targets by trailing.

KOTAK MAHINDRA BANK - Breakout LongPrice consolidating since 2021 and it breakout the triangle now. Also, price rise from the black colour trendline which respected since 2014. Good Time to enter in this Large Cap.

Banknifty Analysis : Market Respect the Trendline & Target R1,R2Banknifty Analysis in Higher Time Frame shows that the Market Respects the Trendline, indicating a potential continuation of Uptrend with Targets at R1and R2. If the Market closes above R1, the Next Target is R2.

Tatapower-More power in bull run pending?Tata power is ready to give breakout of ATH. Stock has bounced from trendline support and might continue the bull run in coming weeks.
However, since market is overstretched, keep booking profits quickly.
Keep in watchlist. Not a recommendation


GNFC - Bullish Swing Reversal with VolumesNSE: GNFC is closing with a bullish swing reversal candle supported with volumes.
Today's volumes and candlestick formation indicates strong demand and stock should move to previous swing highs in the coming days.
The stock has been moving along the horizontal and trendline support for the past few days which is indicating demand.
One can look for a 13% to 20% gain on deployed capital in this swing trade.
The view is to be discarded in the event of the stock breaking previous swing low.
#NSEindia #Trading #StockMarketindia #Tradingview #SwingTrade

Good stockStock details are mentioned in chart
Go through chart analysis
We never recommend stock to buy and sell
Target and Stop loss also in chart

JSW STEEL- Bull run 2.0?We have seen an amazing bull run in JSWSteel during the metal sector rally of 2020-21.
Since then, stock has been consolidating with 770-780 acting as a strong supply zone for the stock.
However, the stock has recently taken support from a 3 year old trendline and currently standing at the same supply zone.
If the stock manages to sustain above 780-800 for a couple of weeks , it will confirm a breakout of a flag consolidation and we can expect Bull run 2.0 in this stock as well as other metal sector stocks.
Note:- Metal sectors are cyclical in nature. Please invest/trade accordingly. This idea is shared for educational purposes only and should not be taken as a recommendation.
