Part 8 Trading Master Class With ExpertsTypes of Options Based on Exercise Style
Options can also differ based on when they can be exercised:
American Options: Can be exercised any time before expiry (used in U.S. markets).
European Options: Can only be exercised on the expiry date (common in India and Europe).
On Indian exchanges like NSE, most index and stock options are European-style.
Trend Line Break

Part 7 Trading Master Class With Experts Option Pricing: Understanding the Premium
Option prices are determined by several variables, most famously modeled using the Black-Scholes formula. The main components are:
Underlying Price: The current price of the asset.
Strike Price: The agreed-upon price for the option.
Time to Expiry: Longer durations increase premium due to higher uncertainty.
Volatility: Measures how much the underlying asset’s price fluctuates; higher volatility increases option prices.
Interest Rates and Dividends: Minor but relevant factors affecting option pricing.
Option premium = Intrinsic Value + Time Value
As expiration approaches, the time value declines—this is called time decay (Theta). This is why option sellers often benefit from the passage of time if prices remain stable.

Part 6 Learn Institutional Trading How Option Trading Works
When you trade options, there are two sides to every contract: the buyer and the seller.
Option Buyer: Pays the premium for the right to exercise the option. Their risk is limited to the premium paid but potential profit is unlimited (in calls) or substantial (in puts).
Option Seller (Writer): Receives the premium upfront but assumes an obligation if the buyer exercises the option. Their potential loss can be large, depending on market movement.
For example:
Let’s say stock XYZ is trading at ₹100.
You buy a call option with a strike price of ₹105, paying a premium of ₹3.
If XYZ rises to ₹115 before expiry, your profit = (115 – 105) – 3 = ₹7 per share.
If it stays below ₹105, your loss is limited to ₹3 (the premium paid).

Part 4 Learn Institutional Trading Key Terminology in Option Trading
To understand options, one must be familiar with some basic terms:
Underlying Asset: The instrument on which the option is based (e.g., stock, index, or commodity).
Strike Price: The price at which the option holder can buy (call) or sell (put) the asset.
Premium: The cost paid by the option buyer to acquire the contract.
Expiration Date: The date when the option contract becomes void.
In-the-Money (ITM): A call option is ITM when the underlying price is above the strike; a put is ITM when the price is below the strike.
Out-of-the-Money (OTM): The opposite of ITM. The call option has no intrinsic value when the price is below the strike; a put option has none when the price is above the strike.
At-the-Money (ATM): When the underlying price and strike price are nearly equal.
Intrinsic Value: The actual profit if the option were exercised immediately.
Time Value: The portion of the premium that reflects the probability of the option gaining value before expiry.

Part 3 Learn Institutional Trading What Are Options?
An option is a derivative contract whose value is derived from an underlying asset such as a stock, index, commodity, or currency. The buyer of an option pays a premium to the seller (also called the writer) for the right—but not the obligation—to execute the trade under specified terms.
There are two main types of options:
Call Option: Gives the buyer the right to buy the underlying asset at a fixed price (called the strike price) before or on the expiry date.
Put Option: Gives the buyer the right to sell the underlying asset at the strike price before or on the expiry date.
These contracts can be traded on exchanges (like NSE, BSE, CBOE) or over-the-counter (OTC).

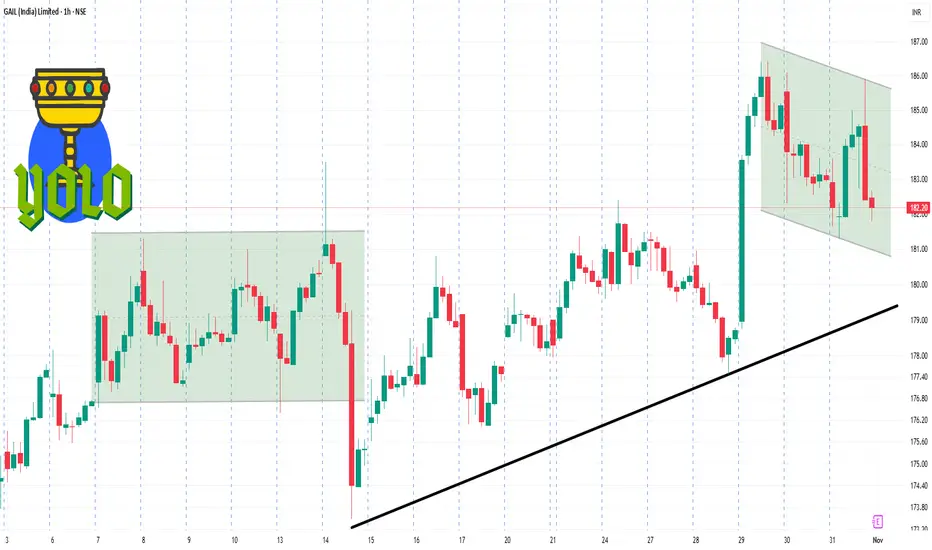
GAIL 1 Hour Time Frame✅ Key Levels
Resistance zone: ~ ₹186-₹190 — the stock recently tried to challenge this region (see intraday high ~₹191 in some sessions).
Support zone: ~ ₹174-₹176 — the lower bound of recent trading range (Moneycontrol shows recent low ~₹174.64).
Intermediate pivot: ~ ₹180-₹182 — currently acting as the mid-zone / equilibrium in 1-hour structure.
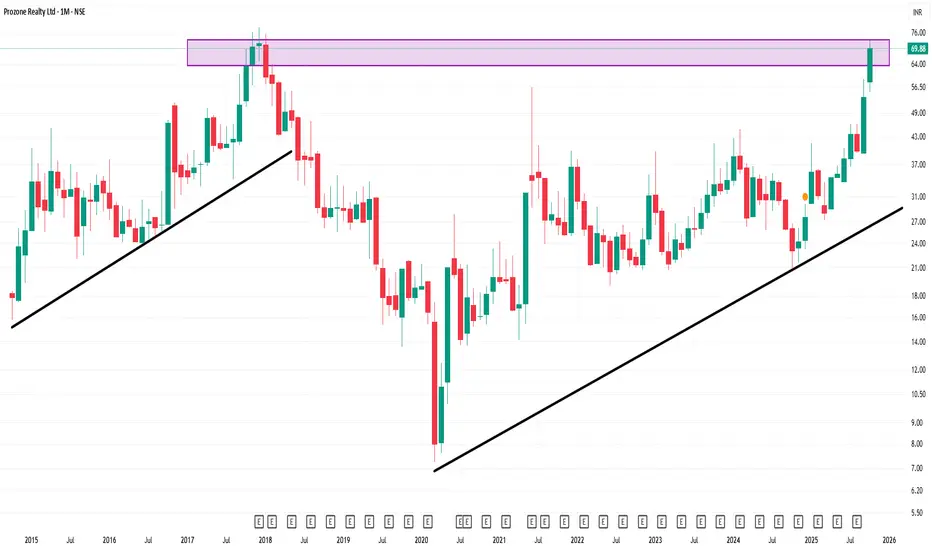
PROZONE 1 Month Time Frame ✅ Key Data Snapshot
Current quoted price: ~ ₹62.87.
52-week range: approximately ₹20.91 – ₹68.18.
Fundamental state: The company has had losses (negative EPS), modest margins in recent Q1 (net profit ₹0.73 cr vs prior loss) but fundamentals are still weak.
Technical / momentum: Recent 1-month return reported ~ +33.95% (per ET) suggesting strong short-term momentum.
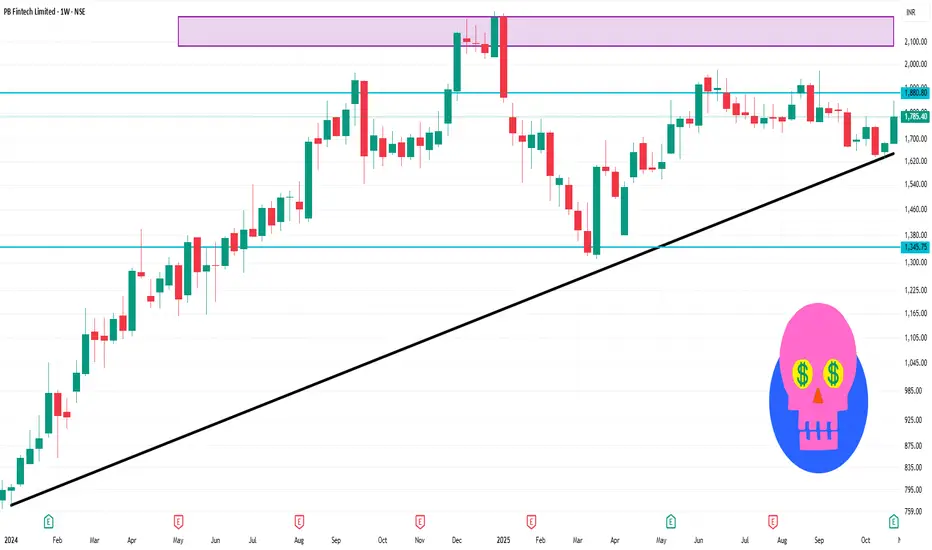
POLICYBZR 1 Week Time Frame 📊 Key levels & structure
Based on current weekly chart readings, recent pivot data and visible support/resistance zones:
Resistance zone: ~ ₹1,775-1,825 — price has been tested around this area, acting as a cap.
Support zone: ~ ₹1,650-1,620 — key lower bounds that have held in recent pullbacks.
Intermediate pivot / trigger area: ~ ₹1,700-₹1,740 — if this area gives way, next leg down could accelerate; if it holds, potential bounce.
Weekly trend: The stock is below its 50- and 200-week moving averages, signalling caution for bulls.
Momentum: RSI in mid‐range, ADX weak, so trend strength is moderate.
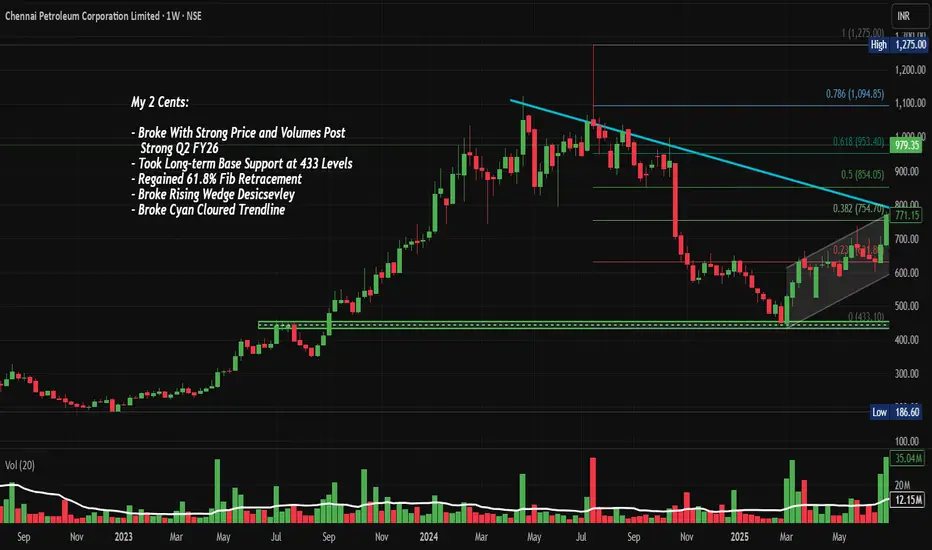
ChennaiPetro: Wedge & Trendline BO with 61.8%, Chart of the WeekNSE:CHENNPETRO Explosive Breakout: Why This Refinery Stock Could Rally Another 30% After Its Q2 Turnaround. This PSU Refinery Stock Broke Through ₹979 Levels - Here's What Traders Need to Know About the Next Move. Let's Analyse in our Chart of the Week Below.
As per the Latest SEBI Mandate, this isn't a Trading/Investment RECOMMENDATION nor for Educational Purposes; it is just for Informational purposes only. The chart data used is 3 Months old, as Showing Live Chart Data is not allowed according to the New SEBI Mandate.
Disclaimer: "I am not a SEBI REGISTERED RESEARCH ANALYST AND INVESTMENT ADVISER."
This analysis is intended solely for informational purposes and should not be interpreted as financial advice. It is advisable to consult a qualified financial advisor or conduct thorough research before making investment decisions.
Price Action Analysis:
Trend Structure and Momentum:
- The stock experienced a prolonged uptrend from March 2023 to July 2024, rallying from base levels around ₹433 to a peak of ₹1,275, representing approximately 195% appreciation
- Post the July 2024 peak, the stock entered a corrective phase characterised by lower highs and consolidation
- Recent price action shows a breakout above the descending cyan trendline that had been capping rallies since mid-2024
- Current price of ₹979.35 (as of October 31, 2025) represents a 26.80% gain, indicating strong buying momentum
- The stock is trading above all key Fibonacci retracement levels, having reclaimed the 61.8% level at approximately ₹953
Candlestick Patterns and Formations:
- The most recent candle shows a strong bullish close with a substantial body, indicating conviction in the upward move
- The chart displays a rising wedge/descending channel pattern that was broken decisively in recent sessions
- Prior consolidation between ₹700-₹850 formed a re-accumulation base, which has now been breached to the upside
- The breakout candle demonstrates strong price and volume expansion, a classic sign of institutional participation
Volume Spread Analysis:
Volume Characteristics:
- Recent volume surge to 90.39 million shares significantly exceeds the average volume of 13.46 million, representing approximately 6.7x normal trading activity
- The volume spike coincides with the price breakout, validating the move as genuine rather than a false breakout
- Historical volume analysis shows similar spikes during major trend reversals, particularly during the March 2023 base breakout
- Volume expansion without corresponding price weakness suggests strong demand absorption at current levels
Volume-Price Relationship:
- The volume profile indicates heavy accumulation in the ₹700-₹800 zone, which now serves as a critical support cluster
- Recent sessions show sustained above-average volume, suggesting institutional interest rather than retail speculation
- The volume pattern aligns with a classic "breakout with expansion" scenario, increasing the probability of trend continuation
Support and Resistance Levels:
Key Support Zones:
- Primary Support (S1): ₹854 - This represents the 0.5 Fibonacci retracement level and previous consolidation high
- Secondary Support (S2): ₹754 - The 0.382 Fibonacci level and recent breakout point from the descending trendline
- Critical Support (S3): ₹631 - The 0.236 Fibonacci level and long-term base support at ₹433-₹450 zone
- The grey trendline originating from the 2024 lows provides dynamic support, currently positioned around ₹720
Key Resistance Zones:
- Immediate Resistance (R1): ₹1,094 - The 0.786 Fibonacci retracement level
- Major Resistance (R2): ₹1,275 - The all-time high achieved in July 2024 and psychological resistance
- Extended Resistance (R3): ₹1,400-₹1,500 - Projected based on measured move from the consolidation range
Technical Patterns and Indicators:
Chart Patterns:
- Descending Channel Breakout: The stock has successfully breached the cyan-colored descending trendline that acted as resistance since July 2024
- Rising Wedge Resolution: The consolidation pattern between August and October 2025 has resolved to the upside
- Base-on-Base Formation: The ₹433 level established in early 2024 served as the foundation for the subsequent rally, demonstrating strong long-term base support
- Cup and Handle (Potential): If the stock consolidates between ₹950-₹1,050 and then breaks out, it could form a cup and handle pattern projecting toward ₹1,400+
Fibonacci Analysis:
- The 61.8% Fibonacci retracement at ₹953 has been convincingly reclaimed, suggesting the corrective phase may be complete
- Golden ratio support held perfectly during the September-October consolidation
- The next Fibonacci target at 0.786 (₹1,094) represents the immediate upside objective
- Fibonacci extension levels project Upmove at ₹1,350 (1.272 extension) and ₹1,500 (1.618 extension) if the rally extends
Risk Factors and Invalidation Levels:
- A close below ₹920 would signal a potential false breakout
- Sustained trading below ₹850 would invalidate the bullish setup and suggest resumption of the downtrend
- Weekly close below the broken trendline (currently around ₹940) would be a bearish reversal signal
- Failure to maintain above 61.8% Fibonacci retracement could trigger another corrective leg
Fundamental and Sectoral Backdrop:
Company Fundamentals:
- Chennai Petroleum Corporation (CPCL) reported Q2 FY26 revenue of ₹16,327 crore with profit after tax of ₹719 crore
- The company achieved a crude throughput of 3.013 million metric tonnes (MMT) with a Gross Refining Margin (GRM) of $9.04 per barrel in Q2 FY26
- However, Q1 FY26 saw challenges with a net loss of ₹40 crore compared to a profit of ₹357 crore in Q1 FY25, primarily due to inventory losses and lower GRM of $3.22 per barrel
- For H1 FY26, CPCL recorded net profit of ₹689.68 crore versus a net loss of ₹294.45 crore in H1 FY25, with average GRM at $6.17 per barrel
- The company achieved a record crude throughput of 11.642 MMT with 111% capacity utilisation
Business Operations and Product Portfolio:
- CPCL is engaged in refining crude oil to produce various petroleum products, including LPG, Motor Spirit, Kerosene, Aviation Turbine Fuel, High Speed Diesel, Naphtha, Fuel Oil, and Bitumen
- The company also produces speciality products like Paraffin Wax, Mineral Turpentine Oil, Hexane, and Petrochemical feedstocks
- Most fuel products are marketed by the parent company, Indian Oil Corporation (IOC), while CPCL directly markets speciality products
- In 2024, CPCL commissioned new infrastructure, including Pharma Grade Hexane production and Sustainable Aviation Fuel
Financial Metrics and Valuation:
- Market capitalisation stands at approximately ₹14,584 crore, with the company maintaining a healthy dividend payout of 35%
- CPCL has demonstrated strong return on equity with a 3-year ROE of 31% and has reduced debt levels
- Current price-to-earnings and other valuation metrics suggest the stock is reasonably valued considering sectoral challenges
Sector Outlook and Industry Trends:
- India's refining capacity increased to 258.1 MMTPA as of FY25, with domestic consumption at 239.2 MMTPA
- India is expected to drive global oil demand growth, with consumption projected at 5.74 million barrels per day in 2025 and 5.99 million bpd in 2026
- The country plans to expand refining capacity to 309.5 MMTPA by 2028
- Refinery output has been strong, with manufacturing IIP for refined petroleum products rising 4.24% in June 2025, driven by auto-fuel demand growth of 7.9% year-on-year
- However, refining margins are expected to fall below mid-cycle levels in FY25, indicating potential profitability challenges
Opportunities and Challenges:
Opportunities:
- Downstream activities driven by refinery-petrochemical integration are projected to post the highest 5.2% CAGR through 2030
- Growing domestic demand for petroleum products with urbanisation and economic growth
- Government initiatives supporting energy infrastructure development
- Indian refiners have benefited from processing discounted Russian crude, generating significant margins
Challenges:
- Net profit declined for the last two quarters, with an average decrease of 108.5% per quarter, and revenue fell 14.1% per quarter
- Volatile crude oil prices and fluctuating gross refining margins
- India's domestic crude oil production has fallen 26.3% and natural gas by 24.1% during FY12-FY25, leading to increased import dependency
- Environmental regulations and pressure to transition toward cleaner energy
- Institutional investment in CPCL decreased by 37.83% over the past 30 days
Competitive Position:
- CPCL is a subsidiary of Indian Oil Corporation, providing strategic advantages in product marketing and distribution
- The company competes with major refiners, including Reliance Industries, Bharat Petroleum, Hindustan Petroleum, and Mangalore Refinery
- CPCL's core vision is to be the most admired Indian energy company, creating value through world-class performance and ethical governance
- The company's location in South India provides strategic advantages for serving the region's growing energy needs
Fundamental Risks:
- The stock trades at reasonable valuations with potential upside to fair value estimates around ₹1,050
- Strong Q2 performance suggests earnings momentum is improving after a weak Q1
- Sectoral tailwinds from growing domestic demand support medium-term prospects
- Key risks include GRM volatility, crude price fluctuations, and regulatory changes
My 2 Cents:
- CPCL presents a compelling technical setup following the breakout from a multi-month consolidation pattern
- The combination of volume expansion, Fibonacci support, and trendline breach suggests potential for further upside
- Risk management is critical given sectoral volatility; strict adherence to stop losses is recommended
Full Coverage on my Newsletter this Week
Keep in the Watchlist and DOYR.
NO RECO. For Buy/Sell.
📌Thank you for exploring my idea! I hope you found it valuable.
🙏FOLLOW for more
👍BOOST if you found it useful.
✍️COMMENT below with your views.
Meanwhile, check out my other stock ideas on the right side until this trade is activated. I would love your feedback.
As per the Latest SEBI Mandate, this isn't a Trading/Investment RECOMMENDATION nor for Educational Purposes; it is just for Informational purposes only. The chart data used is 3 Months old, as Showing Live Chart Data is not allowed according to the New SEBI Mandate.
Disclaimer: "I am not a SEBI REGISTERED RESEARCH ANALYST AND INVESTMENT ADVISER."
This analysis is intended solely for informational purposes and should not be interpreted as financial advice. It is advisable to consult a qualified financial advisor or conduct thorough research before making investment decisions.
Intraday and Scalping Strategies: Mastering Short-Term Trading1. Introduction
In the fast-paced world of stock trading, two of the most active and adrenaline-filled approaches are intraday trading and scalping. These trading styles revolve around capturing small price movements within the same trading session—without holding positions overnight. Traders using these methods aim to exploit market volatility, volume spikes, and short-term trends to generate profits.
While both intraday and scalping share the same principle—quick trades—they differ in timeframes, position sizes, and profit expectations. Intraday traders hold positions for minutes to hours, while scalpers operate on a much shorter horizon, often seconds or a few minutes. Success in these methods requires discipline, technical analysis mastery, and a deep understanding of market structure and momentum.
2. Understanding Intraday Trading
Definition
Intraday trading, also known as day trading, involves buying and selling financial instruments—such as stocks, indices, commodities, or forex—within a single trading day. Traders aim to profit from short-term price fluctuations without carrying overnight risk.
Objective
The core objective of intraday trading is to capitalize on daily volatility. Traders focus on price action, news-driven moves, and liquidity zones to identify opportunities.
Timeframe
Intraday traders typically use charts ranging from 1-minute to 15-minute intervals for entries and exits, while analyzing higher timeframes like the 1-hour or 4-hour chart for overall trend direction.
3. The Mechanics of Intraday Trading
a. Market Selection
Intraday traders prefer stocks or instruments that have:
High liquidity (easy entry and exit)
Volatility (to create meaningful price movements)
Strong volume participation
For example, large-cap stocks, index futures (like NIFTY, BANK NIFTY), and active currency pairs (like EUR/USD) are common choices.
b. Time of Entry
The most volatile and profitable intraday periods are:
Opening hour (9:15–10:30 AM IST) – when overnight news is absorbed.
Closing hour (2:30–3:30 PM IST) – as institutional traders adjust their positions.
c. Leverage
Intraday traders often use margin trading, which magnifies both profits and risks. For instance, with 5x leverage, a 1% move can yield a 5% profit—or loss.
d. Tools and Indicators
Some of the most popular technical tools used by intraday traders include:
Moving Averages (MA): Identifying short-term trend direction.
VWAP (Volume Weighted Average Price): Used as an intraday benchmark.
MACD & RSI: Momentum indicators signaling strength or weakness.
Support and Resistance Levels: Key zones where price often reacts.
Volume Profile: To identify price levels with maximum trading activity.
4. Popular Intraday Trading Strategies
a. Momentum Trading
Momentum traders seek stocks that are moving strongly in one direction with high volume. The goal is to “ride the momentum” until signs of reversal appear.
Example:
If a stock breaks above a key resistance with high volume, a trader may buy with a stop-loss below the breakout level.
b. Breakout Trading
This strategy focuses on entering positions when the price breaks through well-defined support or resistance levels.
Entry: When price closes above resistance or below support.
Stop-loss: Just outside the breakout zone.
Target: Based on previous swing or risk-reward ratio (often 1:2).
c. Reversal Trading
Contrarian traders look for signs that a trend is about to reverse, such as:
Divergences in RSI or MACD
Candlestick reversal patterns (e.g., hammer, shooting star)
Volume exhaustion
d. Gap Trading
Traders exploit price gaps created by overnight news, earnings, or global cues. For example:
Gap-up open: Short if the stock fails to hold early gains.
Gap-down open: Buy if the price recovers with strong volume.
e. VWAP Strategy
The VWAP line acts as a fair value indicator for intraday traders.
Above VWAP: Indicates bullish bias.
Below VWAP: Indicates bearish bias.
Institutional traders often use VWAP to execute large orders efficiently.
5. Understanding Scalping
Definition
Scalping is the fastest form of trading, involving dozens—or even hundreds—of trades within a single session. Scalpers aim to capture tiny profits (5–10 paise or a few ticks) multiple times throughout the day.
Objective
The goal is to exploit micro-price movements and order flow inefficiencies. Scalpers rely on high liquidity and rapid execution rather than large price swings.
Timeframe
Scalpers operate in seconds to a few minutes. They rely heavily on 1-minute charts, tick charts, and order book depth for decision-making.
6. Key Principles of Scalping
a. Speed and Precision
Scalpers depend on fast execution and tight spreads. Even a few seconds of delay can turn a winning trade into a loss.
b. Small Targets, Strict Stops
A scalper might target 0.05–0.2% profit per trade with equally small stop-losses.
The focus is on high accuracy and consistency rather than big gains.
c. High Trade Frequency
Scalpers execute many trades in a session. For example, if a trader makes 50 trades with a ₹100 average profit, total profit = ₹5,000.
d. Leverage Usage
Because profits per trade are small, scalpers often use higher leverage—but this also magnifies risk.
e. Market Depth Analysis
Scalpers monitor Level II data (order book) to anticipate short-term imbalances in buying and selling pressure.
7. Popular Scalping Techniques
a. Bid-Ask Spread Scalping
Traders take advantage of the small difference between the bid and ask prices.
This method requires ultra-fast execution and often direct market access (DMA) platforms.
b. Moving Average Cross Scalping
Uses two short-term moving averages (e.g., 9 EMA and 21 EMA):
Buy signal: When shorter EMA crosses above longer EMA.
Sell signal: When it crosses below.
c. Price Action Scalping
Relies purely on candlestick patterns and support/resistance zones without indicators. Traders look for micro-trends or breakout candles for quick entries.
d. News-Based Scalping
During economic releases (like inflation data, RBI announcements, or Fed decisions), markets become volatile. Scalpers exploit rapid price moves right after such events.
e. Range Scalping
When markets move sideways, scalpers buy at the bottom of the range and sell near the top repeatedly—profiting from oscillations.
8. Tools and Platforms for Scalping and Intraday Trading
Both strategies demand real-time precision, so traders rely on:
Advanced charting platforms: TradingView, MetaTrader, ThinkorSwim, Zerodha Kite, etc.
Fast order execution: Brokers offering low-latency trading.
Level II data & market depth: To analyze liquidity zones.
Hotkeys and algorithms: For instant order placement.
High-speed internet and dual-screen setups are common among serious intraday traders.
9. Risk Management: The Heart of Short-Term Trading
Both intraday and scalping strategies can yield consistent returns—but only with strict risk control.
Key Rules:
Use Stop-Losses: Never trade without predefined exits.
Position Sizing: Risk only 1–2% of total capital per trade.
Avoid Overtrading: Stick to your setup; don’t chase losses.
Set Daily Limits: Stop trading after hitting max loss or profit goals.
Control Emotions: Greed and fear are the biggest threats in short-term trading.
Risk-Reward Example:
If your stop-loss is ₹2 and target is ₹4, you maintain a 1:2 ratio. Even with 50% accuracy, you remain profitable.
10. Psychology Behind Short-Term Trading
Scalping and intraday trading test a trader’s discipline and emotional control. Success depends not only on strategy but also on mindset:
Patience: Waiting for perfect setups.
Emotional neutrality: No excitement after wins or frustration after losses.
Focus: Constant screen time and attention to detail.
Adaptability: Changing tactics as market conditions shift.
A calm, rule-based approach outperforms impulsive decision-making every time.
11. Best Practices for Successful Execution
Start Small: Begin with small capital and low-risk trades.
Backtest Strategies: Analyze performance on historical data.
Journal Every Trade: Record reasons, outcomes, and emotions.
Avoid News Noise: Focus on technical levels, not random headlines.
Improve Continuously: Refine setups based on win-rate analysis.
12. Combining Scalping and Intraday Approaches
Some professional traders blend both:
Use scalping during volatile periods (opening or news hours).
Use intraday swing trades during calmer, trend-driven phases.
This hybrid model balances frequency and profitability—allowing flexibility based on volatility and market mood.
Conclusion
Intraday and scalping strategies offer exciting opportunities to profit from short-term market movements. They demand speed, discipline, and sharp technical skills. Unlike long-term investing, where time cushions errors, intraday and scalping reward precision and risk management.
The secret to mastering these techniques lies not in trading more, but in trading smart—with a consistent plan, strict stops, and psychological balance. For those willing to put in the effort, the art of short-term trading can become both a profitable skill and a professional edge.
Smart Money Concepts (SMC) and Institutional Order Flow1. Introduction: Understanding the Market Beyond Retail Noise
Most retail traders lose money not because they lack effort but because they follow the market’s surface moves rather than its hidden intentions. Price charts show what has already happened — but Smart Money Concepts (SMC) and Institutional Order Flow reveal why it happened.
SMC is a modern trading framework built on the idea that large institutions, hedge funds, and banks — the so-called “smart money” — drive market trends. Their goal is not to “trade” but to accumulate and distribute liquidity. Retail traders, often unknowingly, provide that liquidity.
SMC teaches traders how to identify where institutional players are entering and exiting positions. It focuses on understanding liquidity, market structure, order blocks, and the psychology of accumulation and manipulation.
2. The Foundation of Smart Money Concepts
Smart Money Concepts evolved from the teachings of ICT (Inner Circle Trader) and Wyckoff theory. It blends market structure analysis, liquidity theory, and institutional footprints into a unified framework.
At its core, SMC assumes that the market moves through a cycle driven by institutional intentions:
Accumulation – Smart money builds long positions quietly.
Manipulation (Stop Hunt) – Price is driven below or above key levels to trigger liquidity.
Distribution (Expansion) – Price moves strongly in the intended direction.
Re-Accumulation or Redistribution – Trend continuation or reversal zones form.
The retail mindset looks for patterns (double tops, indicators), but SMC looks for intentions — where smart money must buy or sell to fill massive orders.
3. The Core Principles of Smart Money Concepts
A. Market Structure
Market structure is the backbone of SMC. It identifies the direction of institutional order flow — whether the market is making higher highs and higher lows (bullish) or lower highs and lower lows (bearish).
Key structural elements include:
BOS (Break of Structure) – When price breaks the previous swing high or low, signaling a continuation.
CHOCH (Change of Character) – A shift from bullish to bearish structure (or vice versa), often indicating a reversal.
Market structure shows where institutions are likely to transition from accumulation to expansion phases.
B. Liquidity
Liquidity refers to clusters of orders resting at obvious levels — such as stop-losses above swing highs or below swing lows. Institutions need liquidity to fill large positions, so they manipulate price toward these zones.
Common liquidity pools include:
Equal Highs/Lows – Where stop orders are concentrated.
Trendline Liquidity – Price repeatedly bounces off a line, attracting more retail traders.
Session Highs/Lows – Intraday liquidity pools, especially during London and New York sessions.
Once these areas are raided, the true move — aligned with institutional direction — often begins.
C. Order Blocks
An order block (OB) is the last opposite candle before an impulsive move. It represents the footprint of institutional accumulation (in bullish moves) or distribution (in bearish moves).
Types:
Bullish Order Block – The last bearish candle before a strong bullish push.
Bearish Order Block – The last bullish candle before a strong bearish drop.
Price often retraces to these OBs to “rebalance” before continuing. They act as institutional zones of interest.
D. Imbalance or Fair Value Gaps (FVG)
When price moves aggressively in one direction, it can leave behind an imbalance — a region with unfilled orders. These are inefficiencies institutions may later revisit to complete their transactions.
In SMC, traders look for FVG retracements as potential entries when the overall structure aligns with institutional direction.
E. Inducement
Before price reaches an order block or liquidity pool, it often creates smaller “bait” structures — inducements — to trap early traders. For example, a mini double-top before a liquidity sweep ensures enough orders are available for institutions to enter.
4. Institutional Order Flow: The Engine Behind SMC
Order flow represents the sequence and intention of institutional buying and selling. Unlike retail traders who react to indicators, institutions plan their trades around liquidity collection.
Here’s how order flow unfolds institutionally:
Position Building (Accumulation) – Institutions buy/sell in fragments at key zones, keeping price within a range.
Liquidity Engineering – They allow retail traders to establish positions by creating obvious patterns (e.g., false breakouts).
Stop Hunt / Manipulation Phase – Price violently breaks the structure to grab liquidity (stops and pending orders).
Market Expansion – Once liquidity is captured, institutions drive price toward their true profit targets.
Distribution / Exit – They unload positions gradually, creating new liquidity traps for the next cycle.
This cycle repeats on all timeframes, from the 1-minute chart to the daily.
5. The Smart Money Cycle: Accumulation to Distribution
To understand institutional order flow, visualize the market as a four-phase process:
Phase 1: Accumulation
Price ranges in a tight zone. Retail traders view this as consolidation, but institutions are building positions quietly. Volume may rise slightly but with no clear trend.
Clues:
Flat structure with equal highs/lows.
Multiple liquidity pools forming on both sides.
Inducement wicks below or above range lows/highs.
Phase 2: Manipulation
The market suddenly sweeps one side of the range — a fake breakout. This is the “stop hunt” where liquidity is collected. Retail traders get trapped here.
Clues:
A large candle pierces a liquidity pool.
Market immediately reverses, leaving a wick.
FVG or order block forms right after.
Phase 3: Expansion
Institutions push price rapidly in their true direction. This is the most profitable phase — the trend traders catch late if they don’t understand SMC.
Clues:
Strong BOS confirming new structure.
Continuous creation of higher highs/lows (bullish) or lower highs/lows (bearish).
Minor retracements to order blocks or FVGs.
Phase 4: Distribution
As price matures, institutions begin to offload their positions. This often looks like a slowdown in momentum or a range after a strong move — preparing for the next cycle.
6. SMC Entry Models: Precision with Institutional Logic
SMC traders use refined entry techniques to align with order flow and liquidity behavior.
1. Liquidity Grab + CHOCH
Wait for a liquidity sweep (stop hunt), followed by a structure shift in the opposite direction. This combination often signals a true reversal.
2. Order Block Retest
Once a BOS occurs, price frequently returns to the last valid order block. This provides a high-probability entry aligned with institutional footprints.
3. FVG Mitigation
After a sharp move, look for price to retrace partially into the imbalance zone before continuing.
4. Premium vs Discount Zones
Using a Fibonacci tool, smart money looks to sell in premium zones (above 50%) and buy in discount zones (below 50%) relative to the swing range.
These methods ensure entries occur in areas of high institutional interest rather than random mid-range levels.
7. Time and Session Theory in SMC
Institutions trade based on global liquidity timings:
London Open (7:00–9:00 GMT) – Initial liquidity sweep and false moves.
New York Open (12:00–14:00 GMT) – Real directional push; often the true institutional move.
Asia Session (00:00–05:00 GMT) – Accumulation and low-volatility phases.
Understanding session order flow allows traders to predict when manipulation or expansion phases are likely to occur.
8. Multi-Timeframe Confluence: The SMC Edge
SMC traders never analyze a single timeframe in isolation. Instead:
Higher timeframe (HTF) defines the directional bias (institutional order flow).
Lower timeframe (LTF) offers refined entries using liquidity sweeps and order blocks.
For example:
Daily or 4H chart may show bullish structure.
15M or 5M chart reveals liquidity grabs and CHOCH for precise entry points.
This top-down approach aligns retail participation with institutional timing.
9. Tools and Indicators Supporting SMC
Although SMC is primarily a price-action-based framework, a few tools can enhance precision:
Volume Profile or Delta Order Flow – Shows where large volume or aggressive buying/selling occurred.
Session Indicators – Visualize liquidity timings.
FVG and Order Block Indicators – Mark potential mitigation zones automatically.
However, the true power of SMC lies in naked chart reading — interpreting pure price movement through logic, not lagging signals.
10. Psychology Behind Smart Money Movements
Institutions exploit human behavior. Most retail traders operate on fear and greed — placing stops too close, chasing breakouts, or trading without patience. SMC reverses this psychology.
Smart Money:
Buys when others panic (fear).
Sells when others are euphoric (greed).
Creates fake moves to manipulate these emotions.
A trader adopting SMC must rewire their mindset: the goal is not to follow the crowd but to think like the institutions who move the crowd.
11. Common Mistakes in Applying SMC
Overdrawing zones – Not every candle is an order block. Quality > quantity.
Ignoring HTF bias – Taking entries against the dominant order flow reduces accuracy.
Trading every liquidity grab – Wait for confirmation via CHOCH or BOS.
No patience for mitigation – Smart money retraces; traders must wait for it.
Overleveraging – Even with SMC precision, risk management remains key.
12. Risk Management in SMC Trading
Institutions never risk randomly, and neither should retail traders.
Stop-Loss Placement – Beyond liquidity zones or invalidation points.
Risk-to-Reward (RR) – Minimum 1:3 setups are standard.
Partial Profits – Secure profits at intermediate FVGs or liquidity pools.
Trade Management – Move stops to breakeven after structural confirmation.
Risk control ensures survival even through inevitable false setups.
13. The Power of Institutional Order Flow in Modern Markets
With algorithmic and HFT systems dominating liquidity today, understanding order flow has become vital. Market moves are not random — they reflect large-scale positioning, hedging, and rebalancing activities.
Institutional order flow analysis allows traders to:
Detect accumulation zones before the trend.
Avoid fake breakouts.
Enter with optimal timing.
Predict where liquidity will be targeted next.
When combined with volume analysis or footprint charts, order flow provides near-institutional visibility into price intention.
14. Conclusion: Trading with the Smart Money
Smart Money Concepts and Institutional Order Flow represent the evolution of trading psychology — shifting focus from indicators to intent, from reaction to anticipation.
By mastering liquidity theory, order blocks, and market structure, traders can align with institutional footprints rather than fall victim to them. The market is not random; it’s a battlefield of liquidity, manipulation, and precision — and SMC is the map that reveals the hidden strategy of the elite.
Psychology of Trading & Risk ManagementIntroduction
Trading in financial markets is often perceived as a game of numbers, charts, and strategies. However, beyond the equations and algorithms lies the human mind — a complex network of emotions, biases, and impulses that can make or break a trader’s success. The psychology of trading is the invisible force that dictates how traders behave under pressure, how they respond to wins and losses, and how consistently they execute their trading plans.
Equally important is risk management, the art of protecting capital from emotional and financial ruin. While psychology controls how we make decisions, risk management defines how much we are willing to lose to stay in the game. Together, these two pillars form the foundation of long-term trading success.
1. The Psychological Nature of Trading
Trading is a mental battlefield. Every decision involves uncertainty — no matter how strong your analysis, the market can move against you. This uncertainty triggers emotional responses like fear, greed, hope, and regret, all of which can cloud judgment.
1.1 The Human Brain in Trading
Our brains are wired for survival, not speculation. In evolutionary terms, humans are risk-averse; losses hurt more than gains feel good. This is known as loss aversion, a concept from behavioral economics that explains why traders tend to cut winners early but let losers run — a psychological trap that often leads to losses.
1.2 Emotional Reactions and Decision-Making
Emotions are not inherently bad, but uncontrolled emotions in trading can cause impulsive actions. For instance:
Fear makes traders close positions too soon or avoid taking trades altogether.
Greed drives over-leveraging or chasing quick profits.
Hope keeps traders stuck in losing trades, waiting for the market to reverse.
Regret after a bad trade often leads to “revenge trading,” an emotional attempt to recover losses quickly.
Recognizing these emotions early and managing them effectively is key to developing a professional trading mindset.
2. Common Psychological Biases in Trading
Psychological biases are mental shortcuts that distort thinking. They operate subconsciously and can lead to repeated trading mistakes. Let’s explore the most common biases affecting traders:
2.1 Overconfidence Bias
After a few successful trades, many traders begin to believe they have “figured out” the market. This false sense of control leads to excessive risk-taking, ignoring stop-losses, and trading without confirmation. The market quickly humbles such traders.
2.2 Confirmation Bias
Traders often look for information that confirms their existing beliefs and ignore data that contradicts them. For instance, a bullish trader might only focus on positive news about a stock while dismissing warning signals.
2.3 Anchoring Bias
When traders rely too heavily on a single piece of information — like a past price level — they become “anchored” to it, even when market conditions have changed.
2.4 Recency Bias
Recent events tend to influence traders more than older ones. A trader who faced losses last week might become overly cautious, while one who made profits might turn reckless.
2.5 Herd Mentality
Many traders follow the crowd during sharp rallies or crashes, thinking “everyone can’t be wrong.” Unfortunately, by the time the herd reacts, the smart money is usually exiting.
2.6 Sunk Cost Fallacy
Traders often hold onto losing trades simply because they’ve already invested time or money, refusing to cut losses. This emotional attachment can destroy accounts over time.
By becoming aware of these biases, traders can detach emotion from execution and approach trading decisions with a rational mindset.
3. Building a Trader’s Mindset
To master the psychology of trading, one must think like a professional — not a gambler. Successful traders understand that consistent performance comes from discipline, patience, and process rather than luck or intuition.
3.1 Emotional Discipline
The best traders control emotions rather than suppress them. Emotional discipline means having a predefined trading plan and following it regardless of the market’s noise. This includes sticking to stop-losses, taking profits as planned, and avoiding impulsive entries.
3.2 Patience and Timing
Markets reward patience. Waiting for a high-probability setup rather than forcing trades prevents unnecessary losses. “No trade” is also a position — sometimes the best decision is to stay out.
3.3 Adaptability
Markets evolve, and strategies that worked yesterday may not work tomorrow. Traders must remain flexible and open to new information without being emotionally attached to past methods.
3.4 Self-Awareness
Understanding one’s emotional triggers, such as anxiety during volatility or overconfidence after wins, helps traders take preventive action. Journaling trades and emotions is an excellent way to track behavior patterns.
4. The Role of Risk Management
While psychology deals with mindset, risk management ensures survival. Even the best traders face losing streaks. Risk management is what keeps losses small enough to recover from.
4.1 The Core Principle: Capital Preservation
The first rule of trading isn’t to make money — it’s to protect your capital. Without capital, there’s no opportunity to trade tomorrow. Proper risk management ensures that one bad trade doesn’t wipe out weeks of gains.
4.2 Position Sizing
Position sizing is the process of determining how much of your capital to risk per trade. Most professional traders risk 1–2% of total capital per trade. This allows room for multiple trades and psychological comfort during losing streaks.
4.3 Stop-Loss and Take-Profit
A stop-loss defines where you’ll exit if the market goes against you. It acts as a shield against emotional decision-making. Similarly, take-profit levels ensure traders don’t let greed take over.
Together, they create a structured framework — you know your potential loss and reward before entering a trade.
4.4 Risk-to-Reward Ratio
Successful traders look for trades with a favorable risk-to-reward (R:R) ratio, typically 1:2 or higher. This means risking ₹100 to make ₹200 or more. Even if only 50% of trades succeed, the account can grow consistently.
4.5 Diversification
Putting all capital into one trade or asset increases risk exposure. Diversifying across instruments, time frames, or sectors reduces dependency on a single outcome.
4.6 Managing Leverage
Leverage amplifies both profits and losses. Beginners often misuse leverage out of greed, ignoring that it also multiplies risk. Responsible use of leverage, aligned with a strict risk management plan, ensures long-term survival.
5. Integrating Psychology and Risk Management
Trading psychology and risk management are not separate disciplines — they work together. Risk management provides structure, while psychology ensures adherence to that structure.
5.1 The Emotional Side of Risk
When traders risk too much, emotions like fear and panic dominate decision-making. Small, controlled risk per trade allows traders to think clearly and follow logic instead of emotion.
5.2 Accepting Losses as Part of the Game
Even the best strategies have losing trades. Accepting this truth mentally prevents frustration. A trader who can lose gracefully has already mastered half of trading psychology.
5.3 Consistency Over Perfection
Perfection doesn’t exist in trading. The goal is not to win every trade, but to make consistent, risk-adjusted returns. Psychology helps maintain this long-term vision during inevitable short-term setbacks.
6. Developing a Winning Trading Routine
To achieve mastery, traders must build habits that reinforce discipline and reduce emotional interference.
6.1 Pre-Market Preparation
A professional trader starts each day with preparation — analyzing overnight developments, marking key support/resistance levels, and reviewing trade setups. This builds confidence and clarity before execution.
6.2 Journaling and Reflection
Keeping a trading journal to record entries, exits, emotions, and results is one of the most powerful psychological tools. Over time, patterns emerge — such as taking trades due to boredom or skipping setups due to fear — allowing continuous improvement.
6.3 Regular Review and Feedback
Just as athletes review their performance, traders must analyze past trades objectively. Identify mistakes without self-judgment — the goal is to improve process, not punish oneself.
6.4 Maintaining Physical and Mental Health
Trading requires focus and mental stamina. Proper sleep, exercise, and nutrition improve cognitive performance. Meditation or mindfulness can help reduce stress and sharpen emotional control.
7. The Psychological Challenges of Different Market Phases
Market environments constantly change — trending, ranging, or volatile phases test different aspects of a trader’s psychology.
In bull markets, overconfidence and greed dominate; traders may over-leverage or ignore stop-losses.
In bear markets, fear takes over; traders hesitate to enter even valid setups.
In sideways markets, boredom leads to overtrading — a silent account killer.
Recognizing these psychological traps early helps traders adjust mindset according to market behavior.
8. The Professional Trader’s Mindset
Professional traders think differently from retail traders. Their mindset is shaped by discipline, patience, and objectivity.
8.1 Process Over Outcome
They focus on executing their process correctly, not on short-term profit or loss. Good trades can lose money, and bad trades can win — but only process-driven consistency ensures long-term success.
8.2 Emotional Detachment
Professionals treat each trade as one of thousands in a career. They don’t let one win inflate ego or one loss crush confidence.
8.3 Continuous Learning
Markets evolve with technology, macroeconomics, and sentiment. Professional traders stay curious, keep refining their strategies, and adapt without resistance.
9. Conclusion: Mastering the Mind, Protecting the Capital
The ultimate edge in trading doesn’t come from a secret indicator or algorithm — it comes from mastering oneself.
A trader who controls emotions, respects risk, and follows a structured process has already achieved what 90% of traders fail to: consistency.
Trading psychology teaches how to think, and risk management teaches how to survive. Together, they transform trading from an emotional gamble into a disciplined business.
Remember — the market rewards discipline, not emotion. Those who learn to manage risk and master their psychology will not only preserve capital but also thrive in the long run.

Options Trading StrategiesIntroduction
Options trading has evolved into one of the most dynamic and flexible segments of the financial markets. Unlike straightforward stock trading, where you buy or sell shares, options trading gives traders the ability to structure positions that benefit from different market conditions — bullish, bearish, neutral, or volatile.
An option is a derivative contract that gives the holder the right, but not the obligation, to buy or sell an underlying asset (such as a stock, index, or commodity) at a specified price (called the strike price) before or on a particular date (called the expiry date).
Understanding and applying options trading strategies can allow traders to control risk, enhance returns, and profit even when the market moves sideways — a flexibility unmatched in other financial instruments.
1. Understanding the Basics of Options
Before diving into strategies, it’s crucial to grasp the fundamentals.
a. Types of Options
There are two main types of options:
Call Option: Gives the buyer the right to buy the underlying asset.
Put Option: Gives the buyer the right to sell the underlying asset.
b. Key Terminologies
Premium: The price paid for the option.
Strike Price: The price at which the holder can buy or sell.
Expiration Date: The date when the option contract expires.
In-the-Money (ITM): When exercising the option is profitable.
Out-of-the-Money (OTM): When exercising the option would result in a loss.
At-the-Money (ATM): When the strike price equals the market price.
c. Participants in Options Market
Buyers (Holders): Have limited risk (premium paid) but unlimited profit potential (for calls).
Sellers (Writers): Have limited profit (premium received) but potentially unlimited risk.
2. Why Use Options?
Options offer multiple strategic advantages:
Hedging: Protect an existing position against adverse price moves.
Speculation: Profit from market direction or volatility.
Income Generation: Earn premiums through writing options.
Leverage: Control a large position with limited capital.
Portfolio Flexibility: Create payoff structures that match specific market views.
3. Classification of Options Trading Strategies
Options strategies can be broadly divided based on market outlook and complexity.
A. Based on Market View
Bullish Strategies – Expecting prices to rise.
Bearish Strategies – Expecting prices to fall.
Neutral Strategies – Expecting limited price movement.
Volatility Strategies – Expecting large or small market swings.
B. Based on Construction
Single-Leg Strategies: Using one option (e.g., Buy Call).
Multi-Leg Strategies: Combining multiple options to shape risk and reward (e.g., Bull Spread, Iron Condor).
4. Popular Bullish Option Strategies
When a trader expects the underlying asset to rise in price, these strategies can be used:
a. Long Call
Structure: Buy a Call Option.
Objective: Profit from a strong upward move.
Risk: Limited to the premium paid.
Reward: Unlimited upside potential.
Example: Buy 1 NIFTY 22,000 Call at ₹100 when NIFTY = 21,800.
If NIFTY rises to 22,500, the call becomes worth ₹500 — a significant gain.
b. Bull Call Spread
Structure: Buy one Call (lower strike) and Sell one Call (higher strike).
Objective: Profit from a moderate rise in the underlying.
Risk: Limited to net premium paid.
Reward: Capped at the difference between strikes minus premium.
Example:
Buy 22,000 Call @ ₹100
Sell 22,200 Call @ ₹50
Net Cost = ₹50
Max Profit = ₹150 – ₹50 = ₹100
c. Bull Put Spread
Structure: Sell a Put (higher strike) and Buy a Put (lower strike).
Objective: Earn income with limited risk if prices rise or stay stable.
Risk: Difference in strike prices minus premium received.
Reward: Limited to net premium received.
5. Popular Bearish Option Strategies
These are used when expecting prices to decline.
a. Long Put
Structure: Buy a Put Option.
Objective: Profit from a fall in the underlying.
Risk: Limited to premium paid.
Reward: Substantial, as the price can fall sharply.
Example: Buy NIFTY 22,000 Put at ₹120.
If NIFTY falls to 21,500, the Put’s value jumps to ₹500.
b. Bear Put Spread
Structure: Buy a Put (higher strike) and Sell a Put (lower strike).
Objective: Profit from a moderate price decline.
Risk: Limited to net premium paid.
Reward: Limited to the difference in strike prices minus premium.
c. Bear Call Spread
Structure: Sell a Call (lower strike) and Buy a Call (higher strike).
Objective: Earn premium when expecting limited or downward movement.
Risk: Limited; capped by the spread between strikes.
Reward: Limited to premium received.
6. Neutral or Range-Bound Strategies
When the trader expects the market to stay within a range, the goal is to profit from time decay or lack of volatility.
a. Iron Condor
Structure: Combine a Bull Put Spread and a Bear Call Spread.
Objective: Profit if the price remains within a defined range.
Risk: Limited to the width of spreads minus total premium received.
Reward: Limited to the total premium collected.
This is a popular non-directional strategy among experienced traders.
b. Butterfly Spread
Structure: Combination of three strike prices — Buy 1 ITM option, Sell 2 ATM options, Buy 1 OTM option.
Objective: Profit from minimal price movement around a central strike.
Risk: Limited to premium paid.
Reward: Limited but high if price closes near middle strike.
c. Calendar (Time) Spread
Structure: Buy a long-term option and sell a short-term option at the same strike.
Objective: Profit from time decay and stability in price.
Risk: Limited to net debit.
Reward: Moderate, depending on volatility and expiry behavior.
7. Volatility-Based Strategies
These strategies are not focused on direction but rather on how much the market moves.
a. Long Straddle
Structure: Buy 1 Call + 1 Put at the same strike and expiry.
Objective: Profit from large movements in either direction.
Risk: Limited to total premium paid.
Reward: Unlimited on upside or significant downside.
Ideal during major announcements or earnings results.
b. Long Strangle
Structure: Buy 1 OTM Call and 1 OTM Put.
Objective: Profit from high volatility or large price swings.
Risk: Lower cost than Straddle, but needs bigger move to profit.
Reward: Unlimited upside and substantial downside potential.
c. Short Straddle / Short Strangle
Structure: Sell both options (Call and Put).
Objective: Profit from low volatility and time decay.
Risk: Unlimited if market breaks out sharply.
Reward: Limited to premium received.
Used primarily by experienced traders who can manage risk closely.
8. Advanced Multi-Leg and Professional Strategies
a. Iron Butterfly
Structure: Combines aspects of Butterfly and Iron Condor.
Objective: Profit from minimal movement with higher premium capture.
Reward/Risk: Both limited; works best in stable markets.
b. Ratio Spreads
Structure: Buy 1 option and Sell multiple options of another strike.
Objective: Earn higher returns in mildly trending markets.
Risk: Can become unlimited if price moves sharply beyond expected range.
c. Covered Call
Structure: Own the underlying stock + Sell a Call Option on it.
Objective: Generate steady income from held positions.
Risk: Limited downside from stock, capped upside.
Best For: Long-term investors seeking extra yield.
d. Protective Put
Structure: Buy a Put while holding the stock.
Objective: Hedge downside risk (like an insurance policy).
Risk: Premium cost, but protection against steep losses.
9. Risk Management in Options Trading
Even the best strategy can fail without proper risk control.
Follow these golden principles:
Use position sizing – Don’t allocate more than 2–5% of capital per trade.
Set stop-loss levels – Define exit levels before entering.
Avoid over-leverage – Options are leveraged instruments; misuse can lead to rapid losses.
Monitor volatility – Volatility spikes can distort premiums.
Backtest and paper trade before going live.
Use hedging to balance directional exposure.
10. Choosing the Right Strategy
Selecting an options strategy depends on:
Market View: Bullish, Bearish, Neutral, or Volatile.
Risk Appetite: Conservative vs. Aggressive.
Time Horizon: Short-term trades vs. longer-term positions.
Volatility Levels: High volatility favors selling; low volatility favors buying.
For example:
Expecting big move? → Long Straddle or Strangle.
Expecting stability? → Iron Condor or Butterfly.
Expecting a mild uptrend? → Bull Call Spread.
Expecting moderate decline? → Bear Put Spread.
11. Common Mistakes to Avoid
Ignoring implied volatility before trading.
Using naked options without capital cushion.
Overtrading during volatile sessions.
Holding OTM options till expiry hoping for miracle moves.
Not considering time decay.
Skipping risk-reward calculations.
12. Practical Application and Example
Imagine NIFTY is at 22,000, and you expect a modest rise in two weeks.
You buy 22,000 Call @ ₹100
You sell 22,200 Call @ ₹50
→ Bull Call Spread.
If NIFTY closes at 22,300, your profit = ₹150 – ₹50 = ₹100 per unit.
If it falls, your loss = ₹50 (the premium net paid).
Thus, a defined risk and reward structure makes this strategy ideal for disciplined traders.
Conclusion
Options Trading Strategies open a vast field of opportunities for traders to profit from every kind of market — up, down, or sideways. What makes options powerful is their flexibility, limited-risk nature, and ability to hedge existing portfolios.
However, success in options trading doesn’t come from luck; it arises from understanding market structure, volatility, time decay, and disciplined execution. Traders who master both the art and science of strategy selection, risk management, and psychology can turn options into a consistent and powerful trading edge.
In essence, options trading is not about predicting the market but preparing for it.

Technical Analysis & Price Action MasteryIntroduction
In the world of trading, where market movements can shift within seconds, the ability to interpret price charts and forecast future moves is one of the most valuable skills a trader can possess. Technical analysis and price action mastery together form the foundation of this skill — enabling traders to read market psychology, anticipate potential reversals, and make data-driven decisions with confidence.
Unlike fundamental analysis, which focuses on company performance or macroeconomic indicators, technical analysis studies the market itself — using price, volume, and chart patterns to identify opportunities. Price action, on the other hand, takes this a step deeper by interpreting raw price movements without relying on indicators.
Mastering these two disciplines allows a trader to see beyond noise and understand the true story behind every candle on a chart — the story of buyers and sellers in constant battle.
1. The Essence of Technical Analysis
Technical analysis is based on three key principles formulated decades ago by Charles Dow — the father of modern market analysis. These principles still guide traders today:
Price Discounts Everything
All available information — economic, political, or psychological — is already reflected in price. Therefore, price itself becomes the ultimate truth.
Price Moves in Trends
Markets rarely move randomly. They follow identifiable patterns — uptrends, downtrends, or sideways ranges — which tend to persist until a clear reversal occurs.
History Tends to Repeat Itself
Human emotions like fear and greed drive markets. Because human psychology is constant, the patterns formed by price movements often repeat over time.
These foundations make technical analysis a universal language for traders across asset classes — whether in stocks, forex, commodities, or cryptocurrencies.
2. Tools and Techniques of Technical Analysis
Technical analysis is a broad field that combines multiple tools and strategies. The most widely used include:
a) Chart Types
Line Charts: Simplest form; shows closing prices over time — good for spotting long-term trends.
Bar Charts: Display open, high, low, and close — providing more depth.
Candlestick Charts: The most popular; visually intuitive and used for price action analysis. Each candle tells a story of market sentiment.
b) Trend Analysis
Trendlines help traders visualize the direction of price.
Uptrend: Higher highs and higher lows.
Downtrend: Lower highs and lower lows.
Sideways Trend: Range-bound, showing indecision.
A disciplined trader uses trendlines and moving averages to confirm trend direction before entering trades.
c) Support and Resistance
Support is where demand prevents the price from falling further; resistance is where supply halts a price rise. These zones are psychological barriers where traders often enter or exit trades.
A breakout above resistance or breakdown below support often signals strong market momentum.
d) Volume Analysis
Volume validates price moves. A price rise accompanied by high volume signals strength, while a rise on low volume can suggest weakness. Volume indicators like On-Balance Volume (OBV) and Volume Profile help in understanding the participation behind a move.
e) Indicators and Oscillators
While price action traders may avoid heavy indicator use, technical analysts often rely on tools for additional confirmation:
Moving Averages (MA): Identify trend direction and momentum.
Relative Strength Index (RSI): Measures overbought or oversold conditions.
MACD (Moving Average Convergence Divergence): Reveals momentum shifts.
Bollinger Bands: Indicate volatility and potential breakouts.
The best traders, however, use indicators as supporting evidence, not as the sole basis for decisions.
3. Understanding Price Action: The Heart of Market Psychology
Price Action is the purest form of technical analysis. It strips away indicators and focuses solely on how price behaves — through candlesticks, patterns, and key levels.
Every price movement represents a tug-of-war between buyers (bulls) and sellers (bears). Understanding this battle helps traders anticipate what might happen next.
a) Candlestick Psychology
Each candlestick shows the open, high, low, and close of a period. But beyond that, it reveals the emotion behind the move:
Bullish Candles: Buyers in control; close higher than open.
Bearish Candles: Sellers dominate; close lower than open.
Doji Candles: Indecision; open and close nearly the same.
Learning to interpret candle shapes and their context gives traders deep insights into potential reversals or continuations.
b) Key Price Action Patterns
Certain formations consistently appear in charts and indicate likely market behavior:
Pin Bar (Hammer/Shooting Star):
Long wick shows rejection of higher or lower prices — strong reversal signal.
Engulfing Pattern:
A large candle completely engulfs the previous one, showing a strong shift in control.
Inside Bar:
Represents market consolidation before a breakout — often a continuation pattern.
Breakout and Retest:
After breaking a key level, price often returns to “retest” it before continuing — a favorite entry point for professionals.
c) Market Structure in Price Action
Understanding structure means recognizing how price transitions between phases:
Accumulation: Smart money builds positions quietly.
Markup: Strong uptrend begins as more participants join.
Distribution: Smart money exits, price slows down.
Markdown: Trend reverses; prices fall as selling accelerates.
This structure repeats across all markets and timeframes — mastering it is the foundation of consistent profitability.
4. Combining Technical Analysis and Price Action
While technical analysis provides tools, price action gives context. A professional trader combines both approaches for precision and confidence.
For instance:
Use support and resistance to mark key zones.
Wait for price action confirmation (like a pin bar or engulfing pattern).
Confirm with volume or trend indicators.
Execute trade with defined risk-reward and stop-loss placement.
This systematic blend helps traders avoid emotional decisions and react logically to market data.
5. Risk Management: The Core of Mastery
No matter how accurate the analysis, losses are part of trading. The real mastery lies not in avoiding losses but in managing risk effectively.
Key risk management principles include:
Position Sizing: Never risk more than 1–2% of total capital per trade.
Stop-Loss Orders: Always define the level at which a trade is invalidated.
Risk-Reward Ratio: Aim for at least 1:2 — potential profit should be double the risk.
Trade Journal: Track every trade to identify strengths and weaknesses.
Technical mastery without risk control leads to eventual losses. Consistent traders understand that preserving capital is their first priority.
6. Trading Psychology and Discipline
Beyond charts and setups, success in trading depends heavily on mindset. Technical knowledge may get you started, but psychological discipline keeps you profitable.
Patience: Wait for high-probability setups; avoid overtrading.
Emotional Control: Don’t let fear or greed influence decisions.
Adaptability: Markets evolve — stay flexible.
Confidence through Practice: Backtesting and journaling build trust in your strategy.
Mastering technical analysis is not about predicting every move — it’s about responding intelligently to what the market shows.
7. Multi-Timeframe Analysis
Professional traders analyze multiple timeframes to align short-term setups with long-term trends.
Higher Timeframes (Daily, Weekly): Identify major trend and key zones.
Lower Timeframes (15m, 1h): Find precise entries and exits.
This “top-down approach” ensures trades are aligned with the overall market direction, reducing false signals.
8. Volume Profile & Market Structure Integration
Advanced traders integrate Volume Profile and Market Structure with price action for higher accuracy:
Volume Profile: Shows traded volume at different price levels — highlighting areas of strong institutional interest.
High Volume Nodes (HVN): Areas of heavy activity; act as support/resistance.
Low Volume Nodes (LVN): Thin zones — price tends to move quickly through them.
Combining these with price action helps identify where the next big move might begin.
9. Building a Complete Trading System
To truly master technical analysis and price action, a trader must build a personal trading system — a set of rules combining analysis, execution, and psychology.
A robust system should include:
Market Selection: Which instruments to trade (stocks, forex, commodities).
Setup Criteria: Clear patterns or signals to look for.
Entry Triggers: What must happen before taking a trade.
Stop-Loss & Targets: Defined before entering.
Risk Management Rules: Position sizing and capital exposure.
Review Process: Post-trade analysis to refine performance.
Once developed, this system should be followed with discipline and consistency. The goal is to remove emotion and rely on process — just like a professional.
10. Continuous Learning and Adaptation
Markets are dynamic, and strategies that work today may not always work tomorrow. True mastery requires continuous learning — adapting to changing volatility, economic shifts, and new tools.
Traders can enhance skills by:
Reviewing trades regularly.
Studying institutional order flow concepts.
Learning about liquidity traps, false breakouts, and market manipulation.
Using simulation tools for backtesting.
The more you study the market, the clearer its rhythm becomes.
Conclusion
Technical Analysis and Price Action Mastery is not about memorizing patterns or predicting the future — it’s about understanding the underlying forces that move markets and positioning yourself in harmony with them.
Every candle, every level, and every breakout represents human emotion in action. When you learn to read this emotion through structure, context, and momentum, you begin to trade with confidence — not guesswork.
Ultimately, the mastery of technical analysis and price action is a journey of discipline, patience, and deep observation. It turns trading from speculation into a structured profession — where each decision is backed by logic, not luck.
In the hands of a patient, risk-aware trader, these tools become a map to consistent profitability and long-term success in financial markets.
Algorithmic & Quantitative TradingIntroduction
Over the past two decades, the global financial markets have transformed from bustling trading floors filled with human brokers shouting orders to high-speed electronic exchanges dominated by algorithms. This shift represents one of the most profound technological revolutions in finance — the rise of Algorithmic and Quantitative Trading (AQT).
These two closely related fields leverage mathematics, statistics, and computing to make trading more efficient, data-driven, and disciplined. They have not only changed how trades are executed but also how investment decisions are made. Understanding algorithmic and quantitative trading is therefore essential for grasping how modern financial markets truly function today.
1. Understanding Algorithmic Trading
1.1 Definition and Core Concept
Algorithmic trading (Algo trading) refers to the use of computer algorithms — step-by-step sets of coded instructions — to execute trades automatically based on pre-defined criteria such as price, timing, volume, or market conditions.
In simpler terms, instead of a human clicking a buy or sell button, a computer program makes the decision and executes it faster than any human could.
An algorithm can be designed to:
Identify trading opportunities,
Execute trades at optimal prices,
Manage risk through stop-loss or profit-taking rules, and
Adjust its strategy dynamically as the market evolves.
The central goal of algorithmic trading is to eliminate human emotion and delay from the trading process, thereby increasing speed, precision, and consistency.
2. The Evolution of Algorithmic Trading
Algorithmic trading began in the 1970s with electronic trading systems like NASDAQ. The real explosion came in the 1990s and early 2000s with advances in computing power and connectivity. By 2010, a significant portion of trading volume in developed markets such as the U.S. and Europe was algorithmic.
Today, algorithms are responsible for over 70% of equity trades in the U.S. and an increasing share of trades in emerging markets like India. The evolution has moved through stages:
Simple Execution Algorithms – Used to break large institutional orders into smaller parts to minimize market impact.
Statistical Arbitrage and Pairs Trading – Exploiting small price inefficiencies between related securities.
High-Frequency Trading (HFT) – Using ultra-fast systems to exploit millisecond-level market movements.
AI-Driven and Machine Learning Algorithms – Continuously adapting strategies using live market data.
3. How Algorithmic Trading Works
Algorithmic trading operates through a set of coded rules implemented in trading software. A basic algorithm typically includes the following components:
3.1 Strategy Definition
This is where the logic of the trade is specified. For instance:
Buy 100 shares of XYZ if the 50-day moving average crosses above the 200-day moving average (a “Golden Cross”).
Sell a stock if its price falls 2% below the previous day’s close.
3.2 Market Data Input
Algorithms consume real-time and historical data — prices, volumes, order book depth, and even news sentiment — to make decisions.
3.3 Signal Generation
Based on input data, the algorithm identifies a trading opportunity, generating a buy or sell signal.
3.4 Order Execution
The algorithm automatically places orders in the market, sometimes splitting large orders into smaller “child orders” to minimize price impact.
3.5 Risk Management
Modern algorithms include risk controls, such as maximum position size, stop losses, or exposure limits, to prevent major losses.
3.6 Performance Monitoring
Traders or institutions continuously monitor the algorithm’s performance and make parameter adjustments when required.
4. Understanding Quantitative Trading
4.1 Definition
Quantitative trading (Quant trading) focuses on using mathematical and statistical models to identify profitable trading opportunities. While algorithmic trading automates execution, quantitative trading focuses on the design and development of the trading strategy itself.
In essence:
Quantitative Trading = The science of building strategies using data and math.
Algorithmic Trading = The engineering of executing those strategies efficiently.
Most modern trading operations combine both — a quant model discovers the opportunity, and an algorithm executes it automatically.
5. The Building Blocks of Quantitative Trading
5.1 Data Collection and Cleaning
Quantitative trading begins with data — historical prices, volume, fundamentals, economic indicators, sentiment data, etc. This data must be cleaned, normalized, and structured for analysis.
5.2 Hypothesis Development
A quant trader might form a hypothesis such as “small-cap stocks outperform large-caps after earnings surprises.” The model then tests this hypothesis statistically.
5.3 Backtesting
The strategy is simulated on historical data to measure performance, risk, and robustness. Metrics such as Sharpe Ratio, drawdown, and win rate are used to evaluate success.
5.4 Optimization
Parameters are fine-tuned to improve results without overfitting (a common trap where a model performs well historically but fails in live markets).
5.5 Execution and Automation
Once validated, the strategy is deployed through algorithmic systems for live execution.
6. Common Quantitative Strategies
Quantitative trading covers a wide range of strategies, including:
Statistical Arbitrage – Exploiting temporary mispricings between correlated assets.
Mean Reversion – Betting that prices will return to their long-term average after deviations.
Momentum Trading – Riding the wave of stocks showing strong price trends.
Market Making – Providing liquidity by continuously quoting buy and sell prices.
Event-Driven Strategies – Trading based on corporate actions like earnings announcements or mergers.
Machine Learning Models – Using AI to identify hidden patterns or predict price movements.
7. Role of Technology in Algorithmic and Quantitative Trading
Technology is the backbone of AQT.
Key technological pillars include:
7.1 High-Speed Connectivity
Millisecond-level latency can determine profitability in markets dominated by speed.
7.2 Co-location and Proximity Hosting
Firms place their trading servers physically close to exchange servers to minimize transmission delay.
7.3 Advanced Programming Languages
Languages like Python, C++, and Java are used to develop models and execution systems.
7.4 Big Data and Cloud Computing
Handling terabytes of market data requires scalable computing environments.
7.5 Artificial Intelligence and Machine Learning
AI systems can continuously learn from new data, adapt to market changes, and improve their predictive accuracy.
8. Advantages of Algorithmic & Quantitative Trading
8.1 Speed and Efficiency
Algorithms execute trades in microseconds, ensuring optimal entry and exit points.
8.2 Emotion-Free Decisions
Trading based on predefined rules eliminates emotional biases such as fear or greed.
8.3 Better Execution and Reduced Costs
Execution algorithms reduce slippage (difference between expected and actual trade prices) and transaction costs.
8.4 Backtesting and Strategy Validation
Traders can test strategies on historical data before risking capital.
8.5 Diversification
Algorithms can manage multiple strategies and asset classes simultaneously, reducing overall portfolio risk.
9. Challenges and Risks
Despite its sophistication, algorithmic and quantitative trading comes with notable risks:
9.1 Overfitting and Model Risk
A strategy that performs brilliantly on past data might fail miserably in live markets if it’s over-optimized.
9.2 Market Volatility Amplification
Algorithms can sometimes intensify volatility, as seen during events like the 2010 “Flash Crash.”
9.3 Technical Failures
Software glitches, connectivity losses, or coding errors can lead to massive financial losses.
9.4 Competition and Saturation
As more firms adopt similar strategies, profit opportunities diminish — leading to a “race to the bottom.”
9.5 Regulatory and Ethical Issues
Market regulators constantly monitor algorithmic activity to prevent manipulation such as spoofing or layering.
10. Regulation of Algorithmic Trading
Globally, regulators have imposed frameworks to ensure transparency and fairness.
For example:
U.S. SEC & FINRA regulate algorithmic practices under strict risk control requirements.
MiFID II in Europe demands algorithmic systems undergo stress testing and registration.
SEBI (India) has guidelines requiring brokers to seek prior approval before deploying any algo strategy and maintain strong risk controls.
The goal is to ensure that the speed advantage of technology does not compromise market integrity.
11. The Role of Data Science and Machine Learning
The next frontier in AQT lies in Machine Learning (ML) and Artificial Intelligence (AI). These technologies go beyond rule-based systems by allowing algorithms to learn from experience.
For instance:
Neural Networks can predict short-term price direction based on complex non-linear relationships.
Natural Language Processing (NLP) can analyze news headlines or social media sentiment to anticipate market reactions.
Reinforcement Learning allows algorithms to evolve and optimize trading behavior through trial and feedback.
The integration of ML transforms traditional models into adaptive, self-learning systems capable of functioning even in rapidly changing environments.
12. The Human Element in a Quant World
Despite the automation, humans remain central to algorithmic and quantitative trading.
Quantitative analysts (“quants”) design and validate models, while risk managers ensure systems operate within limits.
Moreover, intuition and judgment still matter — particularly in interpreting data, handling market anomalies, or adjusting strategies during unexpected events like geopolitical crises or pandemics.
Thus, the future of AQT is not about replacing humans but enhancing their decision-making power through technology.
13. Future Trends in Algorithmic & Quantitative Trading
The future of AQT is shaped by several emerging trends:
AI-Driven Adaptive Systems: Fully autonomous algorithms capable of evolving in real time.
Quantum Computing: Expected to dramatically enhance processing speeds and optimization capacity.
Blockchain Integration: Smart contracts could enable decentralized, algorithmic trading platforms.
Retail Algorithmic Access: Platforms like Zerodha’s Streak or Interactive Brokers’ APIs are democratizing algo trading for retail investors.
Sustainability and ESG Integration: Algorithms now factor in environmental and social data to align with ethical investing trends.
These innovations will make markets more efficient but also more complex, demanding greater regulatory oversight and risk awareness.
Conclusion
Algorithmic and Quantitative Trading represent the perfect blend of mathematics, technology, and finance. Together, they have revolutionized the way markets operate — making trading faster, more efficient, and more data-driven than ever before.
While algorithms dominate execution, quantitative models drive strategy formulation. The synergy between them defines modern finance’s competitive edge. Yet, success in this domain requires not just technical skill but also rigorous risk control, continuous learning, and a deep understanding of market behavior.
As we look ahead, the boundary between human intelligence and artificial intelligence in markets will continue to blur. The future trader will be part mathematician, part programmer, and part strategist — operating in a world where data is the new currency and algorithms are the engines that power the markets of tomorrow.
Market Structure and Volume Profile Analysis1. What is Market Structure?
Market structure refers to the framework or layout of price movements on a chart. It’s the foundation of technical analysis and represents how price transitions between different phases — uptrends, downtrends, and consolidations.
In simple terms, market structure is the “story” that price tells. It reveals the ongoing battle between bulls and bears, showing where momentum shifts occur and where the next possible move could be.
1.1 The Core Elements of Market Structure
Swing Highs and Swing Lows:
These are the turning points of the market.
Swing High: A peak where price reverses downward.
Swing Low: A trough where price reverses upward.
Higher Highs (HH) and Higher Lows (HL):
These define an uptrend. Each new high surpasses the previous one, and each low remains above the previous low — signaling strength in buying pressure.
Lower Highs (LH) and Lower Lows (LL):
These define a downtrend. Each new low is lower than the previous one, and each high fails to reach the prior peak — showing selling dominance.
Range or Consolidation:
When price moves sideways between defined boundaries, it indicates equilibrium — a pause before a breakout or breakdown.
2. The Three Phases of Market Structure
Market structure often unfolds in three broad phases, forming a continuous cycle:
2.1 Accumulation Phase
Occurs after a prolonged downtrend.
Smart money (institutional traders) quietly accumulate positions at discounted prices.
Price typically moves sideways within a range with low volatility.
Volume gradually increases near the lower end of the range.
2.2 Markup Phase
Begins when price breaks above resistance of the accumulation range.
Market starts forming higher highs and higher lows.
Retail traders begin to notice the trend, and participation increases.
This phase is characterized by momentum, volume expansion, and trend continuation.
2.3 Distribution Phase
After an extended uptrend, large players begin to distribute (sell) their holdings to late entrants.
Price moves sideways again, showing exhaustion.
The structure gradually shifts from higher highs to equal or lower highs, signaling a potential reversal.
After distribution, the market transitions into a markdown phase, starting the next downtrend cycle — mirroring the opposite of the markup phase.
3. Identifying Market Structure Shifts
A Market Structure Shift (MSS) occurs when price action breaks the pattern of highs and lows, signaling a potential change in direction.
For instance:
In an uptrend, if price forms a lower low, it suggests weakening buyer momentum.
In a downtrend, a higher high can indicate the first sign of reversal.
Practical Example:
Suppose price is making consistent higher highs and higher lows. Suddenly, it fails to make a new high and breaks below the last higher low.
➡️ This indicates a break in structure (BOS) — a possible start of a bearish trend.
Such breaks are crucial for traders as they provide early reversal signals and opportunities to align trades with the new direction.
4. Understanding Volume Profile Analysis
While market structure shows where price has moved, Volume Profile reveals why it moved there — by showing the distribution of traded volume across price levels rather than time.
Unlike traditional volume bars that appear at the bottom of the chart, Volume Profile is plotted horizontally along the price axis. This gives a clear picture of where the most buying and selling activity occurred, and hence, where strong support and resistance zones exist.
5. Key Components of Volume Profile
A Volume Profile typically consists of several important zones and metrics:
5.1 Point of Control (POC)
The price level with the highest traded volume.
It represents the fairest price or value area equilibrium where both buyers and sellers agreed most.
Acts as a magnet for price; markets often revisit the POC after deviations.
5.2 Value Area (VA)
The range covering roughly 70% of the total traded volume.
Divided into:
Value Area High (VAH): The upper boundary.
Value Area Low (VAL): The lower boundary.
Price movement above or below this zone suggests overbought or oversold conditions relative to value.
5.3 Low-Volume Nodes (LVN)
Price levels with very low traded volume.
These act as rejection zones or imbalance areas, often leading to sharp moves when revisited.
5.4 High-Volume Nodes (HVN)
Clusters of heavy trading activity.
They act as strong support/resistance levels and areas where the market is likely to consolidate.
6. Interpreting Volume Profile for Trading
Volume Profile provides context for market structure by helping traders answer key questions:
Where is the market balanced (value area)?
Where did price previously face acceptance or rejection?
Is current price above or below value?
Here’s how to interpret common scenarios:
6.1 Price Above Value Area
The market is overextended to the upside.
If volume is weak, a mean reversion toward the POC is likely.
If volume increases, it may signal acceptance of higher value, suggesting trend continuation.
6.2 Price Below Value Area
Indicates potential undervaluation.
A bounce back toward value (POC) is possible if buyers step in.
6.3 Single Prints or Volume Gaps
These represent inefficient auction areas where price moved too fast.
Market tends to revisit and fill these gaps to balance the order flow later.
7. Combining Market Structure and Volume Profile
When used together, these tools create a powerful framework for understanding price behavior.
7.1 Structure Confirms Direction, Volume Confirms Value
Market Structure shows the direction of the trend.
Volume Profile confirms where the value is being built.
For instance:
If market structure forms higher highs and higher lows (uptrend) and Volume Profile shifts upward (value moving higher), this confirms a healthy bullish trend.
Conversely, if price rises but volume value areas shift lower, it signals weakness — a potential reversal.
7.2 Trading Strategy Example
Scenario: Market is in an uptrend with clear HH-HL structure.
Observation: Volume Profile shows strong buying at higher value areas and rejection below the POC.
Action:
Wait for a pullback to VAL or POC.
Enter long when price shows bullish confirmation (e.g., bullish engulfing candle).
Target the previous high or next HVN.
Place stop-loss below the recent swing low or LVN.
This combination ensures trades are aligned with trend structure and supported by volume confirmation, improving accuracy and reducing noise.
8. Practical Applications in Different Timeframes
Market Structure and Volume Profile are timeframe-independent, but interpretation differs across timeframes.
8.1 Intraday Trading
Focus on session volume profiles to identify daily value shifts.
Identify volume imbalances and trade breakouts or rejections around them.
Structure shifts (like BOS or CHoCH — Change of Character) often provide early intraday reversals.
8.2 Swing Trading
Use composite volume profiles covering several weeks/months to spot long-term value zones.
Identify accumulation and distribution phases.
Align trades with larger structural trends and institutional footprints.
8.3 Position Trading
Evaluate macro structure across weekly and monthly charts.
Focus on long-term POCs, high-volume nodes, and trend phases.
Use volume confirmation to identify areas of institutional accumulation or exit.
9. The Psychology Behind Market Structure and Volume
Every structure and volume zone represents trader psychology:
High Volume Areas: Consensus zones — comfort areas where both sides transact heavily.
Low Volume Areas: Fear or indecision zones — markets move quickly through them.
Structure Breaks: Emotional points where one side capitulates, shifting control.
Understanding this behavioral context helps traders not only react to price but anticipate moves before they happen.
10. Common Mistakes Traders Make
Ignoring Higher Timeframe Structure:
Trading against the dominant trend often leads to false entries.
Overusing Indicators Instead of Price Context:
Indicators lag — market structure gives real-time insights.
Misinterpreting Volume:
Not all high-volume zones mean strength; sometimes they signal distribution.
Neglecting Balance and Imbalance:
Failing to differentiate between a balanced (ranging) and imbalanced (trending) market causes confusion.
11. Key Tips for Effective Market Structure and Volume Analysis
Always start with higher timeframes to establish trend context.
Mark key POC, VAH, VAL, and swing levels.
Watch for Market Structure Shifts (BOS/CHoCH) near volume extremes.
Combine with liquidity concepts — price often reacts around previous highs/lows.
Use Volume Delta and Cumulative Volume Delta (CVD) for deeper order flow confirmation.
12. Real-World Example: A Typical Trade Setup
Context:
Nifty Futures on a 1-hour chart.
Market structure: Higher highs and higher lows (uptrend).
Volume Profile: Value area shifting upward, with a new POC forming higher.
Price retraces to the previous VAL, showing bullish rejection candles.
Trade Execution:
Entry: Long at VAL with confirmation candle.
Stop-Loss: Below swing low or LVN.
Target: Next HVN or previous high.
This approach aligns trend structure, volume value, and entry precision — the essence of professional trading logic.
Conclusion
Market Structure and Volume Profile Analysis form the backbone of modern price action trading. While market structure reveals the rhythm of price, Volume Profile uncovers the hidden story of participation and value.
By mastering both, traders can move beyond mere patterns and indicators to understand the true mechanics of market movement — where orders flow, where value builds, and where opportunity lies.
In essence, the market is a dynamic auction — and those who can read its structure and volume footprints gain a powerful edge. When used together with discipline and patience, these tools transform trading from guesswork into a structured, data-driven process.
IDBI 1 Month Time Frame ✅ Current snapshot
Stock is trading around ₹ 93-100 (recent levels).
52-week high ~ ₹ 106.3, 52-week low ~ ₹ 65.9.
Technical summary (monthly time-frame) shows indicators leaning “Strong Buy” overall according to one provider.
Fundamentals: P/E ~ ~10-11x, book value ~ ₹63-64 (various sources) and modest dividend yield (~2.2%).
Key development: The government + Life Insurance Corporation of India (LIC) are moving ahead with strategic changes for IDBI (which could provide medium-term tailwinds).
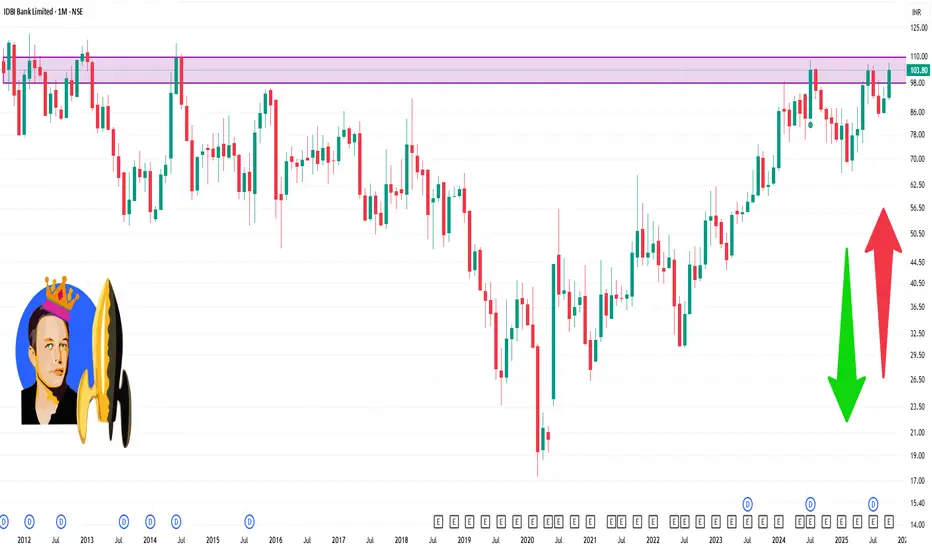
Part 2 Ride The Big Moves Advantages of Option Trading
Option trading offers several benefits:
Leverage: Small premiums control large positions, magnifying potential returns.
Flexibility: Options can be used for income generation, speculation, or hedging.
Limited Risk for Buyers: The maximum loss for option buyers is limited to the premium paid.
Diverse Strategies: Traders can design complex setups for any market condition.
Portfolio Protection: Helps reduce downside risks without liquidating assets.
Because of these advantages, options have become integral to both institutional and retail trading strategies worldwide.

Part 1 Ride The Big Moves Role of Options in Hedging and Speculation
Options serve two primary purposes—hedging and speculation.
Hedging: Investors use options to protect their portfolios from adverse price movements. For example, a fund manager expecting a market downturn might buy put options on an index to limit potential losses.
Speculation: Traders use options to bet on the direction of price movements with relatively low capital compared to buying stocks outright. For instance, buying a call option allows participation in a stock’s upside potential without investing the full stock price.
Thus, options balance the needs of both conservative and aggressive market participants.

Part 2 Intraday Master ClassStrategies in Option Trading
Options allow traders to build strategies tailored to market views—bullish, bearish, or neutral.
Some popular strategies include:
Covered Call: Selling a call option while holding the underlying asset to earn extra income.
Protective Put: Buying a put option to hedge against possible losses in a stock you own.
Straddle: Buying both a call and a put with the same strike and expiry to profit from volatility.
Strangle: Similar to a straddle but with different strike prices for the call and put.
Iron Condor: Combining multiple options to profit from low volatility conditions.
Such strategies help traders control risk and maximize profits under different market scenarios.

Part 1 Intraday Master ClassParticipants in Option Markets
There are generally four participants in an options market:
Buyers of Call Options – Expect prices to rise.
Sellers (Writers) of Call Options – Expect prices to remain stable or fall.
Buyers of Put Options – Expect prices to fall.
Sellers (Writers) of Put Options – Expect prices to remain stable or rise.
Buyers pay the premium and hold limited risk but unlimited profit potential. Sellers receive the premium but bear potentially unlimited risk, especially in the case of uncovered or “naked” positions. This difference in risk profile defines the strategic balance of the options market.

Divergence Secrets How Option Pricing Works
The price (premium) of an option is influenced by several factors, collectively known as the “Option Greeks”:
Delta: Measures how much the option price changes with a ₹1 change in the underlying asset.
Gamma: Indicates the rate of change of Delta.
Theta: Represents the time decay of the option’s value as it approaches expiry.
Vega: Measures sensitivity to volatility.
Rho: Indicates sensitivity to interest rate changes.
Additionally, the volatility of the underlying asset and time to expiry play crucial roles in determining option prices. Higher volatility increases the premium, as uncertainty boosts the potential for profit.

Option TradingTypes of Options: Calls and Puts
Options are divided into two main categories:
Call Options: The buyer of a call expects the underlying asset’s price to rise. For example, if a trader buys a call option on Reliance stock with a strike price of ₹2500, and the stock rises to ₹2600 before expiry, the trader can exercise the option and profit from the difference.
Put Options: The buyer of a put expects the asset’s price to fall. If the same Reliance stock falls to ₹2400, the put option buyer profits by selling at ₹2500 (the strike price).
Call and put options can be used separately or in combination to create complex strategies based on different market conditions.
