How F&O Trading Works in the Indian Stock MarketIntroduction
The Indian stock market is a vast financial ecosystem where various types of instruments allow investors to participate, hedge, or speculate. Among these, Futures and Options (F&O) trading has gained immense popularity in recent years. This segment of the market attracts not just institutional investors but also a growing number of retail traders.
F&O trading offers the potential for high returns, but it also involves significant risk. To understand how it works, one needs to grasp the underlying principles, mechanisms, and practical strategies that drive this segment. This detailed guide will explore what F&O trading is, how it functions in India, the role of margin, settlement, and risk management — helping you understand how traders profit (or lose) in this high-stakes market.
1. Understanding the Basics of F&O Trading
What Are Derivatives?
Futures and Options are both types of derivative instruments, meaning their value is derived from an underlying asset. The underlying asset could be:
A stock (like Reliance Industries or Infosys)
An index (like Nifty 50 or Bank Nifty)
A commodity
A currency pair
For instance, if you buy a Nifty 50 futures contract, your profit or loss depends on the movement of the Nifty index, not on an individual stock.
Why Are Derivatives Used?
Derivatives are used for three main purposes:
Hedging: To protect against potential losses in the cash market.
Speculation: To profit from price movements without owning the asset.
Arbitrage: To exploit price differences between the cash and derivatives markets.
2. Futures Contracts Explained
A Futures contract is a legal agreement to buy or sell an underlying asset at a predetermined price on a specified future date.
Key Features of Futures
Standardized Contracts: Traded on exchanges like NSE or BSE with predefined lot sizes and expiry dates.
Leverage: Traders only pay a fraction of the total value (known as margin), allowing control over larger positions.
Obligation to Fulfill: Both buyer and seller are obligated to complete the transaction at expiry unless the position is squared off before.
Example:
Suppose the Nifty 50 index is trading at ₹22,000. A Nifty futures contract (lot size = 50) allows you to buy or sell exposure worth ₹11,00,000 (22,000 × 50).
However, you only need to pay a margin of about 10–15%, say ₹1,10,000–₹1,65,000.
If Nifty rises to ₹22,300, you gain ₹300 × 50 = ₹15,000.
If it falls to ₹21,700, you lose ₹15,000.
Thus, leverage magnifies both profits and losses.
3. Options Contracts Explained
What Are Options?
An Option gives the buyer the right, but not the obligation, to buy or sell an asset at a predetermined price (called the strike price) before or on a specified expiry date.
Call Option: Right to buy an asset.
Put Option: Right to sell an asset.
The buyer pays a premium to the seller (writer) for this right.
Example:
Suppose Infosys is trading at ₹1,500. You buy a call option with a strike price of ₹1,520 at a premium of ₹20.
If Infosys rises to ₹1,560, your gain = (₹1,560 − ₹1,520 − ₹20) = ₹20 per share.
If Infosys falls below ₹1,520, you can let the option expire — your loss is limited to the premium (₹20 per share).
The Two Sides of an Option Trade:
Option Buyer: Pays the premium, risk limited to that amount.
Option Seller (Writer): Receives premium, but risk can be unlimited if the market moves against them.
4. The F&O Market Structure in India
Trading Platforms
F&O contracts in India are primarily traded on:
NSE (National Stock Exchange) – India’s largest derivatives market.
BSE (Bombay Stock Exchange) – Smaller but active in some index derivatives.
Expiry Cycles
Stock futures and options have a monthly expiry, typically the last Thursday of the month.
Index derivatives (like Nifty and Bank Nifty) have weekly expiries as well.
Lot Sizes
Each contract has a lot size determined by SEBI to ensure that the total contract value remains around ₹5–10 lakh.
Example:
Nifty 50: 50 units
Bank Nifty: 15 units
Reliance Industries: 250 shares per lot
5. How Margin and Leverage Work
1. Initial Margin
When you enter an F&O trade, you must deposit an initial margin, which includes:
SPAN margin: Covers potential losses based on volatility.
Exposure margin: Additional cushion required by the exchange.
2. Mark-to-Market (MTM) Settlement
Futures positions are marked to market daily — meaning:
If your position gains, money is credited.
If it loses, funds are debited.
This ensures daily profit and loss settlement, reducing counterparty risk.
3. Leverage Effect
Leverage allows traders to amplify returns. However, the same mechanism can wipe out capital quickly.
For example, a 2% adverse move in Nifty could mean a 15–20% loss on margin capital.
6. How Option Premiums Are Determined
More volatility → higher premium
More time to expiry → higher premium
Deep in-the-money options have high Delta and value movement close to the underlying asset.
7. Settlement Mechanism
1. Futures Settlement
Index Futures: Settled in cash at expiry.
Stock Futures: Also cash-settled, no actual delivery of shares.
2. Options Settlement
In-the-Money options are settled in cash automatically at expiry.
Out-of-the-Money options expire worthless.
Since 2019, SEBI has allowed physical settlement for stock options — meaning if you hold an in-the-money position at expiry, you might have to buy or sell actual shares.
8. Participants in the F&O Market
The Indian derivatives market attracts a wide variety of players:
Hedgers: Investors or institutions protecting their portfolios from adverse price movements (e.g., mutual funds, FIIs).
Speculators: Traders betting on price direction to earn quick profits.
Arbitrageurs: Professionals exploiting price mismatches between cash and F&O markets.
Retail Traders: Growing segment using F&O for short-term speculation.
9. Risks and Rewards in F&O Trading
The Rewards
High leverage: Small capital can control large exposure.
Flexibility: Profit in both rising and falling markets.
Hedging power: Protects long-term investments.
Liquidity: Nifty, Bank Nifty, and top stock derivatives offer deep liquidity and tight spreads.
The Risks
High volatility: Prices can move sharply in seconds.
Leverage trap: Amplifies losses as much as profits.
Time decay: Options lose value daily if the underlying doesn’t move favorably.
Complexity: Requires understanding of Greeks, margin rules, and expiry mechanisms.
10. Example: Real-World F&O Scenario
Case 1: Nifty Futures Trade
You expect Nifty to rise from 22,000 to 22,300.
You buy one Nifty Futures contract at 22,000.
Margin required: ₹1.2 lakh.
Nifty closes at 22,300 → Profit = ₹300 × 50 = ₹15,000 (≈12.5% return on margin).
However, if Nifty drops to 21,700 → Loss = ₹15,000 (≈12.5% loss).
Case 2: Option Strategy – Protective Put
Suppose you hold Reliance shares at ₹2,400 and fear a correction.
You buy a Put Option at ₹2,350 by paying a premium of ₹20.
If Reliance falls to ₹2,200, you can sell at ₹2,350 → Loss limited to ₹50 (minus premium).
If it rises, you lose only ₹20 premium but retain upside.
This illustrates how options can act as an insurance mechanism.
11. Regulatory Framework and SEBI’s Role
The Securities and Exchange Board of India (SEBI) regulates F&O trading to ensure fairness, transparency, and investor protection.
Some key regulations include:
Margin requirements to control leverage.
Position limits to avoid market manipulation.
Physical settlement for stock derivatives.
Disclosure norms for institutional participants.
Exchanges like NSE Clearing Ltd. act as clearing corporations, ensuring all trades are honored and counterparty risk is eliminated.
12. The Growth of F&O in India
The Indian derivatives market has witnessed exponential growth:
NSE’s derivatives turnover often exceeds ₹200–300 lakh crore per day.
Index options (especially Bank Nifty and Nifty) dominate trading volumes.
Retail participation has increased drastically due to online platforms and simplified apps.
However, SEBI and exchanges have repeatedly warned traders about excessive speculation and the risk of retail losses due to leverage.
13. Taxation of F&O Trading
In India, income from F&O trading is considered business income, not capital gains.
Profits and losses must be reported under “Income from Business or Profession.”
Expenses like brokerage and internet charges can be deducted.
Audit requirement: If turnover exceeds ₹10 crore (or under certain loss conditions), audit is mandatory.
Short-term speculative traders must also pay GST on brokerage and STT (Securities Transaction Tax) on trades.
14. The Future of F&O Trading in India
The future looks dynamic with:
Introduction of new derivative products (sectoral, volatility-based).
Growth of weekly expiries and index-based contracts.
Increased algorithmic and retail participation.
Regulatory push toward risk-aware trading and investor education.
F&O trading will continue to be a key pillar of India’s capital markets, balancing speculation, liquidity, and hedging opportunities.
Conclusion
Futures and Options trading is a double-edged sword — a powerful tool for hedging, speculation, and arbitrage, but also a domain where leverage magnifies risks.
Understanding contract structure, margin mechanism, pricing logic, and strategy design is essential before stepping in.
For a disciplined trader, F&O offers flexibility, liquidity, and opportunities unmatched in the traditional cash market. But for the uninformed or impulsive participant, it can be financially dangerous.
In short, F&O trading rewards knowledge, strategy, and risk control — not emotion or luck.
The key to success lies in understanding how the system works and using it intelligently to your advantage.
Trend Line Break
FII and DII Investment Patterns: The Tug-of-War in Indian Market1. Who Are FIIs and DIIs?
Foreign Institutional Investors (FIIs)
FIIs are large global investment entities that invest in a country’s financial markets from abroad. These include:
Mutual funds
Pension funds
Hedge funds
Sovereign wealth funds
Insurance companies and investment banks
FIIs bring in foreign capital, typically seeking higher returns compared to developed markets. They invest in equities, bonds, and derivatives. In India, they’re now classified under Foreign Portfolio Investors (FPIs), following regulatory reforms by SEBI to streamline foreign investments.
Domestic Institutional Investors (DIIs)
DIIs are homegrown institutions that invest within the domestic economy. These include:
Indian mutual funds
Insurance companies (like LIC)
Banks and financial institutions
Pension and provident funds
DIIs use the domestic savings of Indian citizens and corporates to invest in the stock market. They play a stabilizing role, especially during times of FII outflows, as they understand local fundamentals better and are less influenced by global panic.
2. Evolution of FII and DII Flows in India
Early Years (1990s–2000s): FII Dominance
India opened its doors to FIIs in 1992, following economic liberalization. Initially, DIIs were small players, while FIIs brought in much-needed foreign capital. FIIs were viewed as indicators of global confidence in India’s economy.
During the 2003–2007 bull run, FII inflows touched record highs, coinciding with strong GDP growth and global liquidity.
However, during the 2008 Global Financial Crisis, FIIs pulled out over $11 billion, triggering a steep market correction.
Transition Phase (2010–2016): Rise of Domestic Investors
Post-2010, India saw the rise of mutual fund investing culture among retail investors, thanks to regulatory changes, awareness campaigns, and digital investing platforms.
The 2013 “taper tantrum” saw heavy FII outflows due to U.S. policy shifts.
However, DIIs—especially LIC and mutual funds—began absorbing selling pressure, signaling the beginning of a more balanced market.
Modern Era (2017–2024): The Balancing Act
This era marks the maturity of India’s investor base:
FIIs continued to drive momentum during global risk-on phases.
DIIs provided a strong counterweight during corrections.
The surge of SIPs (Systematic Investment Plans) provided steady inflows, making DIIs reliable long-term supporters.
For instance:
In 2020, during the pandemic crash, FIIs sold aggressively (~₹68,000 crore in March 2020), but DIIs bought significantly, cushioning the Nifty’s fall.
By 2021, when FIIs returned, the market surged to new highs.
In 2022, when FIIs turned net sellers due to Fed tightening, DIIs absorbed over ₹2.5 lakh crore worth of equities, displaying confidence in India’s growth story.
3. Factors Influencing FII Investment Patterns
a. Global Liquidity Conditions
When central banks like the U.S. Federal Reserve or the European Central Bank follow easy monetary policies, liquidity flows into emerging markets like India. Conversely, rate hikes or tightening cycles result in capital flight.
b. Currency Movements
A strong U.S. dollar often leads to FII withdrawals, as currency depreciation reduces returns in dollar terms.
For example, a fall in the rupee from 82 to 85 per USD can erode an FII’s returns even if the Nifty remains flat in rupee terms.
c. Global Risk Appetite
FIIs are sensitive to geopolitical tensions, global recessions, or risk aversion phases. During crises (like the Russia-Ukraine war or Middle East conflicts), FIIs often reduce exposure to emerging markets.
d. Domestic Fundamentals
Strong GDP growth, corporate earnings, stable politics, and structural reforms attract FIIs. India’s digital transformation, manufacturing incentives, and infrastructure push have recently boosted FII confidence.
4. Factors Influencing DII Investment Patterns
a. Domestic Savings and SIP Flows
Monthly SIP inflows—now over ₹20,000 crore—ensure a steady stream of liquidity for DIIs, regardless of market noise. This has made domestic mutual funds consistent buyers even during global uncertainty.
b. Valuation Comfort
DIIs are valuation-conscious. They often accumulate quality stocks during corrections when prices fall below long-term averages, showing contrarian behavior to FIIs.
c. Insurance and Pension Fund Flows
Institutions like LIC, EPFO, and NPS allocate a portion of their funds to equities. These are long-term investments, driven by actuarial goals rather than market timing.
d. Policy and Budget Announcements
Government spending, tax reforms, and policy continuity can encourage DIIs to take larger domestic positions, particularly in infrastructure, banking, and consumption sectors.
5. The Push and Pull Effect on Market Volatility
The interaction between FII and DII flows often explains short-term market volatility.
When both buy: Market rallies strongly (e.g., 2021 post-COVID recovery).
When both sell: Deep corrections occur (rare but seen during severe crises).
When FIIs sell but DIIs buy: Market stabilizes (e.g., 2022).
When FIIs buy but DIIs book profits: Market consolidates (profit-taking phase).
This constant tug-of-war adds depth and balance to the Indian market, reducing dependency on any single investor group.
6. The Impact of FII and DII Flows on the Rupee and Liquidity
Large-scale FII inflows strengthen the rupee by increasing demand for Indian assets, while outflows weaken it. The Reserve Bank of India (RBI) often intervenes to stabilize currency movements caused by volatile FII activity.
Meanwhile, steady DII flows act as an anchor, reducing the rupee’s vulnerability to external shocks.
Liquidity-wise:
FII inflows expand market liquidity and improve valuations.
DII inflows provide consistent participation and market depth.
7. Case Studies: Key Phases of FII-DII Dynamics
a. 2008 Global Financial Crisis
FIIs withdrew sharply amid global panic.
DIIs lacked sufficient scale to support markets.
The Sensex crashed nearly 60%.
b. 2020 Pandemic Crash and Recovery
FIIs sold aggressively in early 2020.
DIIs bought the dip, stabilizing markets.
FIIs returned later, driving a massive rebound.
c. 2022 Fed Tightening Cycle
FIIs turned sellers due to rising U.S. yields.
DIIs absorbed record outflows, showing resilience.
The Nifty remained range-bound despite global pressure, highlighting domestic maturity.
8. The Rise of Retail Power: Indirect Impact on DIIs
Retail investors, through SIPs and mutual funds, have transformed India’s market structure. Their monthly, disciplined inflows give DIIs steady ammunition.
This democratization of investing means domestic money is now powerful enough to offset even large FII outflows — a structural shift that has reduced India’s dependence on foreign capital.
9. The Road Ahead: Future Trends in FII and DII Patterns
a. Increasing DII Dominance
With over ₹50 lakh crore in AUM and growing retail participation, DIIs are likely to continue gaining influence, especially through passive investing and retirement funds.
b. Selective FII Participation
FIIs will remain significant but more selective. They may focus on sectors aligned with global trends—AI, clean energy, digital infrastructure, and Indian manufacturing.
c. Reduced Volatility
As both domestic and foreign capital deepen, the market will likely see lower volatility compared to earlier decades.
d. India’s Inclusion in Global Bond Indexes
Starting 2025, India’s inclusion in global bond indexes is expected to attract substantial FII debt inflows, complementing equity participation.
10. Conclusion: The Balance of Confidence
The relationship between FII and DII investment patterns reflects more than just capital movement—it represents the evolving confidence in India’s economy.
While FIIs bring global perspective and liquidity, DIIs provide stability, conviction, and resilience. Together, they create a balanced, self-reinforcing system that supports market growth even amid global uncertainty.
In the long run, India’s journey from being a foreign capital–driven market to a domestically anchored economy marks a milestone in financial maturity. As domestic savings rise and institutional depth increases, India is well-positioned to maintain a strong, sustainable market ecosystem where both FII and DII forces coexist—complementing rather than countering each other.
Introduction: Understanding Domestic Equity Markets1. What Are Domestic Equity Markets?
The domestic equity market refers to the marketplace within a country where stocks or shares of companies incorporated in that country are bought and sold. It differs from foreign equity markets, where investors trade shares listed in other countries.
When investors buy shares in a domestic company, they are essentially purchasing a small portion of ownership in that company. This ownership entitles them to a share of the profits (through dividends) and potential capital appreciation if the company grows in value.
Key Characteristics
Local Listings: Companies listed on domestic exchanges must comply with the country's regulatory framework.
Domestic Investors: Participants primarily include local individuals, institutions, and sometimes government agencies.
Currency: All transactions occur in the local currency (e.g., INR in India).
Regulation: Markets are governed by national financial authorities such as SEBI (Securities and Exchange Board of India), which ensures transparency and fairness.
2. Structure and Components of Domestic Equity Markets
Domestic equity markets are made up of several key components that together ensure smooth operation, liquidity, and trust.
a. Stock Exchanges
Stock exchanges are the primary platforms where shares are listed and traded. In India, the BSE (established in 1875) is Asia’s oldest exchange, while the NSE (founded in 1992) revolutionized trading with its electronic and transparent system. These exchanges facilitate both primary and secondary market activities.
b. Primary Market
The primary market is where new securities are issued for the first time. Companies raise funds by offering shares to the public through an Initial Public Offering (IPO) or Follow-on Public Offering (FPO).
This stage is crucial as it provides companies with capital for expansion and gives investors an opportunity to invest at the ground level.
c. Secondary Market
Once shares are issued, they are traded among investors in the secondary market. This segment provides liquidity, allowing investors to buy or sell their holdings anytime. The continuous buying and selling determine stock prices based on demand and supply dynamics.
d. Market Participants
Domestic equity markets attract a diverse range of participants:
Retail Investors: Individual investors trading for personal portfolios.
Institutional Investors: Mutual funds, insurance companies, and pension funds managing large pools of capital.
Foreign Institutional Investors (FIIs): Though part of the domestic exchange, they bring in global capital.
Market Makers and Brokers: Entities that ensure liquidity and execution of trades.
3. Role of Domestic Equity Markets in the Economy
The domestic equity market is not just a place for investors to earn returns—it is a critical pillar supporting economic development.
a. Capital Formation
Equity markets help companies raise long-term capital without borrowing. This capital fuels expansion, innovation, and job creation, contributing to GDP growth.
b. Wealth Creation
As companies grow and generate profits, their stock prices appreciate. Investors benefit through capital gains and dividends, leading to wealth accumulation and financial empowerment of citizens.
c. Resource Allocation
Equity markets efficiently allocate resources by channeling savings into productive investments. The performance of listed companies acts as a signal to attract or divert capital based on efficiency and profitability.
d. Economic Indicator
Stock market trends often mirror the broader economy. A rising market generally signals optimism about economic growth, while falling markets can reflect uncertainty or contraction.
e. Enhancing Corporate Governance
Listed companies are subject to strict disclosure and governance standards. Regular reporting builds transparency and accountability, improving overall business ethics and investor confidence.
4. Factors Influencing Domestic Equity Markets
Several internal and external factors influence the movement of domestic equity markets. Understanding these helps investors make informed decisions.
a. Economic Factors
GDP Growth: A growing economy usually means better business prospects, pushing stock prices higher.
Inflation: Moderate inflation is manageable, but high inflation erodes purchasing power and corporate profitability.
Interest Rates: Rising interest rates make borrowing costlier and reduce stock market appeal compared to fixed-income securities.
b. Corporate Performance
Quarterly earnings reports, management commentary, and future guidance play a crucial role in determining investor sentiment toward specific companies.
c. Government Policies
Fiscal policies, taxation, and reforms like “Make in India” or “PLI schemes” directly affect corporate profitability and investor confidence.
d. Global Influences
Even though domestic markets focus on local companies, they are not isolated. Global oil prices, U.S. Federal Reserve decisions, or geopolitical tensions often impact domestic equities.
e. Market Sentiment and Psychology
Sometimes, markets move more on emotions than on fundamentals. Herd behavior, speculation, or social media-driven sentiment can lead to sharp price swings—similar to what we saw during the “meme stock” trend.
5. Major Segments of Domestic Equity Markets
Domestic equity markets are classified into different segments based on company size, industry, and type of trading.
a. Large-cap, Mid-cap, and Small-cap Stocks
Large-cap: Stable, established companies with high market capitalization (e.g., Reliance, TCS).
Mid-cap: Growing firms with moderate capitalization offering higher growth potential but slightly higher risk.
Small-cap: Emerging or niche companies with lower market capitalization and higher volatility but potentially higher returns.
b. Sectoral Indices
Equity markets are divided into sectors like IT, Banking, FMCG, Energy, and Healthcare. Sectoral performance often reflects changing consumer behavior and policy priorities.
c. Derivatives Market
Futures and options allow traders to hedge risk or speculate on price movements, adding depth and liquidity to the overall market.
6. The Indian Domestic Equity Market Landscape
India’s equity market has evolved remarkably over the past three decades. From paper-based trading floors to fully digital platforms, the transformation has been revolutionary.
a. Growth and Global Recognition
The Indian market is now among the world’s top five in market capitalization. Indices like Nifty 50 and Sensex are globally tracked benchmarks representing economic progress.
b. Participation Expansion
Technological advances, mobile trading apps, and demat accounts have democratized investing. Retail participation surged post-2020, with millions of first-time investors entering the market.
c. Regulatory Framework
The Securities and Exchange Board of India (SEBI) plays a critical role in ensuring investor protection, market integrity, and corporate compliance. Regular audits, fair disclosure norms, and surveillance systems maintain transparency.
d. Emerging Trends
Rise of ESG Investing (Environmental, Social, Governance): Investors now prioritize sustainable and ethical companies.
SME & Startup Listings: Platforms like NSE Emerge support small and medium enterprises in raising capital.
Increased Algorithmic & Quant Trading: Technology-driven strategies enhance liquidity and efficiency.
7. Risks and Challenges in Domestic Equity Markets
While the equity market offers substantial opportunities, it is not without risks.
a. Market Volatility
Prices fluctuate due to economic or geopolitical factors. Investors must manage this risk through diversification and long-term perspective.
b. Liquidity Risk
Smaller-cap stocks or niche sectors may face low trading volumes, making it difficult to enter or exit positions without affecting prices.
c. Information Asymmetry
Despite regulations, insider information or misinformation can still distort fair market functioning.
d. Behavioral Biases
Emotional investing—such as chasing trends or panic selling—often leads to poor outcomes.
e. Regulatory and Policy Changes
Sudden shifts in taxation or compliance rules can temporarily disrupt markets and investor sentiment.
8. The Role of Technology in Domestic Equity Markets
Technology has transformed how markets operate and how investors participate.
a. Electronic Trading Systems
Automation has reduced transaction costs and improved execution speed and transparency.
b. Online Brokerage and Mobile Platforms
Retail investors can now trade from anywhere, access data analytics, and invest with minimal capital.
c. Artificial Intelligence and Big Data
AI-driven tools analyze market sentiment, patterns, and forecasts, empowering smarter investment decisions.
d. Blockchain Integration
Future markets may use blockchain for settlement, transparency, and security—reducing fraud and delays.
9. The Future of Domestic Equity Markets
Looking ahead, domestic equity markets are poised to play an even greater role in shaping economic growth and financial inclusion.
a. Deepening Retail Participation
Financial literacy programs and simplified digital access will bring millions of new investors into equity markets.
b. Integration with Global Markets
Domestic markets will increasingly align with global standards, attracting more foreign investments.
c. Sustainable and Impact Investing
The focus will shift toward long-term, responsible investments that support environmental and social goals.
d. Policy and Innovation Support
Government initiatives to boost entrepreneurship, infrastructure, and manufacturing will fuel new listings and investment opportunities.
Conclusion
Understanding domestic equity markets is essential for anyone interested in how economies grow, how companies fund innovation, and how individuals can build wealth. These markets represent the pulse of a nation’s economic vitality—reflecting collective expectations, aspirations, and confidence.
From traditional trading floors to algorithm-driven platforms, domestic equity markets have come a long way. They not only enable capital formation and wealth creation but also serve as powerful mechanisms of economic democracy—allowing ordinary citizens to become stakeholders in the country’s progress.
As India and other emerging economies continue to rise, domestic equity markets will remain the beating heart of their financial systems—driving growth, fostering innovation, and connecting people to prosperity.

Understanding Modern Consumption PatternsIntroduction: The Changing Face of Consumption
The way people consume goods and services has changed dramatically over the past few decades. Modern consumption is not just about purchasing necessities—it’s about experiences, identity, convenience, sustainability, and technology. Globalization, digitalization, and shifting cultural values have transformed the psychology and behavior of consumers worldwide. Today’s buyers are more informed, more connected, and more value-conscious than ever before. Understanding modern consumption patterns is crucial for businesses, policymakers, and economists, as these patterns influence production systems, marketing strategies, and even national economic growth.
1. The Shift from Ownership to Experience
One of the most striking trends in modern consumption is the transition from owning products to seeking experiences. Millennials and Gen Z consumers, in particular, are driving this shift. Instead of investing heavily in durable goods like cars or houses, many prefer spending on travel, entertainment, dining, and digital experiences.
This behavioral transformation is often described as the “experience economy.” Platforms such as Airbnb, Spotify, and Netflix exemplify this trend—offering access and enjoyment without ownership. The idea of “access over ownership” resonates with modern lifestyles that value flexibility and minimalism.
This shift also reflects deeper psychological and social changes. Experiences often provide emotional satisfaction and personal stories that physical goods cannot. Social media amplifies this effect by allowing consumers to share their experiences, creating a loop of social validation and aspirational living.
2. The Role of Digital Transformation
The rise of e-commerce and digital ecosystems has revolutionized consumption patterns. From Amazon to Alibaba, online shopping has made purchasing convenient, borderless, and data-driven. The 24/7 availability of products, along with quick delivery and easy returns, has made online buying the new normal.
Moreover, AI-driven personalization plays a critical role. Algorithms analyze browsing habits, purchase histories, and even search keywords to offer tailor-made product recommendations. Consumers are no longer passive participants—they interact with brands through reviews, ratings, and social feedback, shaping market trends in real time.
Mobile commerce is another force reshaping consumption. With smartphones in every hand, shopping happens everywhere—from metro rides to coffee breaks. Social commerce, where purchases are made directly via platforms like Instagram or TikTok, blurs the line between social interaction and consumerism.
3. Conscious and Sustainable Consumption
Modern consumers are increasingly environmentally aware and socially responsible. The rise of sustainable consumption is a direct response to climate change, resource depletion, and ethical concerns over labor practices.
Buyers today ask questions like:
Is this product eco-friendly?
Is it made ethically and locally?
Can it be recycled or reused?
Brands such as Patagonia, Tesla, and IKEA have successfully aligned themselves with sustainability narratives, attracting loyal customers who want their spending to reflect their values. This trend has led to the growth of circular economies, emphasizing reuse, repair, and recycling rather than linear production and disposal.
Greenwashing, however, is a growing concern. Some brands market themselves as sustainable without making substantial environmental commitments. This has pushed consumers to demand transparency through product labeling, supply chain visibility, and third-party certifications.
4. The Influence of Social Media and Influencer Culture
Social media has turned consumption into a social activity rather than a private decision. Platforms like Instagram, YouTube, and TikTok influence purchasing decisions by showcasing lifestyles, trends, and products through creators and influencers.
Influencers—often seen as relatable figures—shape consumer opinions more powerfully than traditional advertisements. Their reviews and endorsements make products appear authentic and attainable. This peer-based trust model has redefined how marketing works, especially among younger demographics.
However, the same ecosystem can lead to overconsumption and status anxiety. The constant exposure to curated images of luxury lifestyles encourages impulsive purchases and material comparison. The rise of “de-influencing” movements—where creators encourage minimalism or mindful spending—shows that even within social media, there is a countercurrent toward responsible consumption.
5. Demographic and Generational Shifts
Different generations exhibit distinct consumption behaviors shaped by their economic and technological environments.
Baby Boomers (born 1946–1964) still represent significant purchasing power, especially in real estate, healthcare, and luxury goods.
Generation X (born 1965–1980) values practicality, brand reliability, and work-life balance.
Millennials (born 1981–1996) prioritize experiences, convenience, and sustainability.
Generation Z (born after 1996) are digital natives—highly connected, socially aware, and experimental with brands.
Gen Z’s rise as a consumer force is particularly influential. They prefer brands with authenticity, inclusivity, and social responsibility. They also value digital-first interactions and expect seamless integration between online and offline experiences.
6. The Data-Driven Consumer Economy
In the modern age, data is the new currency. Every click, purchase, and search contributes to a consumer data trail that companies analyze to forecast trends and personalize offers.
From predictive analytics to AI-powered marketing, businesses can now anticipate consumer needs even before they are consciously expressed. Subscription models and loyalty programs use behavioral data to create recurring revenue streams.
However, this also raises serious privacy and ethical concerns. Consumers are becoming more aware of how their personal data is used. The introduction of regulations like GDPR (Europe) and DPDP (India) reflects growing efforts to protect user privacy. Future consumption models will need to balance personalization with transparency and consent.
7. The Rise of Convenience and Instant Gratification
Modern consumers live in an age of speed and convenience. Food delivery apps, one-click payments, same-day shipping, and on-demand entertainment all feed the desire for instant gratification.
This culture has redefined expectations—waiting is no longer tolerated. Retailers and service providers compete not only on price or quality but also on delivery speed, ease of use, and customer support efficiency.
However, this convenience culture also contributes to unsustainable consumption patterns, as the demand for instant products often leads to excessive packaging, high carbon footprints from logistics, and impulse purchases that result in waste.
8. Localization and Personal Identity in Global Markets
While globalization has expanded access to international goods, there is also a resurgence of local consumption. Consumers increasingly value products that represent local culture, authenticity, and craftsmanship. This trend is seen in the popularity of farm-to-table restaurants, handmade goods, and regional brands.
In countries like India, “vocal for local” campaigns have encouraged support for domestic industries and artisans. Similarly, many Western consumers seek unique, personalized products instead of mass-produced items.
Modern consumption is thus becoming glocal—a mix of global access and local identity. It reflects the desire for individuality in a world dominated by mass production.
9. The Subscription and Sharing Economy
The subscription model—from Netflix to meal kits to SaaS tools—represents a fundamental shift from one-time purchases to continuous relationships between brands and consumers. It creates predictable revenue for businesses and convenience for consumers who prefer flexibility over ownership.
Similarly, the sharing economy—typified by Uber, Airbnb, and community tool-sharing platforms—has transformed consumption into collaborative access. Instead of owning a car, you can share one; instead of buying a power drill you use once a year, you can rent it.
This shift is both economically efficient and environmentally beneficial, reducing waste and optimizing resource use. However, it also creates challenges in regulation, taxation, and labor rights, as seen in the gig economy debates.
10. Economic and Psychological Drivers
Understanding consumption patterns also requires exploring economic and psychological motives.
Economically, rising disposable incomes in emerging markets, coupled with easy credit and digital payment systems, have accelerated spending. Psychologically, consumption is deeply tied to identity formation and emotional fulfillment. Buying behavior often reflects aspirations, social belonging, and even self-expression.
The concept of “retail therapy”—shopping as a mood enhancer—shows the emotional side of consumption. However, post-pandemic behavioral studies reveal a growing shift toward mindful spending and financial caution, especially as inflation and global uncertainties affect household budgets.
11. Post-Pandemic Consumer Behavior
The COVID-19 pandemic marked a turning point in global consumption. Lockdowns accelerated e-commerce adoption, remote work increased demand for home improvement and digital gadgets, and health-consciousness soared.
Consumers became more selective, focusing on essential goods, health, and wellness. Simultaneously, digital payment systems, contactless delivery, and virtual experiences (such as online fitness or education) became mainstream.
Even after the pandemic, many of these habits have persisted, forming a hybrid consumption model—a blend of physical and digital experiences known as phygital retail.
12. The Future of Consumption: Personalization, Ethics, and Technology
Looking ahead, modern consumption will be shaped by three powerful forces:
Hyper-personalization through AI and machine learning, where products and services are tailored to individual needs.
Ethical and inclusive consumerism, focusing on equality, diversity, and transparency.
Technological integration, with AR/VR shopping experiences, blockchain-based product authentication, and the growth of virtual goods in digital worlds (metaverse consumption).
Consumers will expect brands not only to sell but also to stand for something—values, sustainability, or community engagement.
Conclusion: Toward Mindful Modern Consumption
Modern consumption patterns reflect a complex interplay of technology, psychology, and social values. Consumers today are informed, connected, and empowered—but also more demanding and conscious of their impact.
Businesses that thrive in this environment are those that understand why people buy, not just what they buy. The future of consumption lies in balancing convenience with sustainability, personalization with privacy, and global access with local authenticity.
In essence, modern consumption is a mirror of modern life—dynamic, digital, and deeply human. Understanding it means understanding how society itself evolves.

What Are MEME Stocks? The Viral Phenomenon Explained1. Understanding Meme Stocks
Meme stocks are shares of companies that gain sudden popularity and price surges primarily through social media hype rather than financial metrics. Platforms like Reddit (r/WallStreetBets), Twitter (now X), YouTube, and TikTok play a key role in spreading discussions, memes, and buying calls.
Unlike traditional stocks whose prices are influenced by earnings reports or macroeconomic indicators, meme stocks move largely on viral momentum. A meme stock’s rise often begins when a group of retail investors collectively decide to buy shares — not necessarily because the company has strong fundamentals, but because they believe they can drive up the price together.
This phenomenon democratized market influence, empowering small investors to move prices once thought controllable only by large institutions.
2. The Spark: GameStop and AMC Revolution
The meme stock phenomenon entered the mainstream in January 2021 during the GameStop (GME) short squeeze saga.
GameStop, a struggling American video game retailer, had been heavily shorted by hedge funds betting that its price would fall. Retail traders on Reddit’s r/WallStreetBets noticed this excessive short interest and decided to buy and hold GME shares en masse, creating a short squeeze — a scenario where short sellers are forced to buy back shares to cover their positions, driving prices even higher.
The stock skyrocketed from around $20 to nearly $500 within weeks.
Soon after, AMC Entertainment, BlackBerry, and Bed Bath & Beyond became part of the same movement. For many retail traders, this wasn’t just about profits — it was a symbolic battle of the small investor versus Wall Street elites. It represented a collective digital uprising, coordinated not by analysts or hedge funds but by memes, emojis, and hashtags.
3. How Social Media Fueled the Frenzy
The rise of meme stocks is inseparable from the influence of social media communities. Platforms like Reddit and Twitter became virtual trading floors, where users shared screenshots of trades, jokes about hedge funds, and rallying cries like “Hold the Line!” or “To the Moon!”.
Memes — humorous images or catchphrases — acted as emotional fuel. They simplified complex financial concepts into shareable content, creating a sense of belonging among retail traders. Instead of dry market analysis, posts often carried cultural energy, blending humor, defiance, and optimism.
Moreover, apps like Robinhood provided zero-commission trading and gamified interfaces, encouraging participation from young, first-time investors. This convergence of technology, humor, and finance birthed a new breed of traders who saw the market not only as a profit engine but also as a social movement.
4. The Psychology Behind Meme Stocks
At its core, the meme stock mania is as much about emotion as it is about economics. Several psychological forces drive this movement:
a) Fear of Missing Out (FOMO)
When investors see others posting massive profits online, they rush to join in before “it’s too late.” The viral nature of meme stocks amplifies this herd behavior.
b) The Power of Community
Online forums give traders a sense of unity. It’s not just about making money — it’s about belonging to a digital tribe with shared goals, humor, and enemies (often Wall Street).
c) Revenge Trading
For many, buying meme stocks was a symbolic act of resistance against institutional investors. The 2008 financial crisis left deep scars, and this movement became a way for retail traders to “fight back.”
d) Speculative Thrill
Meme stocks offer the excitement of massive short-term gains. The adrenaline rush from volatile price moves creates a gambling-like experience, which can be addictive.
e) The “Diamond Hands” Mentality
A popular meme phrase, diamond hands, refers to holding onto a stock despite volatility, symbolizing loyalty and resilience against selling pressure.
Together, these psychological drivers created a feedback loop — social excitement drove price rallies, and rising prices fueled even greater enthusiasm.
5. The Role of Technology and Retail Platforms
The meme stock revolution wouldn’t have been possible without the technological democratization of trading. Mobile apps like Robinhood, Zerodha, Groww, and Webull broke down barriers that once favored institutional players.
Key enablers included:
Zero-commission trading, making frequent transactions affordable.
Fractional investing, allowing users to buy parts of expensive shares.
Easy access to market data and real-time discussions.
Social trading communities, where users share strategies and screenshots.
Technology turned investing into a viral experience, merging finance with digital culture. What was once a Wall Street-exclusive domain became an open playground for anyone with a smartphone.
6. Fundamental vs. Sentimental Value
Traditional investors analyze fundamentals — revenue, profits, balance sheets, and future prospects. Meme stock traders, however, operate on sentimental value — the shared belief that a stock’s price can rise simply because enough people want it to.
In meme stocks:
Valuation is often disconnected from fundamentals.
Price is driven by social momentum rather than intrinsic worth.
Sentiment is volatile and can shift overnight.
This emotional market behavior challenges classic theories of efficient markets, suggesting that modern finance is also a theater of collective psychology.
7. The Aftermath: Volatility and Reality Check
While some early traders made fortunes, most late entrants faced heavy losses as prices crashed once the hype faded. For instance:
GameStop (GME) fell over 80% from its peak after the initial mania.
AMC Entertainment (AMC) also retraced most of its gains.
These crashes highlighted a crucial truth: momentum-based markets are unsustainable without continuous new demand. Meme stocks are often volatile and speculative, resembling short-term trading battles rather than long-term investments.
However, the phenomenon left an enduring mark — it revealed that collective retail investors can move markets, a notion once thought impossible.
8. Meme Stocks in India: A Growing Trend
While the meme stock craze originated in the U.S., India, too, is witnessing its own version. Platforms like Twitter (X), Telegram, and YouTube have become hubs where traders discuss small-cap or penny stocks that can “explode.”
Stocks such as Suzlon Energy, Vodafone Idea, Zomato, and Paytm have at times displayed meme-like behavior — where social buzz, not fundamentals, triggered sharp rallies.
This trend is especially visible among young investors who entered markets post-2020, drawn by social media content and a desire for fast profits. Though not as extreme as GameStop’s story, the Indian market’s growing retail participation shows similar psychological patterns — community-driven speculation, influencer effects, and herd excitement.
9. Risks and Regulatory Concerns
Meme stock trading brings both opportunity and danger. Regulators worldwide, including SEBI and the U.S. SEC, have raised concerns over market manipulation and misinformation.
Key risks include:
Extreme volatility, leading to rapid losses.
Pump-and-dump schemes, where influencers artificially inflate prices.
Emotional decision-making, ignoring risk management.
Platform restrictions, as seen when trading apps halted meme stock orders in 2021 due to liquidity stress.
Regulators now monitor online discussions and social trading platforms more closely to prevent coordinated manipulation.
10. Lessons for Investors
The meme stock era offers valuable takeaways for traders and long-term investors alike:
Understand Market Psychology: Price moves are not always rational. Emotions and narratives often overpower fundamentals.
Avoid Herd Mentality: Entering trades solely because “everyone else is doing it” can be disastrous.
Do Your Own Research (DYOR): Always analyze a company’s financial health before investing.
Diversify: Don’t put all your capital in one speculative play.
Separate Entertainment from Investment: Trading for fun is fine — but never risk money you can’t afford to lose.
11. The Cultural Impact of Meme Stocks
Beyond finance, meme stocks became a pop-culture event. They inspired documentaries, news debates, and even movies (like Dumb Money, released in 2023).
They also reshaped public perception of investing. Millions of young people who had never cared about the stock market began to see trading as accessible, even cool.
The term “stonks” (a humorous take on “stocks”) became a symbol of modern finance — blending irony, humor, and rebellion. Meme stocks thus bridged two worlds: Wall Street’s seriousness and the internet’s playfulness.
12. The Future of Meme Stocks
Will meme stocks fade away? Not entirely.
While the 2021 mania may not return in the same form, social-driven investing is here to stay. Platforms now integrate community discussions directly into trading apps, and sentiment analysis tools are being used by institutions to monitor online chatter.
In India, the rise of finfluencers (financial influencers) mirrors this global shift — where retail narratives can sway short-term market sentiment. Future meme stocks might emerge around trending sectors like renewable energy, EVs, or AI, driven by excitement and online buzz.
However, with greater awareness and regulation, the next wave may be more structured and transparent, balancing social energy with financial prudence.
Conclusion: The Meme Stock Legacy
The meme stock revolution redefined what it means to “invest.” It blurred lines between trading and activism, community and speculation, humor and finance.
It revealed a deeper truth — that markets are not just mechanical systems of numbers and charts, but human arenas of belief, behavior, and shared emotion.
While many lost money chasing viral trends, the movement empowered millions to learn, engage, and question long-standing power dynamics in finance.
In the end, meme stocks symbolize more than speculative chaos — they represent the digital democratization of investing, where anyone, anywhere, can shape the market narrative with nothing more than a smartphone, a meme, and a mission.

The Cost of Common Trading Mistakes1. The Price of Poor Risk Management
Perhaps the single most costly mistake in trading is the failure to manage risk effectively. Risk management isn’t exciting — it’s not about predicting which stock will rally or when the market will crash — but it’s what separates long-term survivors from those who blow up their accounts.
The mistake: Traders often risk too much on a single position or fail to use stop-losses. They believe “this trade can’t go wrong,” which is usually when it does.
The cost: A single large loss can wipe out weeks or even months of steady gains. For instance, risking 20% of capital per trade means losing just five trades in a row could reduce your account by over 60%.
The fix: Never risk more than 1–2% of your capital on any single trade. Always define exit points before entering. Position sizing and disciplined stop-loss placement are your best defense against market uncertainty.
In trading, your number one job is not to make money — it’s to protect your capital.
2. Overtrading: When Action Becomes Addiction
Overtrading is one of the most silent killers of profitability. The temptation to “always be in the market” arises from boredom, greed, or the illusion of control.
The mistake: Taking too many trades in a day or week, often without solid setups or edge.
The cost: High transaction costs, emotional fatigue, and poor decision-making. Frequent trades erode profits through brokerage fees and slippage. More importantly, it leads to mental exhaustion, increasing the likelihood of impulsive actions.
The fix: Focus on quality, not quantity. A single high-probability setup can be more profitable than 10 random ones. Define your trading plan and stick to it — trade only when the odds align with your edge.
Remember: patience pays more than constant participation.
3. Ignoring the Power of Emotions
Trading is as much a psychological game as it is a financial one. Emotions like fear, greed, and impatience cloud rational judgment, turning what should be a strategic activity into an emotional rollercoaster.
The mistake: Traders panic-sell during drawdowns or chase prices when they see momentum building.
The cost: Fear often causes traders to exit winning positions too early, while greed makes them hold losing ones for too long. Both habits destroy risk-reward balance and long-term profitability.
The fix: Develop emotional discipline. Stick to predefined rules. Consider journaling your trades and feelings to identify emotional triggers. Meditation, mindfulness, or even stepping away from screens can help maintain balance.
Markets reward logic, not emotion.
4. Lack of a Trading Plan
Without a structured plan, trading becomes guesswork — and guesswork rarely pays.
The mistake: Many traders enter trades based on “gut feeling” or tips from others. They lack clear entry and exit rules, risk limits, or defined objectives.
The cost: Inconsistent results and an inability to measure performance. Without a plan, traders don’t know what’s working or failing, making improvement impossible.
The fix: Every trader should build a Trading Plan that includes:
Market selection (e.g., equities, commodities, forex)
Entry/exit rules
Stop-loss and take-profit strategy
Risk per trade
Maximum drawdown tolerance
Time commitment and review schedule
Once you have a plan — follow it with discipline. Adjust it only after analyzing sufficient data, not on emotion.
5. The Dangers of Averaging Down
Averaging down — buying more of a losing position — is one of the most expensive mistakes traders make. It stems from ego and denial.
The mistake: When a stock drops, traders add more, believing it’s “cheaper now.” They hope the market will reverse.
The cost: If the trend continues downward, losses multiply quickly. Averaging down can turn a small, manageable loss into a portfolio disaster.
The fix: Respect stop-losses. Never add to a losing trade unless it’s part of a pre-tested, rule-based scaling strategy. The best traders add to winning positions, not losing ones.
Hope is not a trading strategy.
6. FOMO and Chasing Trends
The Fear of Missing Out (FOMO) is a modern-day trading plague. Watching others profit from a sharp rally often triggers impulsive buying — usually right before the trend reverses.
The mistake: Entering trades too late, when prices are overextended.
The cost: Buying at tops and selling at bottoms. The emotional rush of chasing momentum leads to poor entries and steep losses.
The fix: Accept that missing some moves is part of trading. Opportunities never end; markets are infinite. Instead of chasing, plan your entries ahead — set alerts and wait for pullbacks.
Discipline will always beat excitement.
7. Neglecting Market Conditions
A strategy that works in a trending market might fail miserably in a choppy one. Many traders ignore the context in which they are trading.
The mistake: Applying the same approach regardless of volatility, liquidity, or trend conditions.
The cost: Misaligned trades — for example, trend-following in sideways markets or scalping in low-volume environments.
The fix: Always assess market structure before trading. Identify whether the market is trending, consolidating, or reversing. Adjust position size, targets, and stop-loss accordingly.
Adaptation is the hallmark of professional trading.
8. Lack of Continuous Learning
Markets evolve — what worked yesterday might not work tomorrow. Many traders, after some early success, stop learning and refining their edge.
The mistake: Relying on outdated strategies or ignoring new tools like algorithmic signals, volume profiles, or AI-based analysis.
The cost: Reduced performance and missed opportunities. The cost of stagnation is gradual but devastating.
The fix: Treat trading as a lifelong learning process. Read, backtest, follow credible analysts, and review your trades weekly. Stay flexible and open-minded.
In trading, education is cheaper than ignorance.
9. Ignoring Position Sizing
Even with a good strategy, poor position sizing can lead to disaster.
The mistake: Betting too big when confident and too small when uncertain — purely based on emotion.
The cost: Volatile results and emotional burnout. Large positions increase stress and magnify mistakes.
The fix: Use a consistent formula, such as the 2% rule, meaning you risk only 2% of capital per trade. Position sizing should depend on stop-loss distance and account equity, not “gut feeling.”
Consistency builds compounding.
10. Revenge Trading
After a loss, some traders immediately jump into another trade, desperate to recover. This is known as revenge trading — a fast track to bigger losses.
The mistake: Trading emotionally after a setback without analysis or patience.
The cost: Poor entries, disregard for setups, and compounding losses. It also damages psychological balance.
The fix: Accept losses as part of the business. Take a break after significant drawdowns. Review what went wrong before returning to the market.
In trading, emotional control is wealth control.
11. Neglecting Data and Journaling
Professional traders analyze data — amateur traders rely on memory. The absence of trade journaling means lessons are forgotten, and mistakes are repeated.
The mistake: Not recording trades, reasoning, and emotional state.
The cost: Inability to identify patterns of success or failure. Without analytics, improvement is random.
The fix: Maintain a trading journal noting entry/exit points, market context, emotions, and results. Over time, this becomes a goldmine of self-knowledge.
You can’t fix what you don’t measure.
12. Blindly Following Others
Social media, Telegram groups, and “expert” calls have created a dangerous herd mentality in trading.
The mistake: Copying trades of others without understanding the logic behind them.
The cost: When trades go wrong — and they often do — followers panic because they lack conviction. Losses multiply due to delayed exits and emotional confusion.
The fix: Learn from others but think independently. Build your own thesis for every trade. Blind faith in “tips” is financial suicide.
Confidence comes from clarity, not consensus.
13. Neglecting the Broader Picture
Focusing only on charts and ignoring macroeconomic factors is another costly error. Economic data, interest rates, and geopolitical events shape price behavior.
The mistake: Overreliance on technicals without considering news or sentiment shifts.
The cost: Unexpected volatility and stop-loss hits during major announcements.
The fix: Combine technical and fundamental awareness. Track calendars for earnings, policy announcements, and macro events.
Markets move because of context, not just candles.
14. Misunderstanding Leverage
Leverage amplifies both profits and losses. Many traders misuse it, seduced by the idea of “fast money.”
The mistake: Using excessive leverage without understanding margin requirements or potential drawdowns.
The cost: A small price move against your position can trigger a margin call or total account wipeout.
The fix: Use leverage cautiously. Consider it a double-edged sword. If your system isn’t consistently profitable, leverage will only accelerate losses.
Leverage doesn’t make you rich — discipline does.
15. Failure to Accept Mistakes
The most expensive mistake of all is not learning from mistakes. Every loss has a lesson, but many traders refuse to confront their errors, blaming the market instead.
The mistake: Denial of responsibility and lack of self-assessment.
The cost: Repeating the same pattern until the account is gone.
The fix: Treat every loss as data, not defeat. Review trades weekly. Identify recurring errors and eliminate them.
In trading, humility pays compound interest.
Conclusion: Every Mistake Has a Price — Learn Before You Pay
Trading mistakes are inevitable — but repeating them is optional. Every poor decision has a financial cost, an emotional cost, and an opportunity cost. What separates successful traders from struggling ones isn’t luck or genius; it’s the willingness to analyze, adapt, and evolve.
Avoiding these common mistakes won’t make you instantly rich, but it will prevent you from going broke — and in trading, that’s the real foundation of success.
Master your risk, control your emotions, plan your trades, and treat every mistake as a tuition fee paid to the market. Over time, those lessons compound — just like profits do.
Part 8 Trading Master ClassAdvantages of Option Trading
Leverage: Traders can control large positions with smaller capital.
Flexibility: Suitable for speculation, hedging, or income generation.
Limited Risk (for buyers): Buyers can lose only the premium paid.
Hedging: Protects portfolios against adverse price movements.
Income Generation: Selling options allows investors to earn consistent premium income.

Part 7 Trading Master ClassOption Greeks: Measuring Sensitivity
Professional traders use “Greeks” to assess how option prices change with market variables:
Delta (Δ): Measures the rate of change in option price relative to the underlying asset’s price.
Gamma (Γ): Measures how Delta changes with price movement.
Theta (Θ): Represents time decay – how much value an option loses daily as expiry nears.
Vega (ν): Sensitivity to volatility changes.
Rho (ρ): Sensitivity to interest rate changes.
Understanding Greeks helps traders manage portfolio risks and design advanced strategies.

Part 6 Learn Instiutitonal Trading Factors Influencing Option Prices
Option prices (premiums) are affected by several variables, collectively analyzed under option pricing models such as the Black-Scholes model. The main factors include:
Underlying Asset Price: Higher prices increase call premiums and decrease put premiums.
Strike Price: The closer the strike price is to the current price, the higher the premium.
Volatility: More volatility means higher premiums due to increased uncertainty.
Time to Expiry: Longer durations mean more time value.
Interest Rates: Higher interest rates slightly increase call premiums.
Dividends: Expected dividends can reduce call premiums and increase put premiums.

Part 4 Learn Instiutitonal Trading Intrinsic and Time Value
An option’s premium has two parts:
Intrinsic Value: The amount by which an option is “in the money.”
For a call option, it’s the difference between the current price and the strike price.
For a put option, it’s the difference between the strike price and the current price.
Time Value: Represents the potential for the option to gain more value before expiration. The longer the time to expiry, the higher the time value.
Example:
If a stock is trading at ₹1,200 and a call option with a strike price of ₹1,000 is priced at ₹220, then:
Intrinsic Value = ₹200 (₹1,200 - ₹1,000)
Time Value = ₹20 (₹220 - ₹200)

Part 3 Learn Institutional TradingHow Option Trading Works
Option trading involves two main parties: the buyer and the seller (writer).
The buyer pays a premium and gets the right (not obligation) to buy or sell the underlying asset.
The seller receives the premium and takes on the obligation to buy or sell the asset if the buyer exercises the option.
Let’s take an example:
Suppose a trader buys a call option for Stock A with a strike price of ₹1,000, paying a premium of ₹50. If the stock rises to ₹1,100, the trader can exercise the option to buy at ₹1,000 and sell at ₹1,100, earning ₹100 per share (minus the ₹50 premium). The profit is ₹50 per share.
If the stock stays below ₹1,000, the trader won’t exercise the option and only loses the ₹50 premium paid.

Part 2 Ride The Big Moves Key Components of an Option Contract
To understand option trading, it’s essential to know the basic elements that define each contract:
Underlying Asset: The financial instrument (stock, index, currency, or commodity) on which the option is based.
Strike Price: The price at which the option holder can buy or sell the asset.
Expiration Date: The date on which the option contract expires. After this date, the option becomes worthless if not exercised.
Premium: The price paid by the buyer to the seller (writer) of the option.
Lot Size: The number of units of the underlying asset in one option contract (for example, 50 shares per lot).

Part 1 Ride The Big Moves What Are Options?
An option is a financial contract that gives the buyer the right, but not the obligation**, to buy or sell an underlying asset at a predetermined price (called the strike price) before or on a specific date (the expiry date).
Options are categorized into two types:
Call Option: Grants the holder the right to buy the underlying asset.
Put Option: Grants the holder the right to sell the underlying asset.
For example, if an investor believes a stock’s price will rise, they might buy a call option. Conversely, if they expect the price to fall, they might buy a put option.

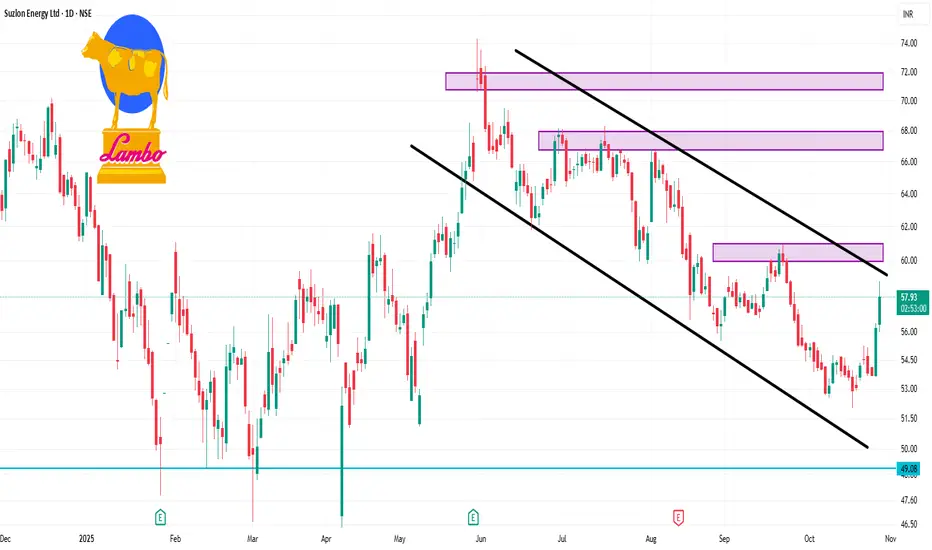
SUZLON 1 Day Time Frame📌 Current price
The stock is trading around ₹53.82 (latest close) according to multiple sources.
🔍 Key levels for the day
Pivot / reference zone: ~ ₹54.22.
Resistance levels:
R1 ~ ₹54.79
R2 ~ ₹55.75
R3 ~ ₹56.32
Support levels:
S1 ~ ₹53.26
S2 ~ ₹52.69
S3 ~ ₹51.73
SAIL 1 Day Time Frame 🔍 Price Snapshot
Last traded price: ~ ₹129.46.
Day’s range: approximately ₹129.11 – ₹131.88.
52-week range: about ₹99.15 (low) to ₹139.98 (high).
📈 Key Technical Levels
Support zone: Around ₹128-₹129 region (close to current price and recent intraday lows)
Resistance zone: Around ₹131.5-₹133 region, as the upper end of the recent daily range
If price breaks down below ~ ₹128 with volume, next support to watch could be toward ~ ₹120-₹118 (longer-term).
If price breaks out above ~ ₹133, target could move toward the 52-week high near ~ ₹139-₹140.

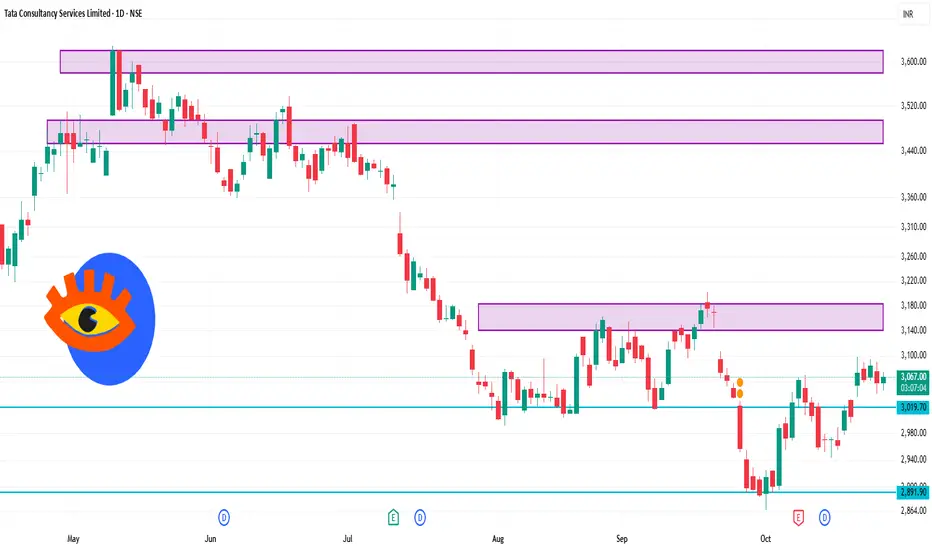
TCS 1 Day Time Frame Current price: ~ ₹3,063.20.
Day’s range (approx): ~ ₹3,041 – ₹3,090.
52-week range: ~ ₹2,867.60 (low) to ₹4,494.90 (high).
🔍 Key support & resistance (based on current structure)
Support zone 1: ~ ₹3,000 – where the price is hovering—psychological and near recent consolidation.
Support zone 2: ~ ₹2,940 – a stronger lower bound if the current support fails.
Resistance zone 1: ~ ₹3,150 – near the day’s high and recent supply.
Resistance zone 2: ~ ₹3,250 – upper structure/resistance from recent swing highs.
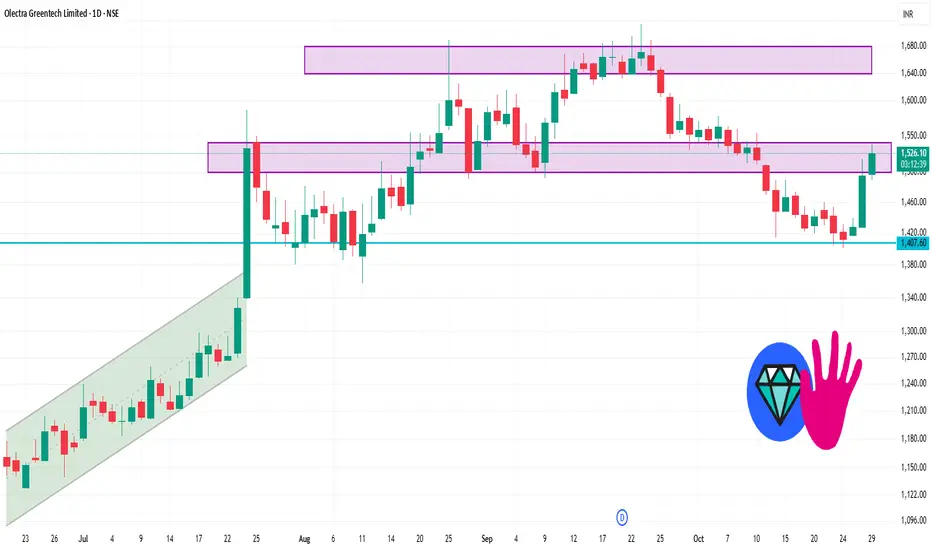
OLECTRA 1 Day Time Frame ✅ Important Levels
From pivot-point calculations:
Pivot (daily central pivot approx): ~ ₹ 1,479.83 (Standard)
First resistance (R1): ~ ₹ 1,533.37 (Standard)
Second resistance (R2): ~ ₹ 1,571.43
First support (S1): ~ ₹ 1,441.77
Second support (S2): ~ ₹ 1,388.23
HCC 1 Week Time Frame 📌 Key Levels (approximate, in ₹)
Current price: ~ ₹28.30.
Support zone:
~ ₹27.10 to ₹27.70 (recent low area)
A more “significant” lower support around ~ ₹23.80-₹22.60 (longer-term)
Resistance zone:
Near ~ ₹29.00-₹29.50 (short‐term barrier)
Further resistance ~ ₹36.40 and then ~ ₹46.99 (medium/longer-term)

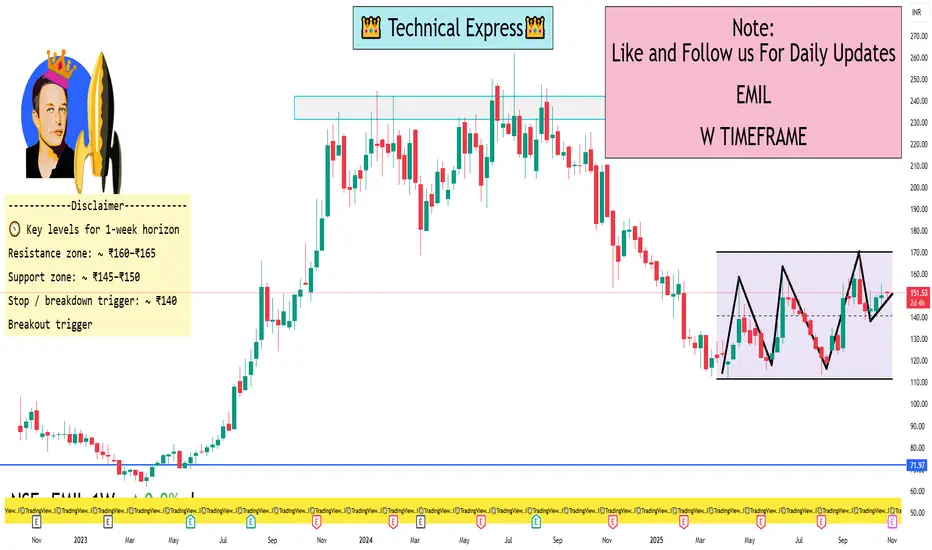
EMIL 1 week time frame 📌 Current price context
Latest price is approx ₹150–₹155.
52-week range: low ~ ₹111, high ~ ₹210+.
The stock is trading in a consolidation zone after previous down move.
🧭 Key levels for 1-week horizon
Resistance zone: ~ ₹160–₹165. This is where recent uptick may stall, supply could appear.
Support zone: ~ ₹145–₹150. If price drifts down, this is the region to watch for a bounce.
Stop / breakdown trigger: ~ ₹140. If price decisively breaks below ₹145–150 and heads toward ₹140, risk of further downside increases.
Breakout trigger: If price clears ~ ₹165 with strong volume, next upside gate opens (~ ₹175+) but prior highs near ~₹210 act as long-term resistance.
AWL 1 Day View✅ Key levels
Based on multiple sources:
Support zone (near term): ~ ₹ 249.60.
Support zone 2: ~ ₹ 236.45 on a broader timeframe.
Resistance zone (near term): ~ ₹ 271.10.
Broader resistance: ~ ₹ 280.50 – ₹ 290.90 range.
Pivot / daily reference levels (classic):
Pivot ~ ₹ 265.42
R1 ~ ₹ 267.58
S1 ~ ₹ 262.08

The Need to Boost Trading Performance1. The Evolving Nature of Markets
Over the past decade, financial markets have transformed dramatically. Technological advancements, algorithmic trading, artificial intelligence, and global interconnectivity have made markets faster and more unpredictable. Retail participation has also grown significantly, bringing in new dynamics of momentum, liquidity, and volatility.
In such an environment, a trader who doesn’t adapt risks being left behind. A strategy that once delivered consistent returns may underperform as market structures change. Therefore, performance optimization isn’t just about improving returns—it’s about staying relevant.
Boosting performance means refining your edge amid changing volatility, sector rotation, and behavioral shifts. Whether you trade intraday, swing, or positional setups, continual enhancement of analysis, risk management, and execution is the foundation of longevity.
2. Understanding What “Trading Performance” Truly Means
Many traders equate performance with profits, but that’s a narrow definition. Real trading performance is multidimensional—it involves how efficiently you analyze, manage risk, execute trades, control emotions, and learn from outcomes.
True trading performance can be broken into these key elements:
Accuracy: How often your setups work as expected.
Risk Efficiency: How much you lose when you’re wrong versus what you gain when you’re right.
Consistency: The ability to sustain performance across different market cycles.
Execution Quality: How well you enter and exit trades relative to your plan.
Psychological Control: How well you handle stress, greed, and fear.
In essence, boosting trading performance means optimizing each of these components—not just chasing higher profits.
3. The Role of Psychology in Performance Enhancement
One of the most overlooked areas in trading performance is trading psychology. Markets are designed to exploit emotional weakness. Fear makes traders exit too early; greed makes them overstay; impatience makes them overtrade.
To boost performance, traders must master their mindset as much as their technical tools. Developing emotional resilience ensures that decision-making remains rational and data-driven.
Common psychological barriers to performance include:
Overconfidence after a winning streak — leading to oversized positions.
Loss aversion — refusing to accept small losses that later become big ones.
Revenge trading — trying to “win back” after a bad trade.
FOMO (Fear of Missing Out) — jumping into trades without confirmation.
Performance-oriented traders build habits to overcome these pitfalls: journaling, post-trade reviews, mindfulness, and strict adherence to pre-defined plans.
As the saying goes, “Amateurs think about profits; professionals think about process.”
4. Data-Driven Performance Tracking
You can’t improve what you don’t measure. The best traders treat their performance like a business metric. They analyze each trade’s data—entry, exit, reasoning, and emotional state.
Keeping a trading journal is essential for performance optimization. It helps identify:
Which setups yield the best risk-reward.
Which timeframes or conditions perform better.
What psychological patterns influence bad decisions.
Performance tracking transforms trading from a random activity into a process of continuous learning.
With technology today, traders can use platforms and analytics tools to review win rates, expectancy, and profit factors in detail. The more insight you gain from your data, the faster you can correct inefficiencies.
5. The Power of Risk Management
Many traders focus on predicting direction, but performance excellence is built on risk control. The best traders aren’t those who win all the time—they’re those who lose well.
Boosting performance means ensuring that no single trade, sector, or emotion can destroy your capital. By setting proper stop-loss levels, maintaining position sizing discipline, and using portfolio diversification, traders can sustain long-term growth.
A simple rule: focus on preserving capital before multiplying it.
When risk is managed well, confidence rises, emotions stabilize, and execution quality improves—all key factors in performance enhancement.
6. The Discipline of Continuous Learning
Markets are dynamic ecosystems. Sectors rotate, interest rates shift, policies evolve, and global events reshape sentiment overnight. A trader who stops learning becomes outdated.
Boosting trading performance requires an attitude of lifelong learning.
This includes:
Studying market structure and new patterns.
Understanding macroeconomic influences.
Learning from top-performing traders and case studies.
Reviewing historical trades to find recurring inefficiencies.
Every losing trade holds valuable information—if analyzed correctly. Treating mistakes as data, not failure, transforms setbacks into opportunities for growth.
7. Strategy Refinement and Adaptation
No trading system works forever. The market continuously shifts between phases—trending, consolidating, volatile, and range-bound. A strategy optimized for one condition may fail in another.
Boosting performance involves periodic backtesting and optimization.
Traders must identify when a system loses edge and adjust accordingly:
For trending markets, breakout or momentum systems perform better.
In sideways markets, mean-reversion strategies excel.
During high volatility, risk management and patience become crucial.
A performance-driven trader doesn’t rigidly follow old methods—they evolve with evidence and adaptability.
8. Time Management and Lifestyle Balance
Performance isn’t only about what happens during market hours—it’s also influenced by the trader’s lifestyle, energy, and focus. Sleep deprivation, poor diet, and stress all affect decision-making quality.
To boost trading performance, traders must treat themselves like high-performance athletes. A clear mind, rested body, and organized schedule help maintain discipline under pressure.
Creating structured trading routines—pre-market preparation, execution window, and post-market review—turns chaos into controlled productivity.
9. Technology and Automation: The Modern Edge
The modern trader has access to tools that were once reserved for hedge funds—AI scanners, algorithmic models, backtesting platforms, and advanced charting systems.
Boosting performance often involves integrating technology intelligently:
Using screeners to identify high-probability setups.
Automating repetitive tasks to save time.
Employing alerts or partial automation for disciplined execution.
Leveraging data analytics to measure trade performance.
However, technology is a double-edged sword. Overreliance without understanding can lead to complacency. The goal is to let tools enhance human decision-making, not replace it.
10. Emotional Intelligence and Decision Agility
Markets change fast. A high-performing trader must be emotionally agile—able to pivot when new information emerges. Being flexible doesn’t mean abandoning plans; it means adapting them intelligently.
Emotional intelligence (EQ) helps traders interpret uncertainty with calmness. When the market triggers fear or excitement, EQ ensures decisions remain rational. Traders with high EQ tend to recover faster from drawdowns and maintain composure during volatile sessions.
11. Setting Realistic Goals and Expectations
Boosting trading performance also means setting realistic, measurable goals. Many traders fail not because of bad strategies, but because of unrealistic expectations—wanting to double capital every month or chasing 90% win rates.
Performance growth comes from compounding small improvements:
Reducing average loss per trade.
Improving win/loss ratio slightly.
Cutting emotional trades by 20%.
These incremental gains accumulate into exponential progress over time.
12. The Importance of Community and Mentorship
Trading is often a solitary activity, but isolation can slow performance growth. Engaging with a community or mentor accelerates learning.
By sharing insights, reviewing setups, and receiving constructive feedback, traders gain external perspectives that highlight blind spots.
Mentorship helps instill discipline, professional habits, and emotional resilience—qualities that are hard to develop alone. A performance-oriented trading community acts as both a learning platform and accountability partner.
13. The Mindset of a High-Performance Trader
At its core, boosting trading performance is a mindset shift—from random execution to systematic excellence. High-performing traders treat trading like a business:
They have clear operating procedures.
They track performance metrics.
They manage emotions like professionals.
They focus on process, not short-term results.
This professional attitude transforms trading from a gamble into a structured pursuit of consistency.
14. Measuring Long-Term Success
Short-term performance can be deceptive. One good month doesn’t mean mastery, and one bad month doesn’t mean failure. The goal is long-term sustainability.
Performance boosting should therefore focus on:
Equity curve stability (smooth, controlled growth).
Risk-adjusted returns (profit relative to drawdowns).
Strategic evolution (adaptation to changing conditions).
The true mark of performance improvement is the ability to survive, adapt, and grow across multiple market cycles.
15. Conclusion: The Continuous Journey of Excellence
Boosting trading performance isn’t a one-time goal—it’s a continuous process of refinement, discipline, and self-awareness. Every trader, whether novice or professional, must view the market as a mirror reflecting their skills, psychology, and preparation.
Performance growth begins the moment a trader decides to take ownership of their results—analyzing mistakes, refining methods, and committing to constant evolution.
In a world where market edges are fleeting and technology levels the playing field, the ultimate differentiator is performance discipline. The trader who treats performance like a craft—tracking, reviewing, optimizing, and learning—inevitably rises above the crowd.
Boosting trading performance, therefore, isn’t about perfection. It’s about progress. It’s about mastering yourself as much as the markets. Because in the end, the greatest trade you’ll ever make is between your current self—and your highest potential.

Infrastructure & Capital Goods Momentum: Building India’s Growth1. Sector Overview: Foundation of Economic Growth
The Infrastructure and Capital Goods sectors are closely linked yet distinct in nature.
Infrastructure represents the creation of physical assets like roads, highways, airports, ports, metros, power grids, pipelines, and urban development projects.
Capital Goods refers to manufacturing equipment and machinery used in producing goods and services — such as engineering equipment, construction machinery, electrical systems, heavy vehicles, and automation tools.
Together, these sectors form the backbone of industrial expansion. When infrastructure improves, industrial productivity rises. And when capital goods companies thrive, it indicates that industries are investing in new capacities — a key sign of economic confidence.
2. Revival of the Capex Cycle
After nearly a decade of subdued corporate investment post-2012, India’s private capital expenditure is witnessing a broad-based revival.
Several trends are converging to create this momentum:
Government-Led Push:
The Indian government’s capital expenditure has increased by over 3.5x since FY17, with infrastructure allocations crossing ₹11 lakh crore in Budget FY25. Flagship programs like Gati Shakti, National Infrastructure Pipeline (NIP), and PM Gati Shakti Master Plan are ensuring integrated infrastructure development.
Private Sector Reinvestment:
After years of deleveraging, Indian corporates have cleaned up their balance sheets. Now, with improved demand visibility and strong profitability, private players are again investing in capacity expansion — especially in sectors like cement, steel, energy, and manufacturing.
PLI and Make-in-India Push:
The Production Linked Incentive (PLI) schemes across multiple sectors — including electronics, auto components, renewables, and defence — are catalyzing fresh capital investments. This, in turn, is boosting demand for industrial equipment and capital goods.
Urbanization and Infrastructure Expansion:
India’s urbanization rate, currently around 36%, is expected to cross 40% by 2030. This urban transition is driving demand for smart cities, transport corridors, real estate, and public utilities.
In essence, India’s capex cycle has entered a structurally positive phase — and that’s what’s fueling the ongoing rally in infrastructure and capital goods stocks.
3. Infrastructure Sector Momentum
3.1 Roads & Highways
The roads and highways segment remains the biggest beneficiary of the government’s infrastructure focus. The Ministry of Road Transport & Highways continues to allocate record budgets under the Bharatmala Pariyojana scheme.
Construction pace has averaged 35 km per day, with an aim to cross 45 km/day by 2026.
Companies like IRB Infra, KNR Constructions, HG Infra, and PNC Infratech have witnessed healthy order inflows and margin expansion.
Toll monetization and hybrid annuity models (HAM) have reduced financial risks and ensured sustainable cash flows.
3.2 Railways & Metro Projects
Indian Railways’ capital outlay crossed ₹2.5 lakh crore in FY25, focused on modernization, track electrification, and station redevelopment.
Metro rail expansion in Tier-2 cities (like Surat, Patna, Nagpur, and Indore) is opening new project opportunities.
Stocks like IRCON, RVNL, RITES, and Titagarh Rail Systems have gained sharply due to strong order pipelines and profitability visibility.
3.3 Power & Energy Infrastructure
The power infrastructure story is evolving beyond traditional generation to transmission and renewable integration.
Companies like Power Grid, KEC International, Techno Electric, and Kalpataru Projects are winning large transmission and substation orders.
The upcoming Green Energy Corridors project and National Smart Grid Mission are creating long-term opportunities in grid modernization and electrification.
3.4 Urban Infra & Water Management
Urban infrastructure — including housing, water supply, sanitation, and waste management — is gaining momentum under AMRUT 2.0, Jal Jeevan Mission, and Smart City Mission.
Players like VA Tech Wabag, L&T Construction, and NCC Ltd. are executing large urban infra contracts.
Demand for efficient project management and technology integration is driving digitalization in infra execution.
4. Capital Goods Sector Momentum
The capital goods sector’s resurgence is a clear signal that industrial demand is returning. This segment has seen a sharp order inflow in FY24-FY25, driven by public and private capex revival.
4.1 Industrial Equipment & Engineering
Companies such as Larsen & Toubro (L&T), ABB India, Siemens, and Thermax are reporting record order books.
L&T’s order inflow has crossed ₹3.3 lakh crore, with visibility across oil & gas, defence, power, and infrastructure.
Engineering exports have also picked up due to global supply chain diversification, giving Indian firms an edge.
4.2 Electrical & Automation
The automation and electrification segments are witnessing significant growth due to India’s industrial digitization wave.
ABB, Siemens, and Schneider Electric are benefiting from demand for smart factories, process automation, and EV charging infrastructure.
Domestic players like CG Power and Industrial Solutions, KEC, and Polycab are seeing strong growth in transformers, cables, and industrial systems.
4.3 Defence & Aerospace Manufacturing
The government’s push for Atmanirbhar Bharat in defence production is reshaping the landscape.
With import substitution policies and 74% FDI allowance in defence manufacturing, companies like HAL, BEL, Bharat Dynamics, and Mazagon Dock are expanding capacity.
Defence PSUs have robust order books and steady revenue visibility for the next 4–5 years.
4.4 Machinery & Construction Equipment
The construction equipment segment is riding the infrastructure boom.
ACE, JCB India, and Tata Hitachi are seeing high utilization and sales volumes.
The mechanization of rural infrastructure and smart city projects is further expanding their market.
5. Financial Performance & Market Trends
5.1 Order Book Strength
Order books across infrastructure and capital goods companies have hit multi-year highs.
For instance:
L&T’s consolidated order book: ₹4.8 lakh crore
ABB India’s order inflow growth: 25% YoY
IRCON, RVNL, and RITES: Combined orders exceeding ₹1 lakh crore
These numbers highlight strong execution visibility for the next 2–3 years.
5.2 Margin Expansion
With raw material prices stabilizing and better execution efficiency, companies are reporting operating margin improvement.
Project delays are reducing due to better financing models and project management tools.
5.3 Stock Market Momentum
Both sectors have been market leaders in the 2024–2025 rally:
The BSE Capital Goods Index surged over 60% YoY, outperforming the Sensex.
The Infrastructure Index gained nearly 45% YoY, led by PSUs and construction majors.
Retail and institutional investors have increased exposure, especially in public-sector and midcap engineering stocks.
6. PSU Leadership: The New Growth Drivers
Public Sector Undertakings (PSUs) have emerged as major beneficiaries of this momentum.
Companies like BEL, BHEL, RVNL, NBCC, and IRCON have delivered multi-bagger returns in the past two years.
These PSUs are executing large government projects with improved financial discipline and better dividend payouts.
Investor perception has shifted — PSUs are no longer “value traps,” but strategic growth vehicles aligned with national infrastructure goals.
7. Key Growth Drivers Ahead
Budgetary Allocation Continuity:
The government’s FY26 budget is likely to sustain high capital expenditure, ensuring visibility for the next several years.
Private Capex Acceleration:
Sectors like cement, metals, renewables, and chemicals are entering new capacity expansion phases, boosting machinery and engineering demand.
Green & Renewable Transition:
India’s target of 500 GW renewable capacity by 2030 will generate opportunities across energy transmission, grid modernization, and clean tech equipment.
Global Supply Chain Realignment:
Multinational companies are diversifying away from China, positioning India as a manufacturing hub — benefiting domestic capital goods makers.
Digital & Automation Integration:
The adoption of industrial automation, robotics, and IoT is creating long-term opportunities for high-tech engineering firms.
8. Challenges and Risks
While the outlook remains robust, certain risks need monitoring:
Execution Delays: Large infra projects still face bureaucratic and land acquisition challenges.
Commodity Price Volatility: Sudden spikes in steel, cement, or copper prices can affect margins.
Interest Rate Sensitivity: Infrastructure companies are capital-intensive, and high borrowing costs can impact profitability.
Global Demand Slowdown: Exports of capital goods may face headwinds if global growth slows in 2025–2026.
9. Investment Outlook: Sustained Multi-Year Opportunity
The Infrastructure & Capital Goods theme represents one of the strongest multi-year investment opportunities in India’s growth story.
Key investment themes include:
PSU Infrastructure Leaders: IRCON, RVNL, BEL, NBCC
Private Engineering Majors: L&T, Siemens, ABB, Thermax
Construction & EPC Specialists: KNR Constructions, HG Infra, NCC, Kalpataru
Electrical Equipment & Automation: CG Power, Polycab, KEI Industries, KEC International
Investors should focus on companies with:
High order book-to-revenue ratios
Healthy balance sheets
Strong execution track records
Exposure to sunrise sectors like renewables, defence, and automation
10. Conclusion
India’s Infrastructure and Capital Goods momentum marks the beginning of a new growth era.
After years of policy groundwork, the country is witnessing the materialization of its infrastructure dreams — from world-class highways to modern railways, from green energy corridors to smart cities.
The capital goods industry, in turn, is powering this transformation with engineering excellence, technological adoption, and renewed corporate confidence.
With government capex and private investments working in tandem, these sectors are not just cyclical plays anymore — they represent structural growth themes for the next decade.
As India builds the foundation for its $5 trillion economy target, Infrastructure and Capital Goods will remain its most powerful pillars — delivering both economic strength and market leadership.

IT Sector Reversal Plays1. Background: The Downtrend in the IT Sector
From 2022 to mid-2024, the Indian IT sector witnessed a significant correction. After peaking during the pandemic-era digital boom, IT stocks went through a period of multiple headwinds:
Margin pressures due to rising employee costs and elevated attrition.
Slowdown in global tech spending, especially in the U.S. and Europe, as clients became cautious about discretionary IT projects.
Macroeconomic uncertainty—rising interest rates, inflation, and recession fears affected deal pipelines.
Valuation compression after excessive run-ups during 2020–2021.
Major companies like Infosys, TCS, Wipro, HCLTech, and Tech Mahindra faced 25–40% price corrections from their highs. Even mid-cap IT names such as LTIMindtree, Coforge, Mphasis, and Persistent Systems lost significant value as growth visibility weakened.
But as markets evolve, every extended correction eventually sets the stage for a reversal — and that’s where the IT sector stands now.
2. The Current Setup: Signs of Reversal Emerging
Since mid-2024, a gradual shift in market tone has become visible. Several indicators now suggest the IT sector could be transitioning from a bearish phase to a structural recovery phase. Let’s break down the key reversal signals:
a) Technical Bottom Formation
The Nifty IT Index, after correcting nearly 35% from its 2021 peak, has formed a strong multi-quarter base around the 28,000–30,000 range.
Higher lows are visible on weekly charts, indicating that selling pressure is subsiding.
Volume spikes during up-moves suggest accumulation by institutional investors.
The 200-day moving average (DMA), which acted as resistance for nearly two years, has now been decisively reclaimed by most IT heavyweights.
Relative Strength Index (RSI) readings have shifted from bearish to neutral-bullish territory (above 50), reinforcing momentum buildup.
b) Valuation Comfort Zone
Post-correction, the sector’s valuation multiples have normalized:
The Nifty IT Index trades at 20–22x forward earnings, compared to 32–35x at the 2021 peak.
This makes the risk–reward ratio attractive, especially with improving earnings visibility in FY26.
c) Macro Tailwinds Re-emerging
Global inflation has cooled off, prompting central banks like the U.S. Federal Reserve to hint at rate cuts. Lower interest rates support IT spending, especially on digital transformation and cloud modernization.
Dollar stability and moderate INR depreciation enhance revenue visibility for export-heavy Indian IT companies.
The AI and automation cycle is creating fresh demand pockets across industries, opening new revenue streams.
Together, these factors suggest that the worst may be behind the IT sector, setting the stage for meaningful reversals.
3. Fundamental Triggers Behind the Reversal
Beyond charts and valuations, several fundamental developments are adding strength to the reversal narrative.
a) Rebound in Deal Wins
In recent quarters, large-cap IT companies have reported healthy deal signings:
TCS and Infosys are witnessing multi-year transformation contracts from BFSI, retail, and manufacturing clients.
HCLTech and LTIMindtree are leading in cloud modernization and digital engineering deals.
Tech Mahindra has stabilized its communications business and is pivoting to AI-driven customer experience solutions.
Total contract value (TCV) figures have improved sequentially, reflecting a revival in client confidence.
b) Margin Recovery
After years of pressure from rising wage costs and attrition, IT firms are now benefiting from:
Lower employee churn (attrition down to 13–14% vs. 22–24% in FY23).
Reduced subcontracting expenses as project utilization improves.
AI-driven productivity tools reducing manpower dependency.
Together, these trends are expected to lift operating margins by 100–150 bps over FY26.
c) Cost Optimization and Automation Push
Indian IT companies are actively adopting Generative AI, automation platforms, and cloud-based delivery models to improve productivity and reduce delivery costs.
Examples include:
Infosys’ Topaz platform,
TCS’ AI.WorkBench, and
HCLTech’s AI Force initiative.
These not only enhance efficiency but also attract higher-value projects, boosting profitability and client stickiness.
d) Demand Diversification
While BFSI and telecom remain key verticals, growth is emerging from manufacturing, energy, healthcare, and retail—driven by Industry 4.0, sustainability analytics, and customer experience technologies.
4. Leadership Rotation Within the Sector
Not all IT stocks will perform equally during a reversal. Leadership rotation is already visible across categories:
a) Large-Cap Leaders
TCS: Stable growth, superior margins, strong AI pipeline. Technically leading with a breakout above long-term resistance near ₹4,200.
HCLTech: Operational excellence, resilient client mix, and cloud deals supporting momentum.
Infosys: Recovering from weak quarters; strong positioning in digital transformation and automation.
These stocks form the anchor base of the reversal.
b) Mid-Cap Outperformers
Mid-cap IT names often outperform in the second phase of reversals due to higher growth potential.
Coforge: Strong U.S. exposure, digital engineering capabilities.
LTIMindtree: Aggressive client acquisition and synergistic benefits post-merger.
Persistent Systems: Consistent revenue growth from AI, data analytics, and product engineering.
Mphasis: Benefiting from stability in BFSI and new-gen cloud deals.
c) Small-Cap Recovery Plays
Select niche players such as Sonata Software, Birlasoft, and Zensar Technologies are showing early breakout structures, driven by turnaround earnings and margin expansion.
5. Institutional Flows and Market Sentiment
Foreign Institutional Investors (FIIs), who were heavy sellers in IT during 2022–2023, have returned to the sector in 2025 as valuations turned attractive and U.S. recession fears faded.
Data shows:
FIIs have increased exposure to IT by nearly 12% over the last two quarters.
Domestic Mutual Funds are also raising IT weights in portfolios, reversing the underweight stance.
This institutional participation is a critical confirmation of a sectoral reversal, indicating confidence in medium-term earnings visibility.
6. The Role of AI and Digital Transformation
A structural driver of the IT sector’s next growth cycle will be Artificial Intelligence (AI) and GenAI-led transformation. Global enterprises are investing heavily in:
AI-driven automation of business workflows,
Cloud data modernization,
Predictive analytics, and
Cybersecurity.
Indian IT companies, with their massive engineering talent and delivery scale, are strategically positioned to capture a significant portion of this demand.
This emerging AI monetization cycle could power the next 3–5 years of sustainable growth, making the ongoing reversal more structural than cyclical.
7. Potential Risks to the Reversal
While optimism is building, investors must remain aware of risks that could slow or invalidate the reversal:
Global demand slowdown due to renewed economic shocks.
Currency volatility, especially sharp INR appreciation against USD.
Delay in AI monetization or overhyped expectations.
Geopolitical disruptions in the U.S. or Europe impacting client budgets.
However, these risks appear manageable in the current macro context, with most IT companies maintaining strong balance sheets and consistent cash flows.
8. Strategic Outlook: How Traders and Investors Can Play the Reversal
a) Short-Term Traders
Focus on momentum plays — buying on dips near support zones and exiting near resistance.
Use RSI and volume confirmation for entry points.
b) Positional Investors
Build exposure in phased accumulation, especially in large-cap names like TCS, Infosys, and HCLTech, as they offer stability and dividend yield.
c) Aggressive Investors
Look toward mid-cap IT with improving earnings visibility — Coforge, Persistent, and LTIMindtree — for higher alpha generation during the reversal.
d) Long-Term Portfolio Builders
Adopt a three-year horizon, aligning with the global digital and AI transformation wave. The IT sector’s structural uptrend could mirror the 2013–2017 rally phase.
Conclusion: From Fear to Opportunity
The Indian IT sector stands at a pivotal juncture in late 2025. After nearly three years of correction and consolidation, the stage appears set for a broad-based reversal, driven by:
Stabilizing global macro conditions,
Margin recovery and deal wins,
AI-led transformation opportunities, and
Renewed institutional participation.
From a market structure perspective, IT is shifting from accumulation to breakout, making it one of the most promising contrarian plays heading into FY26.
In essence, “IT Sector Reversal Plays” are not just short-term technical bounces but potentially the beginning of a multi-year structural recovery, where leadership will rotate from defensive large caps to agile mid-cap innovators.
For investors with patience, discipline, and an eye on evolving technology trends, this reversal could mark the next wealth creation phase in India’s capital markets.
