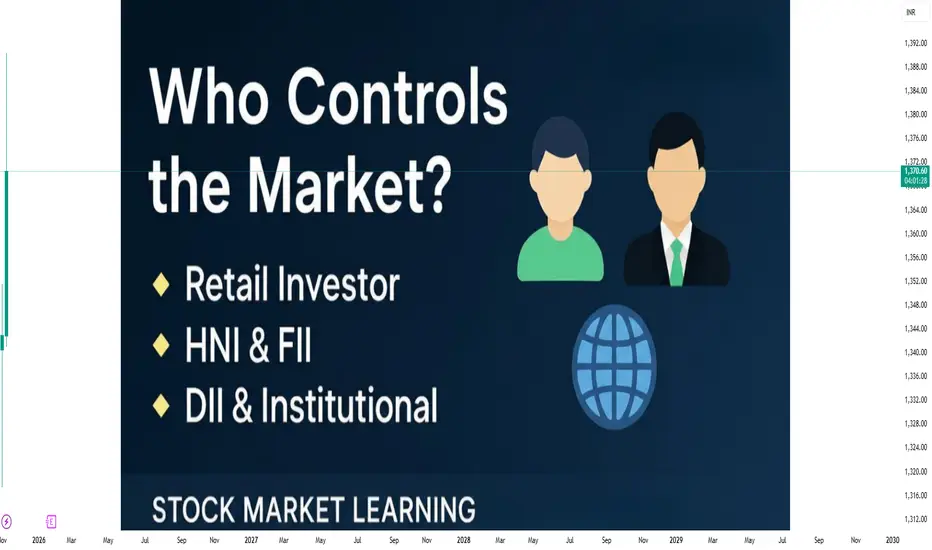
Who Controls the Trade Market?1. Governments and National Policies
Governments are among the most significant influencers of global trade. They do not directly “control” the entire trade market but shape it through:
a. Trade Policies
Countries impose:
Tariffs
Import/export taxes
Quotas
Subsidies
Sanctions
These tools can encourage or restrict trade. For example, a country may impose tariffs on imported steel to protect its local steel industry, affecting global steel prices and trade flows.
b. Trade Agreements
Nations sign bilateral and multilateral agreements such as:
WTO Agreements
Regional trade blocs (EU, ASEAN, NAFTA/USMCA, MERCOSUR)
Free trade agreements (India–UAE CEPA, EU–Japan EPA)
Such agreements define tariff structures, market access, rules of origin, and dispute mechanisms. They create predictable trade environments that shape global flows.
c. Currency and Monetary Policy
Governments influence their currency through central banks, affecting:
Export competitiveness
Import costs
Balance of payments
For example, a weaker currency makes a country’s exports cheaper globally, increasing trade activity.
2. Central Banks and Interest Rate Policies
Central banks indirectly influence the trade market by controlling:
Interest rates
Foreign exchange reserves
Money supply
Inflation
These factors alter import/export demand, capital flows, and trade financing costs. The U.S. Federal Reserve, ECB, Bank of Japan, and People's Bank of China have an outsized influence because their currencies drive global trade settlements.
3. The World Trade Organization (WTO)
The WTO does not “control” trade but regulates and oversees the global trading system. It:
Sets rules for fair trade
Resolves trade disputes
Ensures nondiscriminatory trade practices
Manages global tariff schedules
When trade conflicts arise—such as U.S.–China tariff disputes—WTO rulings influence the direction of global commerce.
4. Global Corporations and Multinational Companies
Large corporations have enormous power over global trade because they operate massive supply chains that span continents. This includes:
Tech giants like Apple, Samsung, and TSMC
Automotive leaders like Toyota, Volkswagen, and Tesla
Energy majors like ExxonMobil, Saudi Aramco, BP
Retail giants like Amazon, Walmart
These companies determine:
Where factories are located
What resources are needed
How goods move across borders
Because of their sheer scale, multinational companies influence labor markets, commodity demand, transportation networks, and global logistics.
5. Commodity Exchanges and Financial Markets
International exchanges play a key role in price discovery. Examples include:
Chicago Mercantile Exchange (CME) – agriculture, energy, metals
London Metal Exchange (LME) – base metals
New York Stock Exchange (NYSE) – equities
ICE – energy, sugar, cotton
These exchanges:
Set global benchmark prices
Facilitate futures and options trading
Provide hedging tools for buyers and sellers
Thus, financial traders and institutions heavily influence short-term market movements, especially in oil, gold, crops, and currencies.
6. Banks and Financial Institutions
Trade requires financing. Large banks such as:
JPMorgan
HSBC
Citi
Deutsche Bank
Standard Chartered
provide:
Letters of credit
Trade loans
Forex settlement
Risk management tools
Without these institutions, global trade would slow dramatically, especially for developing economies.
7. Geopolitical Powers and Global Politics
Political decisions deeply affect trade. The world’s major power centers—the U.S., China, EU, India, Japan, Russia—shape trade through:
Economic alliances
Trade warfare (tariffs, sanctions)
Military presence near trade routes
Resource control
Investment in foreign infrastructure
Geopolitical tensions such as the Russia–Ukraine war, South China Sea disputes, or Middle Eastern conflicts often disrupt supply chains, shipping lanes, and commodity prices.
8. Cartels and Organized Commodity Groups
Some commodities are influenced by producer groups or cartels. The most powerful example is:
OPEC
The Organization of the Petroleum Exporting Countries coordinates oil production to influence global oil prices.
Although they do not fully control the oil market, their decisions strongly impact:
Crude supply
Energy prices
Inflation globally
Other organized groups exist in diamonds, copper, and certain agricultural sectors, but none are as influential as OPEC.
9. Supply Chain and Logistics Networks
Trade physically moves through:
Shipping companies
Port authorities
Airlines
Freight forwarders
Rail networks
Global shipping giants like Maersk, MSC, and COSCO operate vast fleets and control a significant portion of global container movement. Congestion at a major port can affect trade worldwide.
10. Digital Platforms, E-Commerce, and Technology
In the 21st century, platforms such as Alibaba, Amazon, and Shopify influence global trade patterns by enabling cross-border commerce at scale.
Additionally, digital tools like:
AI forecasting
Blockchain-based trade finance
Real-time logistics tracking
Mobile payments
have increased trade efficiency and reduced barriers.
11. Consumers and Market Demand
Ultimately, consumer behavior controls the direction of trade. Their preferences shape:
What goods are produced
Where they are sourced
How companies market products
For example:
Rising demand for electric vehicles increases global trade in lithium, cobalt, and battery components.
Demand for fast fashion drives textile imports and exports.
Consumers collectively act as a “silent controller” of trade.
12. Conclusion — A System, Not a Single Controller
The trade market is not controlled by any one entity. Instead, it operates as a dynamic ecosystem shaped by:
Governments
Corporations
Financial markets
Regulators
Central banks
Geopolitical forces
Supply chain networks
Consumers
Trend Line Break
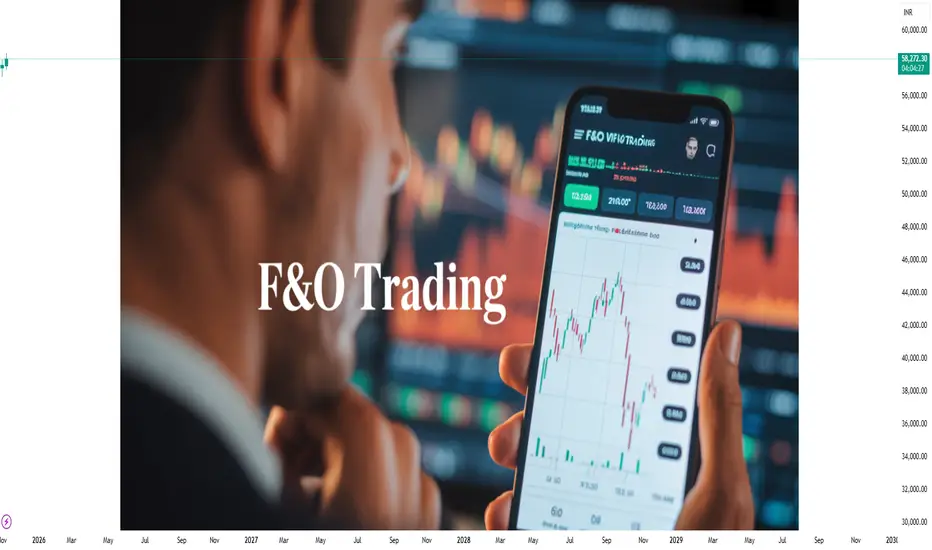
F&O (Futures and Options) Trading1. What Are Derivatives?
Futures and Options are derivative instruments, meaning their value is derived from an underlying asset. This underlying can be:
Stocks
Indices (NIFTY, BANKNIFTY)
Commodities
Currencies
The underlying’s price movement directly influences the F&O contract.
2. What Are Futures Contracts?
A Futures contract is an agreement to buy or sell an asset at a predetermined price on a specific future date. Both parties are obligated to fulfill the contract.
Key Features of Futures
Obligation: Buyer must buy, seller must sell.
Standardized: Lot size, expiry date, and price movement rules are fixed by the exchange.
Margin Required: Traders don’t pay full contract value; they pay a margin (~10–20%), which offers leverage.
Daily MTM: Profits or losses are settled daily through Mark-to-Market.
Example
If you buy NIFTY Futures at 22,000 and NIFTY rises to 22,200, you gain 200 points × lot size.
If NIFTY falls, you face losses.
Where Futures Are Used
Speculation: To profit from price movements
Hedging: To protect portfolios from adverse market moves
Arbitrage: To profit from price differences between spot and futures markets
Futures are powerful but risky due to high leverage.
3. What Are Options?
An Option is a contract that gives the buyer the right, but not the obligation*, to buy or sell an underlying asset at a specific price before (or on) expiry.
Two Types of Options
Call Option (CE) – Right to buy
Put Option (PE) – Right to sell
Two Sides of Options
Buyer (Holder): Pays premium, risk limited
Seller (Writer): Receives premium, risk can be unlimited
Strike Price
The price at which you may buy or sell the underlying.
Premium
The price paid by option buyers.
4. How Option Buyers Make Money
Call Buyer
Profits when underlying price goes above strike price + premium.
Put Buyer
Profits when underlying price goes below strike price – premium.
Buyers have limited loss (premium) and unlimited profit potential.
5. How Option Sellers Make Money
Sellers receive the premium upfront.
They profit when:
Price does not move beyond breakeven
Option expires worthless
Time decay eats option value
But sellers face unlimited loss risk, especially in naked selling.
That’s why option selling must be done with proper hedging and risk management.
6. Expiry and Settlement
F&O contracts expire on:
Weekly expiry: Every Thursday (Index options)
Monthly expiry: Last Thursday of every month
After expiry, contracts settle based on closing prices of the underlying.
7. Margin and Leverage
Futures require margin to control large positions.
Example:
NIFTY lot size: 50
NIFTY at 22,000 → Contract Value = 11,00,000
Margin required ≈ ₹1,40,000
This leverage amplifies gains and losses.
Options buyers pay only the premium, no margin.
Options sellers must pay heavy margins because of high risk.
8. Why Traders Use F&O?
A. Hedging
Investors use F&O to protect their portfolios.
Example:
If you own Reliance shares, you can buy a Put Option to hedge downside risk.
B. Speculation
Traders try to profit from price movements using leverage.
Example:
Buy BANKNIFTY 500-point movement with small capital by using options.
C. Arbitrage
Exploiting price differences between:
Spot and Futures
Option prices (mispricing)
Arbitrage is low-risk and often executed by institutions.
9. Option Pricing Factors
Option premiums are affected by:
1. Intrinsic Value
Value if exercised today.
2. Time Value
More time → higher premium.
3. Volatility
Higher volatility → higher premium.
4. Interest Rates
Small effect, but important for indices.
5. Demand/Supply
Market sentiment impacts prices.
The most important factors in India’s F&O market are volatility and time decay.
10. Greeks: The Heart of Options Trading
1. Delta
Measures price sensitivity.
Call Delta: 0 to 1
Put Delta: 0 to –1
2. Gamma
Rate of change of Delta.
3. Theta
Time decay.
Option buyers hate Theta; sellers love it.
4. Vega
Effect of volatility on premium.
5. Rho
Effect of interest rates (least used).
Understanding Greeks is essential for advanced F&O trading.
11. Popular F&O Strategies
Directional Strategies
Long Call
Long Put
Short Futures
Long Futures
Non-Directional Strategies
Straddle
Strangle
Iron Condor
Butterfly
Hedging Strategies
Protective Put
Covered Call
Collar Strategy
Traders use these based on market conditions and risk appetite.
12. Risks in F&O Trading
1. Leverage Risk
Small price movements can cause huge losses.
2. Unlimited Loss in Option Selling
Selling naked options is extremely risky.
3. Margin Shortfall
If losses exceed margin, broker issues margin calls.
4. Time Decay
Options buyers lose value every day.
5. Volatility Crush
After major events (budget, result days), volatility drops, premiums fall rapidly.
13. Benefits of F&O Trading
1. High Liquidity
Especially in NIFTY and BANKNIFTY.
2. Hedging Power
Protects portfolio from adverse moves.
3. Leverage
Makes it possible to trade large positions with moderate capital.
4. Strategy Flexibility
Works in bull, bear, and sideways markets.
5. Potential for High Returns
When used correctly.
14. F&O in Indian Markets
India is one of the world’s largest F&O markets due to:
High retail participation
Weekly indexes options
Attractive margins
High volatility in indices
Index Options (NIFTY & BANKNIFTY) dominate over stock options.
15. How to Trade F&O Safely
Use stop-loss always
Avoid naked option selling
Stay aware of global markets
Track volatility (India VIX)
Use hedged strategies
Do not overleverage
Maintain discipline
Book profits regularly
Conclusion
F&O trading is a powerful tool for traders and investors, offering leverage, hedging benefits, and the ability to profit from different market conditions. However, F&O trading carries significant risk, especially due to leverage, time decay, and volatility. With proper risk management, strategy, and knowledge of options Greeks, traders can use F&O to enhance returns and protect their portfolios. For beginners, understanding the basics and practicing with small positions is crucial before jumping into advanced strategies or large trades.
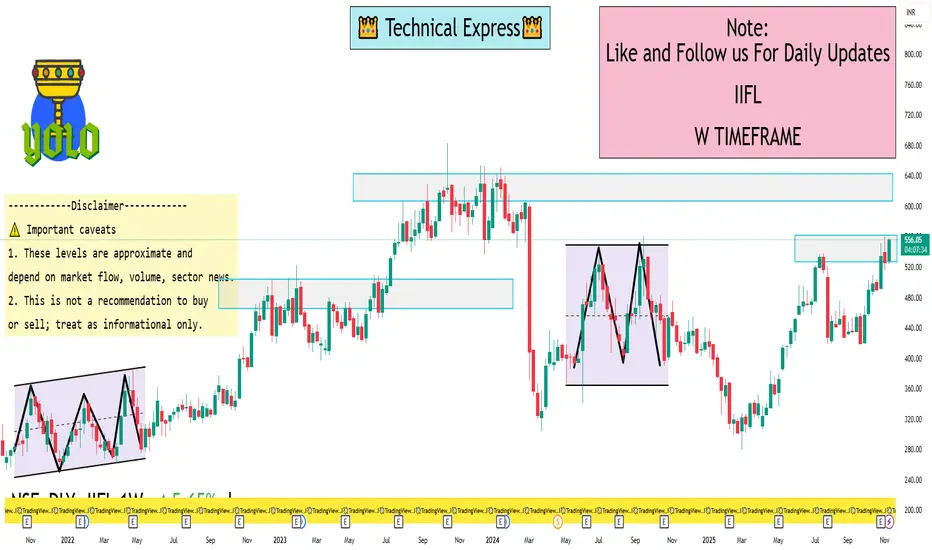
IIFL 1 Week View📊 Current snapshot
Last quoted price: approx ₹540.75 (as of 11 Nov 2025).
1-week return: ~ +0.09%.
52-week high / low: ~ ₹559.75 / ~ ₹279.80.
🔍 1-Week level view
Given the current price and recent behaviour, here are some approximate support/resistance zones for the coming week:
Support zone: around ₹ 520-530. (if price dips, this may be an area where buyers step in)
Resistance zone: around ₹ 555-560. (near the recent high end of the range)
Neutral range: ~₹ 530-550 — staying in this band if no strong momentum emerges.
Upside breakout scenario: if it convincingly breaks above ~₹ 560, the next target may be ~₹ 570-580.
Downside break scenario: if it falls below ~₹ 520, it could test ~₹ 500 or lower in the short term.
⚠️ Important caveats
These levels are approximate and depend on market flow, volume, sector news.
This is not a recommendation to buy or sell; treat as informational only.
NBFC stocks like IIFL can be sensitive to credit/regulation news, which can quickly shift the technicals.
The “1-week” view means the horizon is short; volatility could cause levels to be breached.
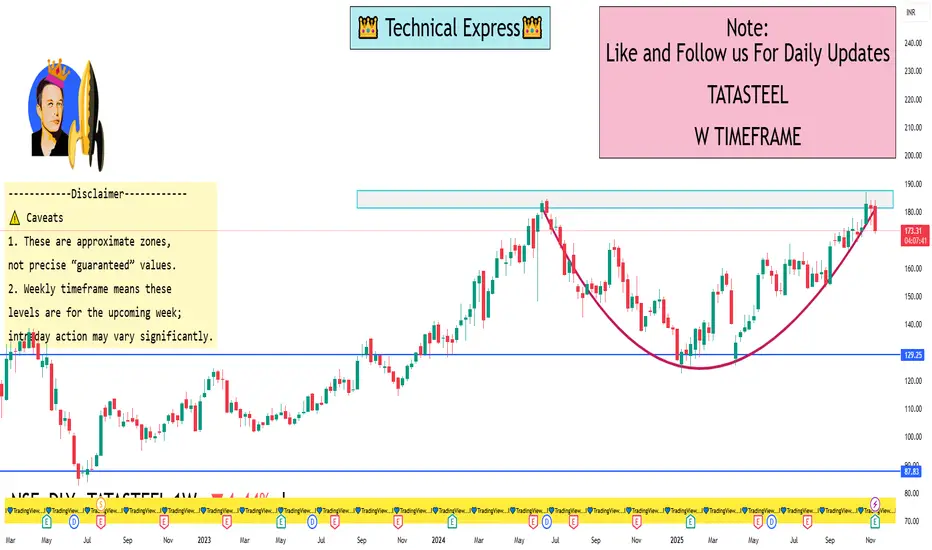
TATASTEEL 1 Week View🔍 Current context
The stock is trading around ₹ 176–177 (as of mid-Nov 2025).
On a weekly basis, technical indicators suggest a mixed to weak bias: for example, on daily timeframes many moving averages and indicators show “Sell” signals.
On the weekly timeframe (Moneycontrol data) the moving averages, MACD, RSI etc are showing outperform (“bullish”) signals.
Key support/resistance pivot levels:
Resistance (Classic) ~ ₹ 185.31, ₹ 189.25, ₹ 194.40
Support (Classic) ~ ₹ 176.22, ₹ 171.07, ₹ 167.13
52‐week high ~ ₹ 186.94, 52‐week low ~ ₹ 122.62
🎯 1-Week Trading Levels & Potential Strategy
Given the above, here are plausible levels and scenarios for the next week:
Upside target: If the stock picks up momentum, a breakout above ~ ₹ 180-185 opens the way toward ~ ₹ 189-190 (resistance).
Downside risk: If weakness persists, a drop below ~ ₹ 176 could test support around ~ ₹ 171–172, and potentially down to ~ ₹ 167.
Key trigger level: The ~ ₹ 176 region is a hinge. Holding above gives chance for upside; failing it shifts the bias downward.
⚠️ Caveats
A 1-week timeframe is quite short; factors such as global steel demand, raw material costs, and domestic policy can impact quickly.
Technicals are only one piece of the puzzle — fundamentals, news, sector dynamics matter.
The conflicting signals (daily weak vs weekly stronger) mean the stock may trade sideways or range-bound in the short run.
Event-Driven and Earnings Trading1. What Is Event-Driven Trading?
Event-driven trading is a strategy built around identifiable catalysts that cause sudden price movements. Traders analyze upcoming events, estimate the market reaction, and position themselves before or after the event.
Typical Events That Move Markets
Earnings announcements
Macroeconomic data releases – GDP, CPI, PMI, payrolls
Central bank decisions – rate hikes, policy statements
Corporate announcements – mergers, acquisitions, buybacks
Regulatory changes
Product launches & strategic updates
Geopolitical events – elections, wars, sanctions
Commodity inventory reports – crude oil, natural gas, metals
Event traders must understand how these triggers affect sentiment, volatility, and liquidity.
2. Why Event-Driven Trading Works
Events catch the market unprepared. Most traders react emotionally. Institutions reposition portfolios. Algorithms trigger stop-loss cascades.
This creates:
Temporary price inefficiencies
Gaps between expectation and reality
Large moves driven by volume spikes
High volatility that offers fast profits
Event trading is attractive because you know when the event will occur, unlike general price prediction where timing is uncertain.
3. Core Approaches in Event-Driven Trading
There are three main ways to trade events:
(A) Pre-Event Trading (Positioning Before the Event)
You take a position based on expectations.
Example:
If a company historically beats earnings, traders may buy before the results.
Advantages
Reduced risk because price elasticity is known
Follows historical patterns
You set clear risk parameters
Disadvantages
If expectations fail, price can gap sharply
Requires strong data analysis
(B) Intraday Event Trading (Trading During the Event)
This involves trading the reaction as the event unfolds.
For example:
Fed meeting volatility
GDP release
Corporate earnings call
Key benefit:
You trade the actual response, not the prediction.
(C) Post-Event Reaction Trading
The safest and most reliable approach.
You let the dust settle, wait for direction clarity, and then trade.
Why it works:
Market overreacts initially. Then a more realistic price trend develops.
4. Understanding Earnings Trading
Earnings trading is the most popular event-driven strategy worldwide. Every quarter, listed companies declare their financial results, providing enormous trading opportunities.
Key Earnings Metrics
EPS (Earnings Per Share)
Revenue growth
Margins
Guidance (future outlook)
Debt & cash flow
Sector performance
But profits in earnings trading come not from what the company reports—but from how the market reacts.
5. Pre-Earnings Trading Strategies
(A) Expectation vs Reality Play
Stocks move based on expectations priced in before earnings.
If expectations are too high, even good earnings cause a drop.
(B) Historical Pattern Analysis
Some stocks behave consistently around earnings:
Apple and Amazon often see extreme volatility
Banks trade strongly on NIM expectations
IT companies react primarily to guidance
(C) Options Trading Before Earnings
Popular strategies:
Straddle (volatility play)
Strangle
Iron condor
Covered call
These strategies profit from volatility crush or price spikes.
6. Trading the Earnings Reaction
(A) Gap Up / Gap Down Breakouts
If a stock gaps up with strong volume after positive earnings, it typically continues higher.
Rules for confirmation:
Volume 2–3× average
Breakout above resistance
No immediate sell-off
Gap-downs behave similarly in the opposite direction.
(B) Trend Continuation Setup
After earnings, if a stock establishes a clear direction for 30–60 minutes, the trend usually continues for the day or week.
(C) Fade the Overreaction
Markets sometimes overreact.
Example:
Stock drops 10% on earnings but fundamentals remain solid.
Institutions start buying the dip.
Fading the panic move becomes profitable.
7. Key Skills Required for Event-Driven & Earnings Trading
To trade events successfully, you need:
1. Fundamental Understanding
Know:
Why the event matters
What outcome is priced in
How the result compares to forecasts
2. Technical Analysis
Focus on:
Support & resistance
Volume profile
Breakout levels
Trend confirmation
Opening range
3. Volatility Management
Events bring volatility.
You must:
Use tight stop losses
Reduce position size
Avoid emotional entries
4. Risk Management
The most important element.
Successful event-driven traders always:
Risk 1–2% per trade
Avoid overleveraging
Accept gaps and slippages
8. Tools Used by Event-Driven Traders
Professional traders rely on:
Economic calendars (for macro events)
Earnings calendars
Volatility indicators
Options implied volatility (IV)
Volume and order flow analysis
Live news feeds
Pre-market scanners
These tools help identify catalysts early and plan trades.
9. "Trade for Success" Framework for Event & Earnings Trading
To consistently profit, follow this structured approach:
Step 1: Identify the Event
Look for high-impact events with predictable timelines.
Step 2: Study Past Behavior
Analyze the stock’s or asset’s previous reactions to similar events.
Step 3: Analyze Market Expectations
What the market expects determines the reaction more than the event itself.
Step 4: Plan Scenarios
Prepare three possible outcomes:
Positive surprise
In-line results
Negative surprise
And plan trades for each.
Step 5: Use Controlled Position Sizes
Never go all-in on events.
Step 6: Attack Only High-Quality Setups
Trade only when:
Momentum is clear
Volume confirms
Trend sustains
Market sentiment supports
Step 7: Execute With Discipline
Event trading is fast-paced—no hesitation.
Step 8: Exit Strategically
Lock profits early. Avoid greed.
10. Common Mistakes to Avoid
Overtrading during events
Ignoring the guidance in earnings
Trading purely based on news headlines
Entering without confirmation
No stop-loss planning
Letting emotions dictate actions
Avoid these to achieve consistent success.
Conclusion
Event-driven and earnings trading is one of the most powerful ways to profit from the stock market. Events create volatility, volatility creates opportunity, and opportunity creates profit—if traded with discipline.
Success lies not in predicting the event, but in understanding market expectations, managing risk, and trading the reaction with precision. With the right preparation, structured planning, and emotion-free execution, event-driven trading can become a reliable, repeatable, and highly profitable approach.
Indian Derivative Secrets1. The First Secret: India is a Market Dominated by Options, Not Futures
One of the biggest secrets that new traders miss is that India’s derivatives segment is overwhelmingly options-driven. More than 95% of the total derivatives turnover comes from options.
This creates unique behavior:
Market often moves to kill option premiums → popularly called premium eating market.
Expiry days show violent moves, as both buyers and sellers fight for option decay or reward.
Weekly expiries for Nifty, Bank Nifty, and FinNifty create short-term trend cycles.
The real secret:
Options sellers (institutions, prop desks) control the market more than options buyers (retail).
Because sellers have deep pockets and margin power, they dictate pricing through:
Heavy shorting on OTM strikes
Creating artificial range-bound movements
Sudden IV crushes after major events
Pinning the market to certain levels on expiry
2. The Second Secret: Open Interest (OI) is a Map of Smart Money
Retail traders look at price; professional traders look at Open Interest.
Key principles:
1. Rising OI + Rising Price → Long Build-up
Indicates accumulation; institutions betting on upward trend.
2. Falling OI + Rising Price → Short Covering
Often triggers sharp intraday rallies.
3. Rising OI + Falling Price → Short Build-up
A strong bearish signal.
4. Falling OI + Falling Price → Long Unwinding
Leads to slow downward drift.
But the deeper secret is this:
Option OI is used to trap retail traders.
Example:
If 20 lakh OI sits at Nifty 22500 CE, it creates a wall of resistance.
If suddenly the OI reduces, it means sellers are scared → breakout incoming.
If OI spikes massively, sellers are confident → reversal incoming.
Professionals track:
Change in OI in last 5 minutes
OI shifting to higher or lower strikes
OI unwinding during big candles
These help predict short-term market moves before they show on charts.
3. The Third Secret: India’s Market is Driven by Event Volatility
Unlike global markets, Indian derivatives see unique event-driven volatility cycles:
1. RBI Policy Days
Bank Nifty’s biggest moves occur here.
IV spikes → option prices increase.
2. Budget Day
High volatility, large swings, unpredictable behavior.
3. Election Results
Massive IV spikes that crush instantly post-event.
4. US Fed Days
Indian markets react sharply the next morning.
The secret?
Option sellers thrive before the event; option buyers thrive after.
The trick is to identify IV patterns:
Before events → IV increases → selling straddles/strangles becomes risky.
After events → IV crashes → buyers lose premium but directional traders profit.
4. The Fourth Secret: FIIs Don’t Control the Market Daily — The Myth
Many retail traders assume FIIs (Foreign Institutional Investors) drive daily trends. This is not true anymore.
The secret:
Proprietary trading firms (prop desks) influence intraday to medium-term moves more than FIIs.
FIIs provide long-term liquidity, but prop firms dominate:
Day trading
Spread strategies
Gamma scalping
Weekly expiry management
Arbitrage between indices
The “intraday direction” is mostly shaped by:
Prop firms (Indian)
High-frequency trading algorithms (HFT)
Market-making firms
5. The Fifth Secret: Option Pain Theory (Max Pain) Actually Works in India
“Max Pain” is the level where the maximum number of option buyers lose money.
In India’s weekly expiry system, this theory becomes extremely powerful.
Institutions try to move the price toward max pain.
Example:
If Nifty’s max pain is at 22400
And current price is 22580
Expect slow grinding downward movement on expiry.
Why?
Because sellers want to make maximum profit from premium decay.
Max pain is not 100% accurate, but works exceptionally well:
In range-bound markets
On expiry days
When OI build-up is clean
6. The Sixth Secret: Market Makers Control Intraday Volatility
A little-known fact:
India’s intraday volatility is heavily influenced by market makers who adjust hedges every second.
They use:
Delta hedging
Gamma scalping
Vega exposure reduction
Arbitrage between futures and options
Calendar spreads
This creates sudden:
Wicks
Fake breakouts
Violent reversals
Stop-loss hunting
Retail often blames “operators”, but the real cause is market-making algorithms.
7. The Seventh Secret: Expiry Day Moves Follow a Predictable Pattern
Every Thursday (and Tuesday/Friday for other indices), the market behaves differently.
9:15–11:30 AM
Range bound → sellers dominate.
11:30–1:30 PM
Small directional move, often fake.
1:30–3:00 PM
True move begins after OI shift.
3:00–3:20 PM
Massive expiry manipulation.
Expiry tricks:
Add huge OI at far OTM strikes → trap buyers
Shift support/resistance rapidly
Trigger SLs of retailers who go long or short
The secret strategy that institutions use:
Selling ATM straddles and hedging using futures or deep OTM options.
8. The Eighth Secret: Price Moves After Retail Stops Getting Trapped
Retail trader behavior is extremely predictable:
They buy options after big candles
They short after breakdowns
They panic during retracements
They buy tops and sell bottoms
Institutions use this to create traps:
Bull Trap
Breakout → triggers retail longs → market reverses.
Bear Trap
Breakdown → triggers retail shorts → market reverses.
The secret is to analyze:
Long/short buildup data
OI spikes near key levels
Market structure on 5-minute charts
9. The Ninth Secret: Volume Profile + OI = Institutional Footprint
The biggest secret weapon in derivatives trading is combining volume with OI.
1. High Volume + High OI → Strong Institutional Position
Expect a trend continuation.
2. High Volume + OI Unwinding → Trend Reversal
Institutions are exiting.
3. Low Volume + High OI → Trap Zone
Retail buyers are trapped; avoid entries.
Conclusion
Indian derivatives trading is not random — it follows the logic, psychology, and positioning of big players, OI structure, volatility cycles, and institutional strategies. The key secrets revolve around understanding who controls the market, how OI shapes price, how algorithms influence intraday volatility, and how weekly expiries create predictable traps and opportunities.
If you master these hidden mechanisms, derivatives trading transforms from gambling into a strategic and probability-driven game.

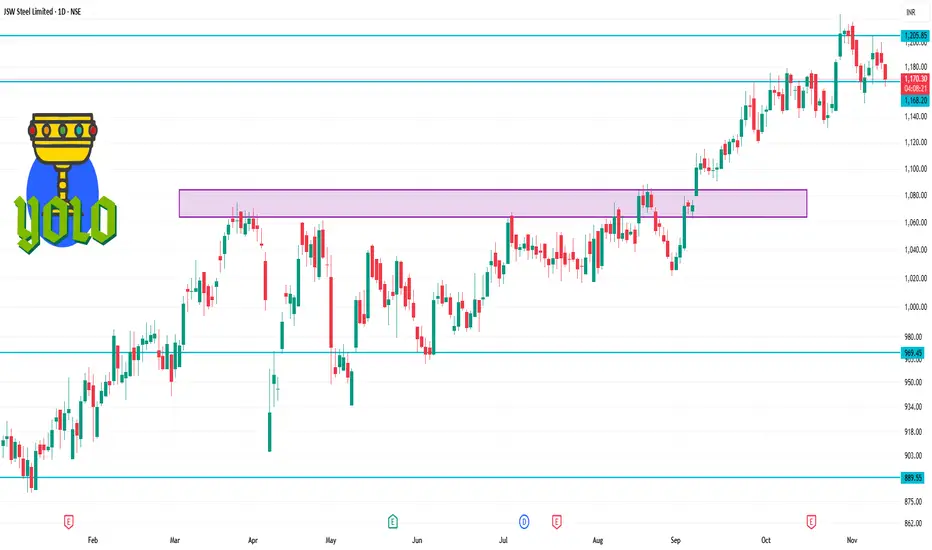
JSWSTEEL 1 Day Time Frame 🔍 Key Levels
Support zone: ~ ₹1,175–₹1,158 (some analyses list support at ~₹1,175, ~₹1,168, ~₹1,158)
Immediate resistance zone: ~ ₹1,192–₹1,209 (resistance at ~₹1,192, ~₹1,202, ~₹1,209)
Pivot point (daily-style): ~ ₹1,070.90 (from one pivot table)
📌 My commentary
The chart suggests if the price falls below ~₹1,175–₹1,158, further downside risk may increase in the short term.
On the upside, a breakout above ~₹1,200–₹1,209 could signal upside momentum building.
Because the pivot (~₹1,070) is significantly lower than current prices in many analyses, it may be less relevant for very short-term trades but still a longer-term structural reference.
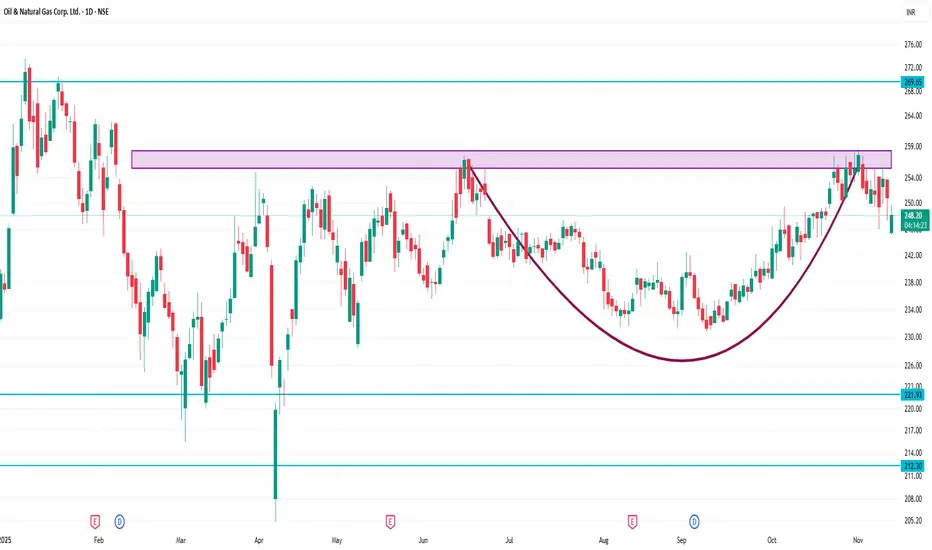
ONGC 1 Day Time Frame 🎯 Key levels to watch on the 1-day chart
Support zone: ~ ₹ 245-243 region (falls in line with support zones and moving average base)
Near support: ~ ₹ 248-250 (if price returns toward pivot/support)
Resistance zone: ~ ₹ 253-257 region (prior resistance, pivot R1, chart resistance).
If ONGC breaks above ~₹ 257 with conviction, next higher resistance might be ~ ₹ 260+ (depending on trend).
If ONGC breaks down below ~₹ 243 (support zone) with volume, possible further drop toward ~₹ 241 or ~₹ 225 in longer term.
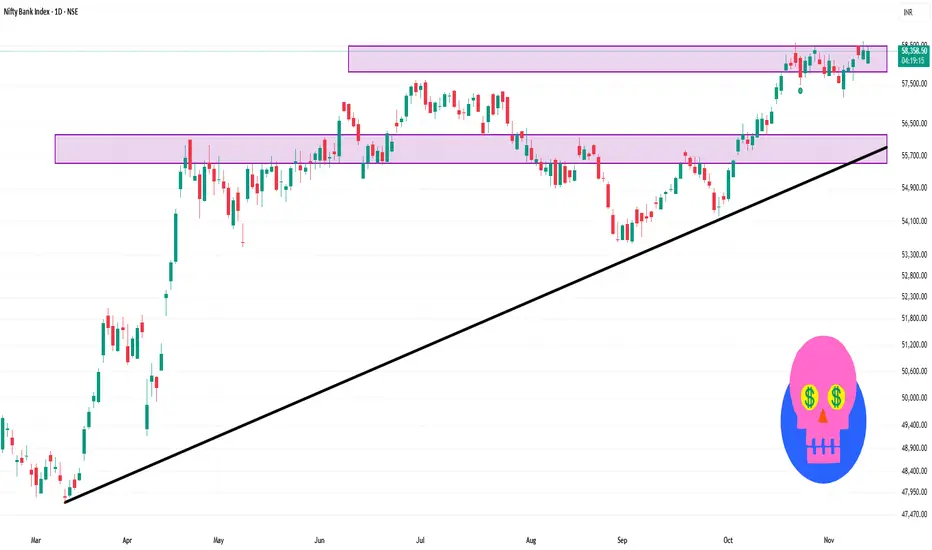
Bank Nifty 1 Day Time Frame 🔍 Current snapshot
Index value: ~ ₹ 58,380.
Recent daily range: approx ₹ 58,050 to ₹ 58,467.
Technical momentum indicators: On the daily timeframe, moving averages are all signalling “outperform”.
📈 Key support & resistance levels
From recent technical commentary:
Resistance 1: ~ ₹ 58,467
Resistance 2: ~ ₹ 58,613.80
Support 1: ~ ₹ 58,188.10
Support 2: ~ ₹ 57,611.50
Additional broader support zone: ~ ₹ 58,000-58,150; a break below opens risk to ~ ₹ 57,700.
NYKAA 1 Day Time Frame ✅ Current price & basic data
Last close ~ ₹256.95.
Intraday range: ~ ₹255.03 to ₹258.60 (based on current session)
52-week range: ~ ₹154.90 (low) to ₹268.25 (high).
🎯 My 1-Day level suggestion
Resistance: ~ ₹260 to ₹265 (if price rises above ~₹257-₹258 today)
Support: ~ ₹250 to ₹252 (if price falls from current)
If I were trading intraday: I’d wait for a clear breakout above ~₹260 with volume for a long, or breakdown below ~₹250 for a short/exit.

Part 9 Trading Master Class With Experts What Are Options?
Options are financial contracts that give a trader the right, but not the obligation, to buy or sell an asset at a fixed price (called the strike price) before or on a specific date (called the expiry).
The underlying asset could be a stock, index, commodity, or currency.
Because options provide choice (whether to exercise or not), they are called “options.”
There are two main types:
Call Option – gives you the right to buy at a fixed price.
Put Option – gives you the right to sell at a fixed price.
In both cases, you pay a premium (price of the option). This is the maximum loss for option buyers.

Candle Patterns Explained Doji Candle – Indicates market indecision where opening and closing prices are almost equal.
Hammer Candle – A bullish reversal signal appearing after a downtrend with a long lower wick.
Shooting Star – A bearish reversal pattern with a small body and a long upper shadow at the top of an uptrend.
Bullish Engulfing – A large bullish candle fully engulfs the previous bearish candle, signaling potential trend reversal upward.
Bearish Engulfing – A large bearish candle fully engulfs the previous bullish candle, hinting at a possible downward reversal.

Premium Chart AnalysisHow to Trade Chart Patterns
To effectively trade chart patterns, follow these steps:
Identify the Pattern Early
Use clear trendlines to mark support and resistance zones.
Confirm shape and symmetry before assuming a pattern.
Wait for Breakout Confirmation
A breakout should be supported by volume expansion—this validates the move.
Avoid acting before confirmation; false breakouts are common.
Set Entry and Exit Points
Enter after a confirmed breakout (preferably with candle close beyond resistance/support).
Target = Height of pattern projected from breakout point.
Stop-loss = Just below (for bullish) or above (for bearish) the breakout level.
Use Multiple Timeframe Analysis
Confirm pattern on higher timeframes to avoid false signals.
Align short-term setups with long-term trends for stronger conviction.

Part 8 Trading Master Class With ExpertsRisks in Option Trading
While options offer great potential, they also come with risks, especially for sellers.
Time Decay: The value of an option decreases as it nears expiry.
Volatility Risk: Unexpected drops in volatility can reduce premium value.
Unlimited Loss (for Writers): Option sellers can face huge losses if the market moves sharply against them.
Complexity: Understanding option behavior and Greeks requires knowledge and experience.
Therefore, beginners should start small and practice on demo accounts or low-risk strategies before committing large capital.

Part 7 Trading Master Class With Experts Types of Option Strategies
Option trading is not just about buying calls or puts; it involves strategic combinations to profit under various market conditions. Some popular strategies include:
a) Bullish Strategies
Bull Call Spread: Buying a lower strike call and selling a higher strike call.
Bull Put Spread: Selling a higher strike put and buying a lower strike put.
b) Bearish Strategies
Bear Call Spread: Selling a lower strike call and buying a higher strike call.
Bear Put Spread: Buying a higher strike put and selling a lower strike put.
c) Neutral Strategies
Iron Condor: Selling one call and one put at close strikes while buying further out-of-the-money options.
Straddle: Buying both a call and put at the same strike to profit from big moves in either direction.
Strangle: Buying a call and a put at different strikes to benefit from volatility.
These strategies allow traders to earn consistent returns by managing risk rather than relying purely on market direction.

Part 6 Learn Institutional Trading
Option Greeks
Option traders use “Greeks” to measure how different factors affect the price of an option:
Delta: Measures how much the option price changes with a ₹1 change in the underlying.
Gamma: Measures the rate of change of Delta.
Theta: Measures time decay – how much value an option loses each day as expiry approaches.
Vega: Measures sensitivity to volatility.
Rho: Measures sensitivity to interest rates.
Understanding Greeks helps traders manage risk and make informed decisions.

Part 4 Learn Institutional Trading Participants in the Options Market
There are four types of participants in the options market:
Buyers of Call Options – Expect the price to go up.
Sellers of Call Options – Expect the price to stay the same or fall.
Buyers of Put Options – Expect the price to fall.
Sellers of Put Options – Expect the price to stay the same or rise.
Buyers take limited risk (the premium) with unlimited profit potential, while sellers take limited profit (the premium received) but unlimited risk.

Part 3 Learn Institutional Trading How Option Trading Works
When you trade options, you’re speculating on how the price of the underlying asset will move within a specific time frame. Here’s how it works for both types of options:
a) Call Option Example
Suppose Reliance stock is trading at ₹2,500. You buy a Call Option with a strike price of ₹2,520, paying a premium of ₹20.
b) Put Option Example
You buy a Put Option on Reliance with a strike price of ₹2,480 and pay a ₹15 premium.

Part 2 Ride The Big Moves Key Terminology in Option Trading
To understand option trading, you must be familiar with a few important terms:
Underlying Asset: The financial instrument (e.g., NIFTY, Bank NIFTY, Reliance Industries) on which the option is based.
Strike Price: The fixed price at which the underlying can be bought or sold.
Premium: The price paid by the buyer to the seller for owning the option contract.
Expiry Date: The last day on which the option can be exercised. In India, index options usually expire weekly or monthly.
Lot Size: The minimum quantity of the underlying asset that can be traded per option contract.
In the Money (ITM): When exercising the option gives a profit.
At the Money (ATM): When the strike price equals the current market price.
Out of the Money (OTM): When exercising the option gives no profit.

ANGELONE 1 Day Time Frame 📌 Key Levels (Daily)
Pivot (Classic): ≈ ₹2,675.77.
Resistance zones:
R1 (Classic): ~ ₹2,713.73
R2: ~ ₹2,747.97
Support zones:
S1 (Classic): ~ ₹2,641.53
S2: ~ ₹2,603.57
⚠️ Important Caveats
These levels are calculated from daily data — they do not guarantee the stock will only move within these ranges or behave exactly as outlined.
Market conditions, news, F&O flows, and broader sector moves can invalidate these levels rapidly.
Use these levels along with your own risk management: stop-losses, position size, and timeframe.
The data may have a delay or slight inaccuracy — always cross-verify with live quotes.

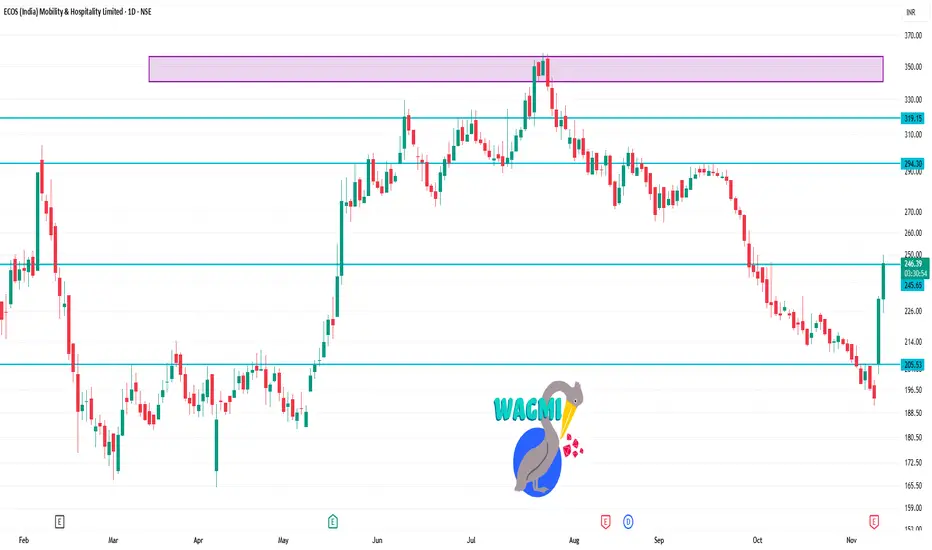
ECOSMOBLTY 1 Day Time Frame Last traded price: ₹ 246.55 (up ~6.69% today)
Day’s range: Low ~ ₹ 225.20, High ~ ₹ 248.50
52-week range: Low ~ ₹ 165.00, High ~ ₹ 361.40
⚠️ Caveats
Technical outlook alone doesn’t account for fundamental news, upcoming earnings, macro factors. For example, their upcoming board meeting/earnings may influence price sharply.
The “oversold” RSI does not guarantee a reversal — especially in a strong downtrend, oversold can persist.
Trading on a 1-day time-frame is riskier (higher volatility, noise) — keep tight risk control.
Part 1 Ride The Big Moves What is an Option?
An option is a financial derivative whose value is derived from an underlying asset such as a stock, index, or commodity. Options come in two primary forms:
Call Option: It gives the holder the right to buy the underlying asset at a predetermined price (known as the strike price) before or on the expiry date.
Put Option: It gives the holder the right to sell the underlying asset at a predetermined strike price before or on the expiry date.
The buyer of an option pays a premium to the seller (also called the writer) for this right. The seller receives the premium as income but takes on the obligation to buy or sell the asset if the buyer chooses to exercise the option.

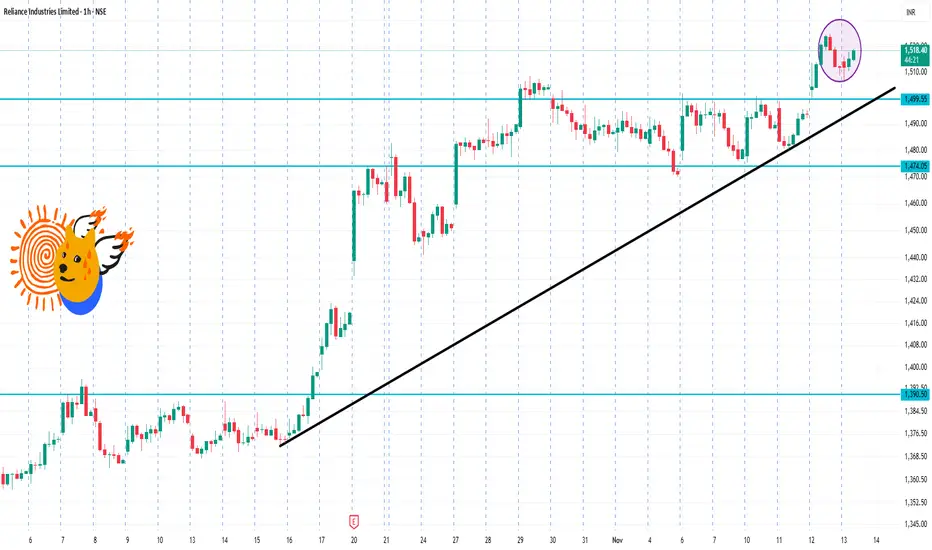
RIL 1 Hour Time Frame🔍 Current basics
Latest traded price: ~ ₹1,518 on NSE.
52-week range: Low ~ ₹1,114.85, High ~ ₹1,551.00.
Technical indicator summary (on 1-hour/higher timeframes) shows a “Strong Buy” bias.
⚠️ Risks / Caveats
Even though the technicals are bullish, the stock is close to its 52-week high (~ ₹1,551). Highs often mean less “room” for upside without some pullback.
Intraday patterns can change quickly with macro news or sector moves (eg: oil & gas, regulatory).
Support at ~₹1,500 is fairly close to current; a break could expose the ₹1,470–₹1,480 region.
Because this is a large-cap and widely held stock, institutional moves and volume matter a lot.