Part 6 Learn Institutional Trading What Are Options?
An option is a financial derivative whose value is based on an underlying asset—such as stocks, indices, or commodities. The two main types of options are:
Call Option: Gives the holder the right to buy an asset at a specific price (called the strike price) before or on the expiration date.
Put Option: Gives the holder the right to sell an asset at a specific strike price before or on the expiration date.
The buyer of an option pays a premium to the seller (writer) for this right. The seller, in return, assumes an obligation—if the buyer exercises the option, the seller must fulfill the contract terms.
Trend Line Break

Advanced Chart Patterns in Technical Analysis1. Introduction to Advanced Chart Patterns
In trading, patterns repeat because human behavior is repetitive. Fear, greed, and hope drive market movements, and these emotions get imprinted in price charts. Advanced chart patterns are an extension of classical technical formations, combining structure, volume, and momentum to forecast price trends. Mastering them helps traders differentiate between false breakouts and genuine opportunities.
Advanced patterns generally fall into two main categories:
Continuation Patterns – Indicating a pause before the prevailing trend continues.
Reversal Patterns – Signaling the end of a trend and the beginning of a new one.
2. Head and Shoulders (Reversal Pattern)
The Head and Shoulders pattern is one of the most reliable reversal signals. It indicates a change in trend direction — from bullish to bearish (standard form) or from bearish to bullish (inverse form).
Structure:
Left shoulder: A price rise followed by a decline.
Head: A higher peak than the left shoulder, followed by another decline.
Right shoulder: A lower rise, followed by a breakdown through the neckline.
Neckline: Connects the lows between the shoulders and serves as a key breakout level.
Once the price breaks below the neckline, it confirms a bearish reversal. The target is estimated by measuring the distance from the head to the neckline and projecting it downward.
Inverse Head and Shoulders works similarly but in the opposite direction — signaling a bullish reversal after a downtrend.
3. Cup and Handle Pattern
The Cup and Handle is a bullish continuation pattern resembling a teacup. It was popularized by William O’Neil in his book How to Make Money in Stocks.
Formation:
Cup: A rounded bottom, showing a gradual shift from selling to buying.
Handle: A short pullback or consolidation that follows the cup, forming a downward-sloping channel.
When the price breaks above the handle’s resistance with strong volume, it often signals a continuation of the prior uptrend.
Target: The depth of the cup added to the breakout point.
This pattern is often seen in growth stocks and long-term bullish markets.
4. Double Top and Double Bottom
These patterns are classic but essential to advanced technical traders due to their reliability and frequency.
Double Top:
Appears after a strong uptrend.
Price makes two peaks at similar levels separated by a moderate decline.
A breakdown below the “neckline” confirms a bearish reversal.
Double Bottom:
Appears after a downtrend.
Two troughs form around the same level with a peak in between.
A breakout above the neckline signals a bullish reversal.
Volume confirmation is crucial — rising volume on the breakout adds credibility to the pattern.
5. Flag and Pennant Patterns
Flags and Pennants are short-term continuation patterns that often appear after a strong price movement, known as the “flagpole.”
Flag: Forms as a small rectangular channel sloping against the main trend.
Pennant: Appears as a small symmetrical triangle following a sharp move.
These patterns typically consolidate the market before the next strong move in the same direction.
Breakout Rule:
When price breaks in the direction of the previous trend, accompanied by high volume, it confirms continuation.
Target Projection:
Length of the flagpole added to the breakout point.
6. Wedge Patterns
Wedges are advanced chart patterns signaling either continuation or reversal depending on their position and direction.
Rising Wedge:
Forms when price makes higher highs and higher lows, but the slope narrows upward.
Typically appears in an uptrend and indicates weakening bullish momentum — a bearish reversal signal.
Falling Wedge:
Forms with lower highs and lower lows converging downward.
Usually appears in a downtrend, indicating a potential bullish reversal.
Volume generally declines during formation and expands during breakout, confirming the move.
7. Symmetrical, Ascending, and Descending Triangles
Triangles represent consolidation phases and serve as reliable continuation patterns.
Symmetrical Triangle:
Characterized by converging trendlines with no clear direction bias.
Breakout direction typically follows the prior trend.
Ascending Triangle:
Horizontal resistance with rising support.
Usually forms during an uptrend, signaling bullish continuation.
Descending Triangle:
Horizontal support with declining resistance.
Typically bearish, indicating continuation of a downtrend.
Triangles are volume-sensitive patterns — declining volume during formation and surge during breakout strengthens reliability.
8. Rectangle Pattern
A Rectangle or Trading Range represents a period of indecision between buyers and sellers.
Formation: Price oscillates between horizontal support and resistance.
Interpretation:
Breakout above resistance → bullish signal.
Breakdown below support → bearish signal.
Traders often trade within the rectangle until a confirmed breakout occurs, using stop-losses near the opposite boundary.
9. Diamond Pattern
The Diamond Top is an advanced reversal pattern that forms after a prolonged uptrend. It begins as a broadening formation (wider price swings) and ends with a narrowing triangle — resembling a diamond shape.
Indicates distribution and market exhaustion.
Once price breaks below the support line, it confirms a bearish reversal.
This pattern is rare but highly reliable when spotted correctly.
10. Harmonic Patterns (Advanced Category)
Harmonic patterns use Fibonacci ratios to predict potential reversals with high precision. These include Gartley, Bat, Butterfly, and Crab patterns.
Gartley Pattern: Indicates retracement within a trend, typically completing at the 78.6% Fibonacci level.
Bat Pattern: Uses deeper retracement levels (88.6%) to identify precise turning points.
Butterfly Pattern: Suggests a reversal near 127% or 161.8% Fibonacci extensions.
Crab Pattern: Known for extreme projections (up to 224% or more), signaling deep retracements.
These patterns require advanced understanding of Fibonacci tools and are used by professional traders for precision entries.
11. Rounding Bottom and Top
Rounding Bottom:
Gradual shift from bearish to bullish sentiment.
Indicates long-term accumulation before a breakout.
Typically seen in major trend reversals in large-cap stocks.
Rounding Top:
Slow shift from bullish to bearish sentiment.
Represents distribution and is often followed by a sustained downtrend.
These patterns form over long durations (weeks or months) and are reliable for positional traders.
12. Broadening Formation
Also known as a megaphone pattern, it shows increasing volatility and investor uncertainty.
Formation: Two diverging trendlines — one ascending, one descending.
Meaning: Early sign of market instability; may precede major reversals.
Trade Setup: Enter once a confirmed breakout occurs beyond the pattern boundaries.
13. Volume and Confirmation in Chart Patterns
Volume plays a critical role in confirming pattern validity. Key principles include:
Decreasing volume during consolidation or pattern formation.
Increasing volume during breakout, confirming institutional participation.
False breakouts often occur on low volume, trapping retail traders.
Combining volume indicators (like OBV or Volume Oscillator) with pattern analysis enhances accuracy.
14. Practical Application and Risk Management
Even the most reliable patterns fail without proper risk management and confirmation strategies.
Wait for breakout confirmation with candle close beyond key levels.
Use stop-loss slightly below support or above resistance.
Combine patterns with momentum indicators like RSI or MACD for confirmation.
Avoid overtrading; focus on quality setups with clear symmetry and volume validation.
15. Conclusion
Advanced chart patterns bridge the gap between price action and trader psychology. They help traders interpret market behavior and anticipate future movements with a structured approach. Patterns like the Cup and Handle, Head and Shoulders, and Wedges reveal not just the direction but also the strength and conviction of trends.
Mastering these patterns requires practice, discipline, and confirmation through indicators and volume. When used correctly, advanced chart patterns empower traders to make informed, high-probability decisions — transforming random price data into profitable trading opportunities.
Option Buying vs Option Selling in the Indian Market1. Understanding Options in Brief
An option is a financial derivative contract that gives the buyer the right, but not the obligation, to buy or sell an underlying asset (such as Nifty, Bank Nifty, or stocks) at a predetermined price (strike price) before or on a specific date (expiry date).
Call Option (CE): Gives the buyer the right to buy the asset.
Put Option (PE): Gives the buyer the right to sell the asset.
The seller (also known as the writer) of an option, on the other hand, has the obligation to fulfill the contract if the buyer decides to exercise it.
2. Option Buying – The Right Without Obligation
Definition:
When a trader buys an option, they pay a premium to acquire the right to buy (Call) or sell (Put) the underlying asset. This is a leveraged position where the maximum loss is limited to the premium paid.
Example:
Suppose Nifty is trading at 22,000 and a trader buys a 22,000 CE at ₹150. If Nifty rises to 22,400 by expiry, the option may be worth ₹400, giving a profit of ₹250 (₹400 - ₹150).
If Nifty falls or remains below 22,000, the option expires worthless, and the buyer loses ₹150 (premium).
Advantages of Option Buying:
Limited Risk: The maximum loss is limited to the premium paid.
Unlimited Profit Potential: Profits can be substantial if the underlying asset moves sharply in the expected direction.
Leverage: Traders can control large positions with a small amount of capital.
Hedging Tool: Option buyers can hedge existing stock or portfolio positions against adverse movements.
Simplicity: Easier to understand for beginners as risks are predefined.
Disadvantages of Option Buying:
Time Decay (Theta): The value of options erodes as expiry approaches if the price does not move favorably.
Low Probability of Success: Most options expire worthless; hence, consistent profitability is difficult.
Implied Volatility (IV) Risk: A drop in volatility can reduce option prices even if the direction is correct.
Requires Precise Timing: The move in the underlying must be quick and significant to overcome time decay.
3. Option Selling – The Power of Probability
Definition:
Option sellers (writers) receive a premium by selling (writing) options. They are obligated to fulfill the contract if the buyer exercises it. Sellers profit when the market remains stable or moves against the option buyer’s position.
Example:
If a trader sells a Nifty 22,000 CE at ₹150 and Nifty remains below 22,000 till expiry, the seller keeps the entire ₹150 premium as profit. However, if Nifty rises to 22,400, the seller incurs a loss of ₹250 (₹400 - ₹150).
Advantages of Option Selling:
High Probability of Profit: Since most options expire worthless, sellers statistically have better odds.
Benefit from Time Decay: Sellers gain as the option premium reduces with each passing day.
Volatility Advantage: When volatility drops, option prices fall, benefiting sellers.
Range-Bound Profitability: Sellers can profit even in sideways markets, unlike buyers who need strong price movement.
Disadvantages of Option Selling:
Unlimited Risk: Losses can be theoretically unlimited, especially for uncovered (naked) positions.
Margin Requirement: Sellers must maintain significant margin with brokers, reducing leverage.
Emotional Stress: Constant monitoring is needed as rapid moves in the market can cause heavy losses.
Complex Strategies Required: Often, sellers use spreads or hedges to control risk, which requires advanced knowledge.
4. Market Behavior and Strategy Selection
Option Buyers Thrive When:
The market makes sharp and fast movements in a particular direction.
Implied volatility is low before the trade and increases later.
There is a news event or earnings announcement expected to cause large swings.
The trend is strong and directional (e.g., breakout setups).
Example Strategies for Buyers:
Long Call or Long Put
Straddle or Strangle (when expecting volatility)
Call Debit Spread or Put Debit Spread
Option Sellers Succeed When:
The market remains range-bound or moves slowly.
Implied volatility is high at the time of entry and drops later.
Time decay favors them as expiry nears.
The trader expects no major event or breakout.
Example Strategies for Sellers:
Short Straddle / Short Strangle
Iron Condor
Credit Spreads (Bull Put Spread, Bear Call Spread)
Covered Call Writing
5. Role of Implied Volatility (IV) and Time Decay
In the Indian market, IV and Theta play crucial roles in deciding profitability.
For Buyers:
They need an increase in IV (expectation of higher movement). Rising IV inflates option premiums, helping buyers.
For Sellers:
They gain when IV drops (post-event or consolidation), as option prices fall.
Time Decay (Theta) always works against buyers and in favor of sellers. For example, in the last week before expiry, options lose value rapidly if the underlying does not move significantly.
6. Regulatory and Practical Considerations in India
Margins: SEBI’s framework requires SPAN + Exposure margin, making naked selling capital-intensive.
Liquidity: Nifty, Bank Nifty, and FinNifty have high liquidity, making both buying and selling viable.
Taxation: Option profits are treated as business income for both buyers and sellers.
Brokerage and Slippage: Active option sellers often face higher transaction costs due to large volumes.
Retail Participation: Most retail traders prefer buying options due to low capital requirements, while professional traders prefer selling for steady income.
7. Real-World Insights
Around 70–80% of retail traders in India buy options, but most lose money due to time decay and poor timing.
Professional traders and institutions prefer option writing using hedged strategies to generate consistent returns.
Successful traders often combine both — buying for directional plays and selling for income generation.
8. Which Is Better – Buying or Selling?
There’s no one-size-fits-all answer. It depends on market conditions, trading capital, and risk appetite.
If you have small capital, prefer buying options with strict stop-loss and a clear directional view.
If you have large capital and can manage risk with spreads or hedges, selling options can provide consistent returns.
Combining both (for example, selling options in high volatility and buying in low volatility) can create balance.
Conclusion
The debate between option buying and option selling in the Indian market revolves around risk vs. probability. Option buyers enjoy limited risk and unlimited profit potential but low success rates. Option sellers face higher risk but benefit from time decay and probability in their favor.
In essence:
Buy options when expecting a big, fast move.
Sell options when expecting a range-bound or stable market.
A disciplined approach, risk management, and understanding of volatility are the keys to succeeding in either strategy. In the dynamic Indian derivatives market, mastering both sides of the trade — when to buy and when to sell — transforms an ordinary trader into a consistently profitable one.

Implied Volatility and Open Interest Analysis1. Understanding Implied Volatility (IV)
Implied Volatility is a metric derived from the market price of options that reflects the market’s expectations of future volatility in the price of the underlying asset. Unlike historical volatility, which measures past price fluctuations, IV is forward-looking—it tells us how much the market expects the asset to move in the future.
Key Characteristics of IV:
Expressed in percentage terms, showing the expected annualized movement in the underlying asset.
Does not predict direction—only the magnitude of expected price swings.
Higher IV means the market expects larger price movements (high uncertainty or fear).
Lower IV means smaller expected price movements (stability or complacency).
Factors Influencing Implied Volatility:
Market sentiment: During uncertainty or events like elections, budgets, or economic announcements, IV tends to rise.
Supply and demand for options: Heavy buying of options increases IV, while heavy selling reduces it.
Time to expiration: Longer-duration options usually have higher IV due to greater uncertainty over time.
Earnings or corporate events: Stocks often show rising IV ahead of quarterly earnings announcements.
2. Interpreting Implied Volatility
High IV Environment:
When IV is high, option premiums are expensive. This generally indicates:
Traders expect significant movement (up or down).
Fear or uncertainty is present in the market.
Volatility sellers (option writers) might see an opportunity to sell overpriced options.
For example, before major events like the Union Budget or RBI policy meeting, IV in Nifty options typically spikes due to the anticipated market reaction.
Low IV Environment:
When IV is low, option premiums are cheaper. This usually means:
The market expects calm or limited movement.
Traders may be complacent.
Volatility buyers might see an opportunity to buy options cheaply before an expected rise in volatility.
Implied Volatility Rank (IVR) and IV Percentile:
IV Rank compares current IV to its range over the past year.
Example: An IV Rank of 80 means current IV is higher than 80% of the past year’s readings.
IV Percentile shows the percentage of time IV has been below current levels.
Both help traders decide if options are cheap or expensive relative to history.
3. Understanding Open Interest (OI)
Open Interest represents the total number of outstanding option or futures contracts that are currently open (not yet closed, exercised, or expired). It indicates the total participation or liquidity in a particular strike or contract.
For example, if a trader buys 1 Nifty 22000 Call and another trader sells it, OI increases by one contract. If later that position is closed, OI decreases by one.
Key Aspects of OI:
Rising OI with rising prices = new money entering the market (bullish).
Rising OI with falling prices = fresh short positions (bearish).
Falling OI with rising or falling prices = unwinding of positions (profit booking or exit).
Stable OI = sideways or consolidating market.
4. How to Read Open Interest Data
OI and Price Relationship:
Price Trend OI Trend Market Interpretation
↑ Price ↑ OI Long build-up (bullish)
↓ Price ↑ OI Short build-up (bearish)
↑ Price ↓ OI Short covering (bullish)
↓ Price ↓ OI Long unwinding (bearish)
For example, if Nifty futures rise by 150 points and OI increases, traders are opening new long positions, suggesting bullishness. But if prices rise while OI falls, short positions are being covered.
5. Using OI in Option Chain Analysis
In options trading, OI is especially useful for identifying support and resistance zones.
High Call OI indicates a potential resistance level because sellers expect the price to stay below that strike.
High Put OI indicates a potential support level because sellers expect the price to stay above that strike.
For instance:
If Nifty has maximum Call OI at 22500 and maximum Put OI at 22000, traders consider this as a range of consolidation (22000–22500).
A breakout above 22500 or breakdown below 22000 with sharp OI changes can signal a shift in trend.
6. Combining IV and OI for Better Insights
Using IV and OI together gives a more complete picture of the market’s mindset.
Scenario 1: Rising IV + Rising OI
Indicates strong speculative activity.
Traders expect big moves, either due to events or upcoming volatility.
Suitable for straddle or strangle buyers.
Scenario 2: Falling IV + Rising OI
Implies calm market conditions with new positions being built.
Traders expect limited movement.
Suitable for option writing strategies (like Iron Condor, Short Straddle).
Scenario 3: Rising IV + Falling OI
Suggests short covering or unwinding due to fear.
Market participants are closing existing positions amid uncertainty.
Scenario 4: Falling IV + Falling OI
Indicates profit booking after a volatile phase.
Usually happens in post-event consolidation.
7. Practical Example: Nifty Option Chain Analysis
Suppose the Nifty 50 index is trading around 22,300.
Strike Call OI Put OI IV (Call) IV (Put)
22,000 4.8 L 6.2 L 15% 16%
22,300 5.5 L 5.1 L 17% 18%
22,500 7.8 L 3.9 L 20% 17%
Here:
Maximum Call OI at 22,500 → Resistance zone.
Maximum Put OI at 22,000 → Support zone.
IV is rising across strikes → traders expect upcoming volatility.
If price moves above 22,500 and Call writers exit (OI drops), while new Put OI builds, it signals a bullish breakout.
8. Role of IV and OI in Strategy Selection
High IV Strategies (Volatile Market):
Buy Straddle or Strangle (expecting large movement)
Calendar Spread
Long Vega strategies
Low IV Strategies (Stable Market):
Iron Condor
Short Straddle
Covered Call
Credit Spreads
OI data helps traders identify which strikes to select for these strategies and where the market might reverse or consolidate.
9. Limitations of IV and OI Analysis
While powerful, both metrics have limitations:
IV can be misleading before major events; it reflects expectations, not certainty.
OI data is end-of-day in many cases, so intraday traders might miss rapid shifts.
Sharp OI changes might also result from rollovers or hedging adjustments, not directional bias.
Hence, traders must use IV and OI along with price action, volume, and trend indicators for confirmation.
10. Conclusion
Implied Volatility and Open Interest form the foundation of options market sentiment analysis.
IV tells us what the market expects to happen in terms of movement magnitude.
OI tells us how much participation or commitment traders have in the current trend.
Together, they reveal a deeper layer of market psychology—identifying whether traders are fearful, greedy, hedging, or speculating.
For successful trading, combining price action + IV + OI enables traders to forecast volatility cycles, confirm trends, and time their entries or exits effectively.
In essence, mastering IV and OI analysis empowers traders to read the invisible hand of market sentiment—a crucial skill for anyone in the derivatives market.
Multi-Timeframe Analysis (Intraday, Swing, Positional)1. Understanding Multi-Timeframe Analysis
Multi-Timeframe Analysis refers to the process of observing the same security across different timeframes to identify trend alignment, potential reversal zones, and optimal trading opportunities. Every timeframe provides unique insights:
Higher Timeframe: Defines the major trend and key support/resistance zones.
Intermediate Timeframe: Helps identify swing trends within the larger move.
Lower Timeframe: Provides precise entry and exit signals.
For example, a trader analyzing Nifty 50 might observe:
Daily Chart (Positional) for the overall trend direction.
Hourly Chart (Swing) for intermediate momentum.
15-Minute Chart (Intraday) for entry confirmation.
This top-down approach ensures that trades are placed in harmony with the broader market movement rather than against it.
2. The Logic Behind Multi-Timeframe Analysis
Financial markets are fractal in nature, meaning patterns repeat on various time scales. A breakout on a 5-minute chart might just be a retracement on a 1-hour chart, while a downtrend on a daily chart could appear as a bullish trend on a 15-minute chart.
MTA helps traders:
Identify dominant trends (macro view).
Spot short-term countertrends (micro adjustments).
Time entries with high probability setups.
Essentially, it synchronizes multiple layers of information to produce well-informed trading decisions.
3. Types of Traders and Timeframes
Each trader category operates within different time horizons:
A. Intraday Traders
Objective: Capture small price moves within a single trading day.
Timeframes Used: 1-minute, 5-minute, 15-minute, and 1-hour charts.
Holding Period: A few minutes to several hours.
Example: A trader identifies a bullish breakout on the 15-minute chart, confirms strength on the 5-minute chart, and exits before the market close.
B. Swing Traders
Objective: Ride short to medium-term trends lasting several days or weeks.
Timeframes Used: 1-hour, 4-hour, and daily charts.
Holding Period: 2 to 15 days typically.
Example: A bullish pattern on the daily chart confirmed by a 4-hour breakout helps the trader capture a multi-day price rally.
C. Positional Traders
Objective: Trade major trends that can last from weeks to months.
Timeframes Used: Daily, weekly, and monthly charts.
Holding Period: Several weeks to many months.
Example: A trader identifies a long-term uptrend on the weekly chart and holds positions through short-term fluctuations.
Each trader uses MTA to align smaller trends within the context of larger ones.
4. The Top-Down Approach
The Top-Down Approach is a systematic method of conducting multi-timeframe analysis. It involves starting with the highest relevant timeframe and drilling down to lower timeframes for precision.
Step 1: Identify the Major Trend (Higher Timeframe)
Use weekly or daily charts to determine the broader market direction.
Apply moving averages, trendlines, or price structure (higher highs and higher lows).
Example: On the weekly chart, Nifty 50 is in an uptrend.
Step 2: Confirm Momentum (Intermediate Timeframe)
Switch to a 4-hour or 1-hour chart to check if the momentum supports the higher timeframe trend.
Look for consolidation, breakouts, or pullbacks.
Step 3: Refine Entry and Exit (Lower Timeframe)
Use 15-minute or 5-minute charts to time entries and exits.
Identify short-term support, resistance, and candlestick patterns for precision.
This method ensures alignment between long-term direction and short-term trade execution, minimizing false signals and improving accuracy.
5. Example of Multi-Timeframe Analysis in Action
Let’s illustrate with an example:
Weekly Chart (Positional View): Shows a strong uptrend with price above 50-day moving average.
Daily Chart (Swing View): Reveals a bullish flag pattern forming after a rally.
Hourly Chart (Intraday View): Displays a breakout above the flag resistance with volume confirmation.
A positional trader may initiate a long position based on weekly strength, while a swing trader enters after the daily flag breakout. An intraday trader could use the hourly chart to time the exact breakout candle entry.
All three traders align their strategies to the same trend but operate on different time horizons.
6. Tools and Indicators Used in Multi-Timeframe Analysis
Several tools enhance the effectiveness of MTA:
Moving Averages (MA): Identify trend direction and alignment across timeframes (e.g., 20 EMA, 50 SMA).
Relative Strength Index (RSI): Helps confirm momentum consistency.
MACD: Detects shifts in momentum and crossovers aligning with major trends.
Support and Resistance Levels: Define crucial zones visible across charts.
Trendlines and Channels: Show structure of price swings.
Candlestick Patterns: Confirm entry signals on smaller timeframes.
Combining these tools across multiple frames builds confluence—an essential component of successful trading.
7. Advantages of Multi-Timeframe Analysis
Trend Confirmation:
Confirms whether short-term movements align with the long-term trend, improving accuracy.
Reduced False Signals:
Helps filter noise from smaller charts that may mislead traders.
Enhanced Entry Timing:
Allows traders to enter trades at precise moments when all timeframes agree.
Better Risk Management:
By aligning with larger trends, traders can define stop-loss and target levels more logically.
Adaptability Across Strategies:
Suitable for scalping, swing trading, or long-term investing.
8. Challenges in Multi-Timeframe Analysis
While MTA is powerful, it also presents certain difficulties:
Information Overload: Analyzing multiple charts can cause confusion or analysis paralysis.
Conflicting Signals: Short-term and long-term charts may show opposite trends, requiring trader judgment.
Execution Complexity: Managing entries and exits across multiple timeframes demands discipline and experience.
Emotional Bias: Traders may get biased by one timeframe and ignore contradictory evidence.
Therefore, consistency in analysis and clear trading rules are vital to prevent confusion.
9. Tips for Effective Multi-Timeframe Trading
Always start with higher timeframes before moving down.
Use a ratio of 1:4 or 1:6 between timeframes (e.g., daily → 4-hour → 1-hour).
Focus on key support/resistance levels visible across multiple frames.
Avoid overcomplicating; two or three timeframes are usually enough.
Maintain a trading journal to note observations from each timeframe.
Use alerts or automated tools to monitor price behavior when multiple charts are involved.
10. Conclusion
Multi-Timeframe Analysis is not just a technique but a strategic framework that enhances decision-making across trading styles—whether intraday, swing, or positional. By combining insights from different timeframes, traders gain a holistic view of the market, identify high-probability setups, and reduce the risk of false entries.
For intraday traders, MTA refines timing; for swing traders, it offers trend confirmation; and for positional traders, it ensures long-term alignment. When executed with discipline, proper analysis, and risk control, Multi-Timeframe Analysis becomes one of the most reliable methods to trade profitably in volatile markets like India’s NSE and BSE.
Algorithmic and High-Frequency Trading (HFT) in India1. Understanding Algorithmic Trading
Algorithmic trading refers to the use of computer programs and mathematical models to automate the process of trading financial instruments such as equities, derivatives, currencies, and commodities. Instead of manual execution by human traders, algorithms follow predefined instructions based on time, price, quantity, and other market parameters.
In India, algorithmic trading gained momentum after the Securities and Exchange Board of India (SEBI) permitted it in 2008 for institutional investors. Since then, it has grown exponentially with the adoption of advanced technologies such as Artificial Intelligence (AI), Machine Learning (ML), and Big Data analytics.
Algorithmic trading strategies are typically designed to:
Reduce transaction costs
Minimize human emotions in trading
Execute large orders without disrupting market prices
Capitalize on small, short-lived price inefficiencies
Common strategies include trend-following, statistical arbitrage, mean reversion, market making, and pairs trading.
2. High-Frequency Trading (HFT) Explained
High-Frequency Trading (HFT) is a specialized subset of algorithmic trading characterized by extremely high-speed trade execution, large volumes of orders, and very short holding periods. HFT firms rely on:
Ultra-low latency networks
Co-location facilities (where trading servers are placed near exchange servers)
Advanced algorithms capable of executing thousands of trades per second
The goal of HFT is to profit from microsecond-level market inefficiencies—such as differences in bid-ask spreads, arbitrage opportunities between exchanges, or momentary price dislocations.
In India, HFT is primarily used by institutional investors, proprietary trading firms, and hedge funds that have access to advanced infrastructure and regulatory approvals.
3. Evolution of Algo and HFT in India
India’s journey toward algorithmic and HFT trading began in the late 2000s. The National Stock Exchange (NSE) was among the first to offer Direct Market Access (DMA) and co-location services, enabling institutional participants to connect directly to the exchange infrastructure with minimal latency.
2008: SEBI allowed institutional investors to use algorithmic trading.
2010-2012: Exchanges introduced co-location services and low-latency networks.
2013 onwards: Rapid growth in automated order flow; by some estimates, over 40% of equity and derivatives trades were algorithmically driven.
2020s: Integration of AI, ML, and predictive analytics in trading algorithms.
With rising competition among institutional players, Indian exchanges have continuously upgraded their technology to handle high message traffic, ensuring fairness and stability in automated markets.
4. Key Participants in Indian Algo and HFT Ecosystem
Institutional Investors: Mutual funds, pension funds, and insurance companies use algorithmic systems to execute large orders efficiently.
Proprietary Trading Firms: They rely heavily on HFT and statistical arbitrage strategies to exploit microsecond-level opportunities.
Foreign Institutional Investors (FIIs): Many global firms deploy HFT strategies in Indian markets through subsidiaries or partnerships.
Retail Traders: Although limited, retail participation is increasing through brokers offering API-based trading platforms and algorithmic bots.
Exchanges and Brokers: NSE and BSE provide the technological backbone with co-location and data feed services, while brokers offer execution APIs and backtesting tools.
5. Technological Infrastructure Supporting HFT
The success of algorithmic and HFT trading depends on speed, precision, and data quality. Indian exchanges have developed world-class infrastructure that supports high-frequency trading through:
Co-location facilities for ultra-low latency trading
High-speed fiber-optic and microwave communication networks
Real-time market data feeds with millisecond granularity
Application Programming Interfaces (APIs) for automated order routing
Advanced risk management systems to monitor orders and prevent errors
Additionally, the rise of cloud computing and AI-driven analytics allows traders to process vast volumes of tick-level data and develop predictive models for future price movements.
6. Popular Algorithmic Trading Strategies in India
Several algorithmic strategies are widely employed in Indian markets, including:
Arbitrage Strategies: Exploiting price differences between cash and futures, or across exchanges (NSE vs. BSE).
Market Making: Providing liquidity by continuously quoting buy and sell prices.
Momentum and Trend Following: Identifying and riding price trends using moving averages or momentum indicators.
Statistical Arbitrage: Using quantitative models to exploit temporary price inefficiencies between correlated assets.
News-Based Trading: Using natural language processing (NLP) to react instantly to news or corporate announcements.
7. Regulatory Framework by SEBI
Given the complexity and speed of algorithmic and HFT activity, SEBI plays a critical role in ensuring market integrity and fairness. The regulator has introduced several guidelines, including:
Pre-trade risk checks: To prevent erroneous or large orders that could disrupt markets.
Order-to-trade ratio limits: To control excessive order cancellations by HFT firms.
Unique Algo IDs: Each algorithm must be registered and tested before deployment.
Latency equalization measures: SEBI proposed “random speed bumps” to reduce unfair advantages from co-location.
Surveillance systems: Exchanges continuously monitor unusual order patterns or spoofing activities.
These measures ensure that algorithmic and HFT activities enhance liquidity without introducing instability or manipulation.
8. Benefits of Algorithmic and HFT in Indian Markets
Algorithmic and high-frequency trading have brought several benefits to the Indian financial ecosystem:
Increased Market Liquidity: Continuous order flow ensures tighter bid-ask spreads and efficient execution.
Improved Price Discovery: Algorithms react quickly to new information, making prices more reflective of true value.
Reduced Transaction Costs: Automated execution minimizes human errors and slippage.
Enhanced Market Efficiency: Rapid arbitrage eliminates temporary price discrepancies.
Accessibility for Retail Traders: With new APIs and algo platforms, small traders can deploy systematic strategies.
9. Challenges and Criticisms
Despite its advantages, algo and HFT trading come with significant challenges:
Market Fairness: HFT firms with superior technology can gain an unfair advantage over smaller participants.
Flash Crashes: Erroneous algorithms or feedback loops can cause sudden market volatility.
Systemic Risks: High interconnectivity among automated systems may amplify shocks.
Regulatory Complexity: Constant innovation in trading algorithms challenges regulators to keep up.
Infrastructure Costs: Access to co-location and high-speed data remains expensive, creating barriers for smaller firms.
10. Future Outlook of Algo and HFT Trading in India
The future of algorithmic and HFT trading in India is poised for robust growth, driven by advancements in AI, machine learning, and big data analytics.
Key emerging trends include:
AI-driven Predictive Models: Algorithms capable of learning from historical and real-time data to make adaptive trading decisions.
Blockchain Integration: Transparent and secure transaction systems reducing latency and settlement risk.
API Democratization: Greater access for retail traders through open APIs and low-cost algo platforms.
Smart Regulation: SEBI’s proactive stance on monitoring algorithmic activity while encouraging innovation.
Cross-Asset Automation: Expansion of algorithms to currencies, commodities, and fixed-income markets.
With India’s rapidly digitalizing financial ecosystem and growing participation from domestic and global investors, algorithmic and HFT trading will continue to play a pivotal role in shaping the country’s capital markets.
Conclusion
Algorithmic and High-Frequency Trading represent the cutting edge of financial market evolution in India. They have transformed the landscape of stock trading from human-driven judgment to machine-driven precision and speed. While challenges related to fairness, systemic risk, and infrastructure persist, regulatory oversight by SEBI and technological innovation continue to balance growth with stability.
As India’s markets mature, algorithmic and HFT trading will not only enhance liquidity and efficiency but also position the country as a leading global hub for financial technology innovation—marking a new era of smart, data-driven, and automated trading.
AI and Machine Learning in Stock Market Forecasting1. Introduction to AI and Machine Learning in Finance
Artificial Intelligence refers to the simulation of human intelligence in machines that can learn, reason, and make decisions. Machine Learning, a subset of AI, involves algorithms that improve automatically through experience. In finance, AI and ML are used to analyze market data, forecast trends, and automate trading strategies.
Unlike traditional statistical models that rely on fixed mathematical relationships, ML models adapt dynamically to changing market conditions. This adaptability makes them particularly useful in forecasting stock prices, where patterns are non-linear, complex, and influenced by multiple interacting variables.
2. Traditional Methods vs. AI-Based Forecasting
Traditional stock market forecasting techniques — such as fundamental analysis, technical analysis, and econometric models — depend heavily on historical data and human interpretation. These models often assume linear relationships and static patterns, which may not hold true in volatile markets.
In contrast, AI and ML models can process:
Large volumes of structured and unstructured data
Non-linear dependencies
Real-time information updates
For example, a traditional regression model may struggle to account for sudden market shocks, whereas an ML algorithm can learn from data anomalies and adapt to new market behaviors through continuous learning.
3. Machine Learning Techniques in Stock Market Forecasting
AI-driven forecasting utilizes various ML algorithms, each suited for different kinds of financial predictions:
a. Supervised Learning
Supervised learning algorithms are trained using labeled historical data — for example, past stock prices and associated indicators — to predict future values. Common models include:
Linear and Logistic Regression
Support Vector Machines (SVM)
Random Forests
Gradient Boosting Machines (XGBoost, LightGBM)
These algorithms can forecast future price movements, classify stocks as “buy,” “hold,” or “sell,” and identify potential risks.
b. Unsupervised Learning
In unsupervised learning, algorithms detect hidden patterns in data without labeled outcomes. Techniques like K-Means Clustering and Principal Component Analysis (PCA) are used to:
Identify stock groupings with similar behavior
Detect anomalies or unusual trading activities
Segment markets based on volatility or performance trends
c. Deep Learning
Deep Learning models, particularly Recurrent Neural Networks (RNNs) and Long Short-Term Memory (LSTM) networks, are highly effective in time-series forecasting.
These models capture temporal dependencies — such as how past price movements influence future prices — and are capable of handling sequential data efficiently.
For instance, an LSTM model can analyze years of price history, trading volume, and sentiment data to forecast the next day’s closing price.
d. Reinforcement Learning
Reinforcement Learning (RL) is a powerful AI approach where algorithms learn optimal trading strategies through trial and error. The system receives rewards for profitable trades and penalties for losses, gradually learning to maximize returns.
RL is increasingly used in algorithmic trading systems that make autonomous buy/sell decisions based on real-time market data.
4. Data Sources for AI-Based Forecasting
AI and ML models rely on diverse data sources to generate accurate predictions:
Historical Market Data: Price, volume, volatility, and returns over time.
Fundamental Data: Earnings, balance sheets, and macroeconomic indicators.
Alternative Data: News sentiment, social media trends, Google searches, and even satellite imagery.
Technical Indicators: Moving averages, RSI, MACD, and Bollinger Bands.
By integrating structured (numerical) and unstructured (text, images) data, AI models can capture market sentiment and detect emerging trends that traditional models may overlook.
5. Applications of AI and ML in Stock Forecasting
a. Price Prediction
Machine learning models are used to forecast short-term and long-term price movements. Algorithms such as LSTMs and Random Forests analyze time-series data to predict next-day or next-week stock prices.
b. Sentiment Analysis
Natural Language Processing (NLP), a branch of AI, interprets financial news, analyst reports, and social media content to gauge market sentiment.
For example, a surge in negative news sentiment about a company may signal an upcoming drop in its stock price.
c. Portfolio Optimization
AI systems analyze correlations among different assets and optimize portfolios to maximize returns while minimizing risk. Tools like Markowitz’s modern portfolio theory can be enhanced by machine learning models that adapt dynamically to market volatility.
d. High-Frequency Trading (HFT)
In high-frequency trading, AI algorithms execute thousands of trades per second based on micro-movements in prices. ML models process real-time market data streams and make ultra-fast trading decisions with minimal human intervention.
e. Risk Management and Anomaly Detection
AI systems monitor trading patterns to identify abnormal behavior, potential fraud, or risk exposure. These models help financial institutions comply with regulations and safeguard investor assets.
6. Benefits of AI and ML in Forecasting
Accuracy and Efficiency: AI models can analyze vast datasets quickly and produce precise forecasts.
Adaptability: They adjust to evolving market dynamics without manual recalibration.
Automation: Reduces human error and enables algorithmic trading.
Sentiment Integration: Incorporates behavioral and psychological aspects of markets.
Continuous Learning: Models improve over time as they process more data.
AI thus empowers traders, analysts, and institutions to make data-driven decisions and respond rapidly to market changes.
7. Challenges and Limitations
Despite their promise, AI and ML in stock forecasting face certain limitations:
Data Quality Issues: Inaccurate or biased data can mislead models.
Overfitting: ML models may perform well on training data but fail in real-world scenarios.
Black-Box Nature: Many AI models lack transparency in how they generate predictions, posing trust issues.
Market Unpredictability: Events like political crises, pandemics, or natural disasters can disrupt models trained on historical data.
Ethical and Regulatory Concerns: Use of AI-driven trading can lead to market manipulation or flash crashes if not monitored.
Hence, human oversight remains essential even in AI-based systems.
8. Future of AI and ML in Financial Forecasting
The future of AI in finance lies in hybrid models — combining human expertise with machine intelligence. Emerging technologies such as Quantum Computing, Explainable AI (XAI), and Federated Learning will further enhance forecasting capabilities.
Moreover, integration of blockchain data, real-time global sentiment, and predictive analytics will make AI-driven models more robust and transparent.
In the coming years, AI systems are expected to play a central role not just in forecasting but also in risk management, compliance automation, and personalized investment advice through robo-advisors.
9. Conclusion
AI and Machine Learning have transformed the way investors, institutions, and analysts approach the stock market. From pattern recognition and sentiment analysis to autonomous trading and portfolio optimization, these technologies offer powerful tools for understanding and predicting market behavior.
While challenges such as data quality, overfitting, and transparency remain, continuous advancements in AI research promise more reliable and interpretable forecasting systems. Ultimately, the combination of human insight and AI-driven analytics represents the future of intelligent investing — where data, algorithms, and human judgment work hand in hand to navigate the ever-changing financial markets.

Sobha (W): Bullish, Breakout ConfirmationThe stock has decisively broken a 17-month angular downtrend line, signaling a major change in character. The underlying momentum on higher timeframes (Weekly & Monthly) is strong, suggesting this is the start of a new bullish leg.
📈 1. The Long-Term Context
- The 2024 Peak: After hitting its All-Time High (ATH) in June 2024 , the stock entered a prolonged 10-month correction.
- The 2025 Bottom: This downtrend found its bottom in April 2025 , and the stock has been in a reversal/recovery phase since.
- The Resistance: This recovery was consistently blocked by a strong, angular resistance trendline formed from the June 2024 ATH.
🚀 2. The Decisive Breakout (This Week's Action)
This week, the 17-month pattern was broken:
- The Move: The stock decisively broke out and closed above this long-term angular resistance trendline for the first time.
- The Surge: This breakout was confirmed with a +5.10% surge for the week, backed by 1.2 Million in total weekly volume.
- Volume Context: This breakout comes after a period of low, consolidating volume, which often precedes a significant move.
📊 3. Key Technical Indicators
The underlying momentum on higher timeframes strongly supports this breakout:
- EMAs: Short-term Exponential Moving Averages are in a "PCO" (Price Crossover) state on both the Monthly and Weekly charts, confirming a bullish trend.
- RSI: The Relative Strength Index is rising on both the Monthly and Weekly timeframes, showing that buying strength is building and sustaining.
🎯 4. Future Scenarios & Key Levels to Watch
This breakout provides a clear road map based on identified levels:
🐂 The Bullish Case (Momentum Continues)
- Trigger: If the current momentum is maintained, the breakout is confirmed.
- Target: The first major target is the ₹2,060 level, which represents the next significant resistance zone near the 2024 highs.
🐻 The Bearish Case (Re-test Scenario)
- Trigger: The initial momentum is lost, and the stock pulls back to verify the breakout.
- Confirmation: A "re-test" where the stock drops to touch the old resistance trendline, which should now act as new support.
- Support: This re-test level is at approximately ₹1,620 . A bounce from this level would be a secondary, high-conviction buy signal.

BUY TODAY SELL TOMORROW for 5%DON’T HAVE TIME TO MANAGE YOUR TRADES?
- Take BTST trades at 3:25 pm every day
- Try to exit by taking 4-7% profit of each trade
- SL can also be maintained as closing below the low of the breakout candle
Now, why do I prefer BTST over swing trades? The primary reason is that I have observed that 90% of the stocks give most of the movement in just 1-2 days and the rest of the time they either consolidate or fall
Trendline Breakout in BUTTERFLY
BUY TODAY SELL TOMORROW for 5%

Part 4 Learn Institutional TradingAdvantages of Option Trading
Leverage:
Options allow control over large quantities of an asset with a small investment (premium). This magnifies potential profits.
Limited Risk for Buyers:
When buying options, the maximum loss is limited to the premium paid.
Hedging Capability:
Options can offset potential losses in the underlying portfolio.
Flexibility:
Options can be combined in various strategies to suit market outlooks—bullish, bearish, or neutral.
Multiple Strategies:
Options offer numerous strategies like straddles, strangles, spreads, collars, and iron condors, giving traders the ability to profit in different market conditions.

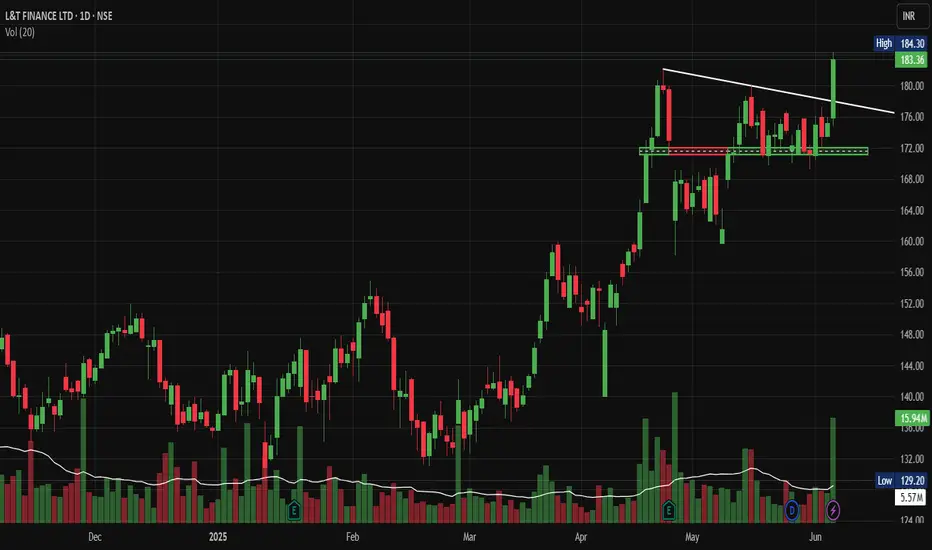
LTF Breaking Out of Consolidation and ascending triangleNSE:LTF : Breaking Out of Consolidation and ascending triangle with heavy volumes today - Is This the Next Big NBFC Move?
Price Action Analysis:
• Base Formation: Clear sideways movement between ₹160-172 levels
• Breakout Confirmation: Recent breach above ₹172 resistance with volume expansion
• Trendline Break: White descending trendline from December highs decisively broken
• Market Structure: Shift from the consolidation phase to the potential trend resumption
• Time Frame: A six-month base provides a strong foundation for sustained movement
Volume Analysis:
• Current Volume: 5.57M against 20-day average of 15.94M
• Volume Pattern: Accumulation visible during the base formation period
• Support Tests: Volume spikes coinciding with successful ₹160-164 support tests
• Breakout Volume: Adequate but not exceptional - requires monitoring for follow-through
• Distribution Signs: No significant selling pressure visible during consolidation
Key Support & Resistance Levels:
Support Levels:
• Immediate Support: ₹172 (new floor post-breakout)
• Secondary Support: ₹168 (previous resistance turned support)
• Major Support: ₹160-164 (primary consolidation base)
• Critical Support: ₹155 (breakdown level)
Resistance Levels:
• Immediate Resistance: ₹190-195 (measured move target)
• Next Resistance: ₹205-210 (psychological and technical zone)
• Long-term Target: ₹220-225 (extension target)
Trade Setup:
Entry Strategy:
• Aggressive Entry: Current levels ₹183-184 for momentum traders
• Conservative Entry: ₹175-177 on pullback to breakout zone
• DCA Approach: Scale in between ₹175-185 levels
Exit Strategy:
• Target 1: ₹192 (measured move from rectangle pattern)
• Target 2: ₹205-210 (next significant resistance)
• Target 3: ₹220+ (extension target for long-term holders)
Stop Loss:
• Closing Basis: Below ₹170
• Intraday Basis: Below ₹168
• Risk Percentage: 7-8% from current levels
Position Sizing & Risk Management:
Position Sizing:
• Conservative: 1% portfolio risk
• Moderate: 1.5% portfolio risk
• Aggressive: 2% portfolio risk (maximum recommended)
Risk Management:
• Stop Loss Discipline: Strict adherence to ₹170 closing stop
• Position Scaling: Reduce position if breaks ₹175 intraday
• Profit Booking: Book 30% at ₹192, 40% at ₹205
• Trailing Stop: Implement above ₹195 levels
Sectoral Backdrop:
NBFC Sector Positives:
• Credit Growth: NBFC credit growth outpacing bank credit
• Market Share: Gaining share in retail and SME segments
• Asset Quality: Improving collection efficiency post-COVID
• Regulatory Support: Favourable policy environment
Sector Trends:
• Digital Lending: Increased adoption of technology platforms
• Rural Focus: Growing emphasis on semi-urban and rural markets
• Partnership Models: Collaborations with fintech companies
Fundamental Backdrop:
Company Strengths:
• Group Support: Strong L&T Group parentage and backing
• Diversified Portfolio: Exposure across infrastructure and retail segments
• Quality Borrowers: Access to L&T Group ecosystem clients
• Management Quality: Experienced leadership team
Recent Developments:
• Asset Quality: Improving NPA ratios
• Profitability: Better margins and ROE metrics
• Growth Strategy: Focus on profitable growth segments
Risk Factors:
Technical Risks:
• False Breakout: Possibility of returning to the consolidation range
• Volume Confirmation: Need for sustained volume support
• Market Correlation: High beta to financial sector performance
Fundamental Risks:
• Interest Rate Risk: Rising rates impacting lending margins
• Credit Quality: Potential stress in the retail lending portfolio
• Economic Slowdown: Impact on borrower repayment capacity
• Regulatory Changes: Policy shifts affecting NBFC operations
Market Risks:
• Sector Rotation: Money moving away from financial stocks
• Liquidity Concerns: Tightening of wholesale funding markets
• Competition: Increased competition from banks and fintech
My Take:
The technical setup suggests accumulation phase completion with potential for a significant move higher. Follow the Strict Trade Plan as Explained Above.
Keep in the Watchlist.
NO RECO. For Buy/Sell.
📌Thank you for exploring my idea! I hope you found it valuable.
🙏FOLLOW for more
👍BOOST if you found it useful.
✍️COMMENT below with your views.
Meanwhile, check out my other stock ideas on the right side until this trade is activated. I would love your feedback.
Disclaimer: "I am not a SEBI REGISTERED RESEARCH ANALYST AND INVESTMENT ADVISER."
This analysis is intended solely for informational and educational purposes and should not be interpreted as financial advice. It is advisable to consult a qualified financial advisor or conduct thorough research before making investment decisions.
Part 2 Ride The Big Moves How Option Prices Are Determined
Option prices are influenced by several factors. The most common model used to calculate the theoretical value of an option is the Black-Scholes Model. The key factors that affect option prices include:
Underlying Asset Price: The higher the price of the asset, the higher the value of a call option and the lower the value of a put option.
Strike Price: The difference between the strike and current market price affects the intrinsic value of the option.
Time to Expiration: The more time left until expiration, the higher the premium (because there’s more time for the option to become profitable).
Volatility: Higher volatility increases option premiums since the chance of large price movement rises.
Interest Rates and Dividends: These can slightly influence option values, especially for longer-term options.

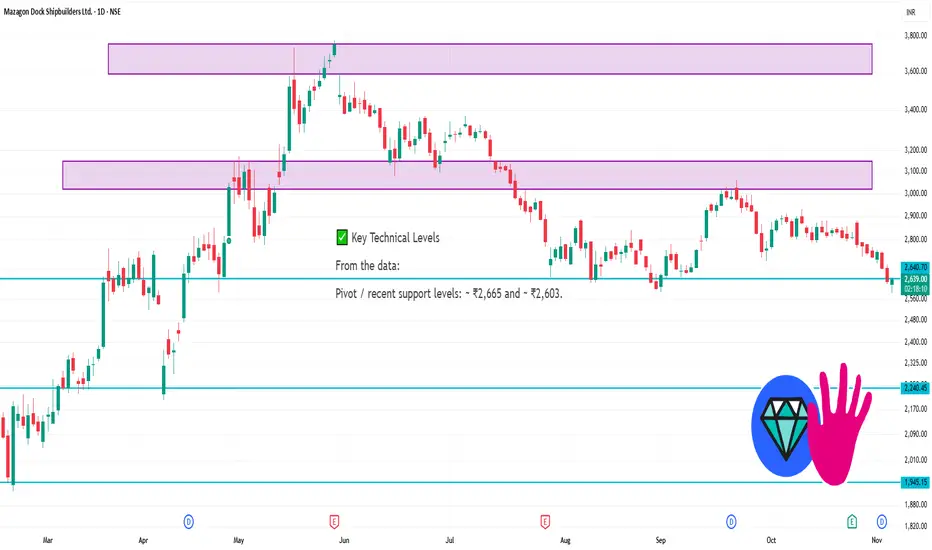
MAZDOCK 1 Day Time Frame ✅ Key Technical Levels
From the data:
Pivot / recent support levels: ~ ₹2,665 and ~ ₹2,603.
Resistance levels: ~ ₹2,837.6 (short term) and ~ ₹3,121.9.
Moving averages: The price (~ ₹2,729) is below the 20‑day / 50‑day / 100‑day MAs.
Technical indicators: RSI ~ 37.6 (low/neutral), MACD negative, trend strength weak (ADX ~11).
Part 1 Ride The Big Moves How Option Trading Works
Option trading involves four basic positions:
Buy Call (Long Call): The trader expects the underlying asset’s price to rise.
Sell Call (Short Call): The trader expects the price to stay the same or fall.
Buy Put (Long Put): The trader expects the underlying asset’s price to fall.
Sell Put (Short Put): The trader expects the price to stay the same or rise.
For example, if a trader buys a call option on a stock with a strike price of ₹100 and pays a premium of ₹5, they have the right to buy the stock at ₹100 even if it rises to ₹120. In this case, their profit per share would be ₹15 (₹120 - ₹100 - ₹5). However, if the stock remains below ₹100, they would not exercise the option and would lose only the premium of ₹5.

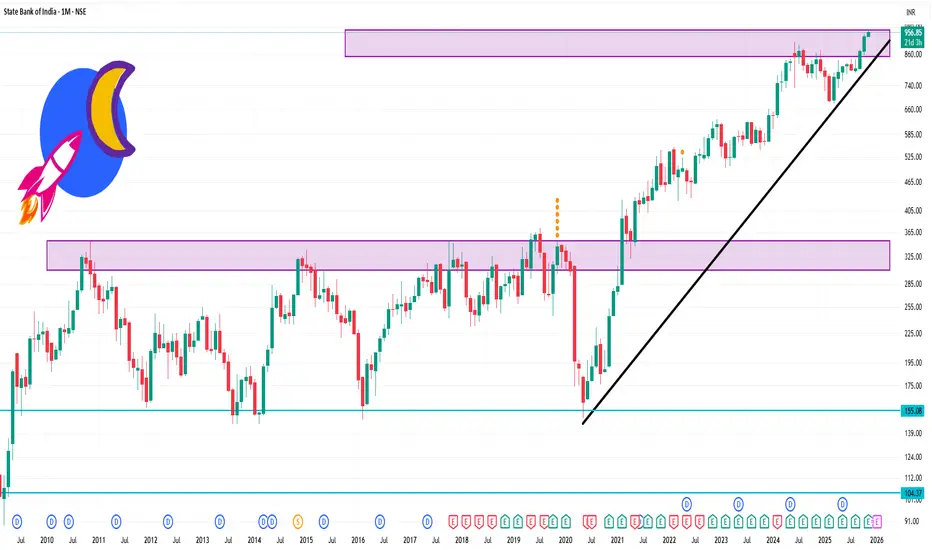
SBIN 1 Month Time Frame Level🔍 Key Levels for 1‑Month Timeframe
Support Zones
Around ₹ 946‑953: Daily pivot/resistance turned support zone.
Next support near ₹ 935‑943: If the price drops below the first zone, this becomes the next demand area.
Broader support around ₹ 900‑910: From longer‑term moving averages and structural support. (MA200 ~₹ 896 per indicator).
Resistance / Upside Zones
Immediate resistance around ₹ 969‑972: Close to the 52‑week high and recent highs.
If momentum carries, potential extension to ₹ 1000+ zone. Some fib‑/pivot‑based projections suggest ~₹ 1003.
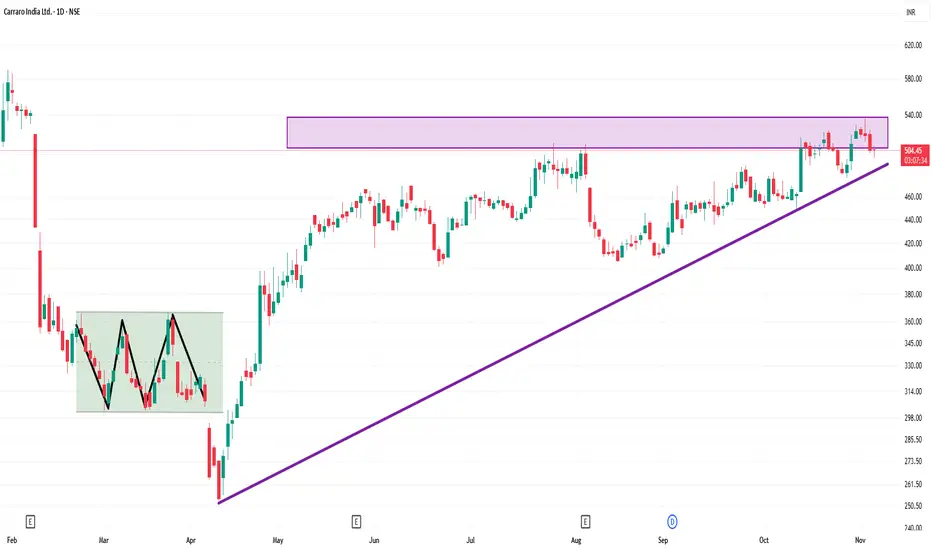
CARRARO 1 Day Time Frame 📍 Key Levels
Resistance ~ ₹523.45 (short term)
Support ~ ₹482.70
Moving averages: 50-day ~ ₹503.79; 200-day ~ ₹484.68
Current price (recent) ~ ₹518.75
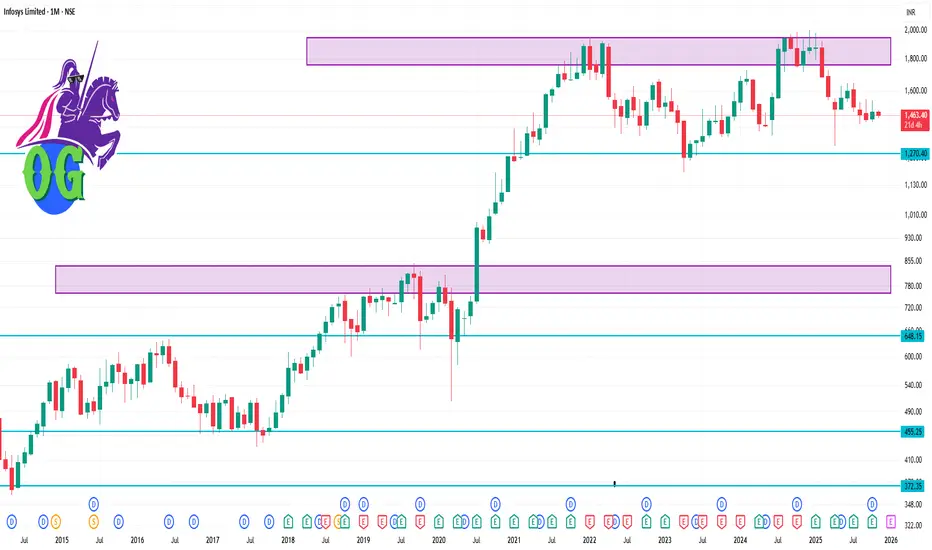
INFY 1 Month Time Frame 📊 Current status
Latest quoted price is around ₹1,466.70.
Technical indicators (daily & monthly) show a bearish bias. On daily, moving averages all give “Sell”.
From chart commentary: Intermediate resistance visible at ~ ₹1,479–₹1,523. Support stated around ~ ₹1,425–₹1,385, and a stronger support zone near ~ ₹1,348 in a deeper break scenario.
🎯 Key levels for the 1-month horizon
Resistance zone: ~ ₹1,479 up to ~ ₹1,523 — clearing this zone would be a positive signal. (see analysis above)
Support zone / trigger zone:
Initial support: ~ ₹1,425–₹1,385.
Deeper support (if breakdown): ~ ₹1,348.
Important pivot region: The current price around ~ ₹1,466–₹1,470 sits between support and resistance — watching whether it breaks down or starts a reversal.
Part 2 Support and Reistance Key Terminology in Option Trading
Before diving deeper, it’s important to understand the essential terms used in option trading:
Strike Price: The fixed price at which the holder can buy (call) or sell (put) the underlying asset.
Premium: The price paid by the option buyer to the seller for the contract.
Expiration Date: The date on which the option contract expires. After this date, the option becomes worthless if not exercised.
In-the-Money (ITM): A call option is ITM when the underlying price is above the strike price; a put option is ITM when the underlying price is below the strike price.
Out-of-the-Money (OTM): A call option is OTM when the underlying price is below the strike price; a put option is OTM when the underlying price is above the strike price.
At-the-Money (ATM): When the underlying asset price equals the strike price.
Underlying Asset: The financial instrument (stock, index, currency, or commodity) on which the option is based.

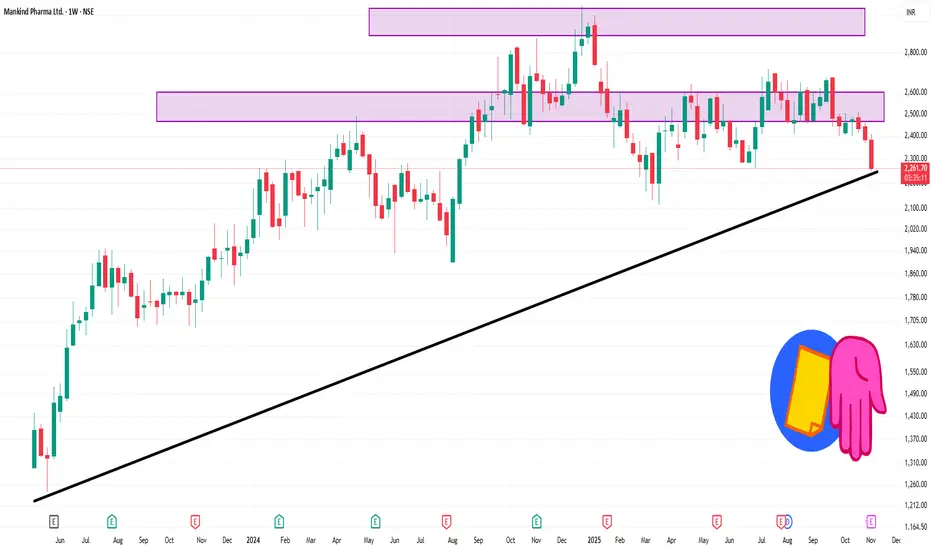
MANKIND 1 Week Time Frame 📌 Key Levels (Weekly Framework)
Support zone: ~ ₹2,287 (a strong weekly support identified)
Next lower support: ~ ₹2,201 (in case of breakdown below primary support)
Resistance zone: ~ ₹2,518 (first major weekly resistance)
Higher resistance area: ~ ₹2,696 to ₹2,937 in a medium‐term context.
🔍 Weekly Outlook & Notes
If price remains above ~₹2,287 and starts building volume/structure, there is upside potential toward ~₹2,518.
If the price breaks below ~₹2,287 decisively on the weekly chart, then watch for further drop toward ~₹2,201.
RADICO 1 Month Time Frame 📌 Current data snapshot
Latest price ~ ₹ 3,220.
52-week range: ~ ₹ 1,845.50 – ₹ 3,423.00.
Technical rating (1-month) on platforms shows “Buy” / “Strong Buy”.
🔍 Key support & resistance for ~1-month horizon
Support zone: ~ ₹ 3,050-3,100 — around current price minus some buffer.
Stronger support: ~ ₹ 2,900-3,000 — if the above zone fails.
Resistance zone: ~ ₹ 3,300-3,350 — near recent highs.
Possible breakout target: > ~ ₹ 3,400 — if it breaks resistance convincingly.
These levels are derived from recent chart data and pivot-analysis (for example, support ~₹3,052.5 seen on one chart).

Part 1 Support and Resistance What Are Options?
An option is a financial contract between two parties: the buyer (also called the holder) and the seller (also called the writer). The buyer pays a premium to the seller in exchange for the right to buy or sell the underlying asset at a specified strike price before or on a specified expiration date.
There are two main types of options:
Call Option – gives the buyer the right to buy the underlying asset at the strike price.
Put Option – gives the buyer the right to sell the underlying asset at the strike price.

The Future of High-Frequency Trading (HFT)Speed, Strategy, and the Next Market Revolution
High-Frequency Trading (HFT) has revolutionized global financial markets over the past two decades. What began as an innovation in trading efficiency has evolved into a highly sophisticated ecosystem where algorithms compete for nanosecond advantages. As technology continues to advance and regulations adapt, the future of HFT stands at the crossroads of artificial intelligence, quantum computing, and evolving market structures. This article explores the future of HFT—its direction, challenges, and the forces shaping its next phase.
1. The Evolution of HFT: From Speed to Intelligence
In its early days, HFT was primarily about speed—executing orders faster than anyone else. Firms invested heavily in low-latency networks, co-location services, and custom hardware to shave off microseconds. Those who executed trades even a fraction of a second faster could exploit small price inefficiencies for massive cumulative profits.
However, as markets became saturated with HFT players and infrastructure speeds reached physical limits (the speed of light), the competitive edge began shifting from raw speed to strategic intelligence. Now, success in HFT increasingly depends on smarter algorithms, superior data analysis, and predictive modeling rather than just faster cables.
The next era of HFT will thus be defined not by who is faster, but by who is smarter.
2. The Role of Artificial Intelligence and Machine Learning
Artificial Intelligence (AI) and Machine Learning (ML) are transforming the way HFT strategies are designed and executed. Traditional HFT algorithms rely on rule-based systems—predefined triggers for buying or selling. But AI-driven systems can analyze complex market data, detect evolving patterns, and make autonomous trading decisions in real time.
AI enables “adaptive trading”—algorithms that learn from past trades, market conditions, and competitor behavior to continuously optimize performance. For instance:
Reinforcement learning models can test millions of trading strategies in simulated markets and refine them dynamically.
Neural networks can detect hidden correlations between assets or anticipate volatility spikes.
Natural Language Processing (NLP) can analyze news headlines, social media, and even central bank statements for sentiment signals.
The future of HFT will likely integrate AI into every layer—from signal generation to order execution—creating a new class of self-evolving trading machines.
3. Quantum Computing: The Next Speed Frontier
While AI adds intelligence to HFT, quantum computing may reintroduce a new frontier of speed. Quantum computers have the potential to process vast datasets and run complex probabilistic models exponentially faster than classical computers.
For HFT, this means:
Faster optimization of multi-variable trading strategies.
Instant analysis of correlations across thousands of assets.
Enhanced encryption-breaking capabilities—posing new security challenges for exchanges.
Although quantum technology is still in early stages, firms like IBM, Google, and major hedge funds are already exploring quantum algorithms for portfolio optimization and risk modeling. Within the next decade, early adopters could gain an edge similar to what early HFT pioneers had in the 2000s.
4. Regulation and Ethical Challenges
The rise of HFT has sparked concerns about market fairness and systemic risk. Critics argue that HFT firms gain unfair advantages, manipulate prices, and contribute to flash crashes—sudden market collapses triggered by algorithmic errors or feedback loops.
In response, regulators worldwide are tightening oversight:
Europe’s MiFID II imposes stricter reporting and transparency rules for algorithmic trading.
The U.S. SEC has increased surveillance on market manipulation techniques like “spoofing” and “quote stuffing.”
India’s SEBI has introduced frameworks for algorithmic trading access, ensuring level playing fields.
Going forward, regulation will likely focus on algorithmic accountability—requiring firms to demonstrate that their trading systems are safe, transparent, and auditable. Ethical AI design will become a competitive necessity, as firms must balance profit with stability and fairness.
5. The Expansion of Alternative Markets
Another major trend shaping HFT’s future is the rise of alternative trading systems (ATS) and dark pools. These off-exchange venues allow large institutions to trade with less visibility, reducing market impact. HFT firms are increasingly participating in these environments, providing liquidity and executing arbitrage between public and private markets.
Additionally, the growing ecosystem of cryptocurrency and digital assets has opened a new frontier for high-frequency traders. Crypto exchanges operate 24/7, offering higher volatility and fewer regulatory constraints—ideal conditions for algorithmic strategies. Firms now deploy HFT systems in Bitcoin, Ethereum, and DeFi markets using similar latency-sensitive techniques as in equities or forex.
As tokenized assets and blockchain-based exchanges mature, HFT will play a central role in ensuring liquidity and price efficiency across decentralized markets.
6. Data is the New Edge
In modern HFT, access to superior data often determines success. The future of trading will revolve around alternative data—non-traditional sources such as satellite imagery, shipping data, social media sentiment, and even IoT sensors.
For example:
Monitoring car counts in retail parking lots to estimate sales.
Tracking weather patterns to predict commodity price movements.
Using real-time shipping data to forecast global supply trends.
Combining alternative data with AI allows traders to predict market movements before they appear on traditional indicators. In the coming years, the firms that master data fusion—the integration of structured and unstructured data—will dominate the HFT landscape.
7. Infrastructure Innovation: From Edge Computing to 5G
As markets globalize, latency reduction extends beyond fiber optics. Future HFT infrastructures will likely leverage edge computing, 5G connectivity, and satellite-based communication systems to push execution times closer to real-time.
Edge computing allows algorithms to run geographically closer to data sources—whether stock exchanges or crypto nodes—minimizing transmission delays. Similarly, 5G networks offer sub-millisecond latency and high reliability, unlocking new opportunities for algorithmic trading in mobile and IoT-enabled environments.
Such infrastructure advancements will also democratize HFT, allowing smaller firms to compete without massive investments in traditional data centers.
8. Human Traders in an Algorithmic World
As algorithms dominate, what happens to human traders? While automation has replaced much of manual execution, humans remain critical in designing, supervising, and ethically guiding trading systems.
In the future, human expertise will shift from execution to oversight and creativity:
Developing novel trading logic and hybrid strategies.
Overseeing risk management systems.
Ensuring compliance with regulatory and ethical standards.
The most successful firms will be those that combine human intuition with machine precision—a symbiosis rather than competition.
9. Challenges Ahead: Risk, Saturation, and Market Fragmentation
Despite its advantages, the HFT ecosystem faces significant challenges:
Market Saturation: With thousands of algorithms competing, profit margins per trade are shrinking.
Systemic Risk: Complex inter-algorithm interactions can amplify volatility, as seen during flash crashes.
Cybersecurity Threats: As trading systems become more connected, they also become more vulnerable to hacking and data breaches.
Future resilience will depend on developing robust, self-correcting systems capable of detecting and neutralizing unintended market feedback loops in real time.
10. The Road Ahead: A Smarter, Faster, Fairer Market
The future of HFT lies not in unrestrained speed but in intelligent automation, ethical oversight, and technological balance. As AI and quantum computing push the boundaries of possibility, the financial ecosystem must ensure that innovation does not compromise stability.
Regulators, exchanges, and traders will need to collaborate to create a framework where automation enhances efficiency while maintaining transparency and fairness.
In short, the next generation of high-frequency trading will be:
Smarter — driven by AI and predictive analytics.
Faster — with quantum and edge technologies.
Safer — through regulation, ethics, and human oversight.
The story of HFT is far from over—it’s merely entering its next, most intelligent chapter.

Understanding How Options Work: Calls and Puts Simplified1. What Are Options?
An option is a type of financial contract that gives the buyer the right, but not the obligation, to buy or sell an underlying asset (like a stock, index, or commodity) at a predetermined price (called the strike price) before or on a specific date (called the expiration date).
Think of options as insurance contracts — they allow you to protect, speculate, or leverage your positions in the market.
The buyer of the option pays a premium (price of the option).
The seller (also called the writer) receives this premium and is obligated to fulfill the contract if the buyer decides to exercise it.
There are two types of options:
Call Option – the right to buy an asset.
Put Option – the right to sell an asset.
2. Call Options Explained (The Right to Buy)
A call option gives the buyer the right to buy an underlying asset at the strike price within a certain period.
Let’s take an example:
Suppose Stock A is trading at ₹100. You buy a call option with a strike price of ₹105 for a premium of ₹3, expiring in one month.
This means:
You pay ₹3 per share for the right to buy Stock A at ₹105 any time before expiry.
If the stock price rises above ₹105, your option gains value because you can buy at ₹105 while the market price is higher.
Scenario 1: Stock goes up to ₹115 before expiry.
You can buy at ₹105 and immediately sell at ₹115 — making a profit of ₹10.
Your net profit = ₹10 (gain) - ₹3 (premium) = ₹7 per share.
Scenario 2: Stock stays below ₹105.
Your option is out of the money (no advantage in exercising it).
You lose only the premium paid (₹3).
So, a call option benefits from rising prices.
3. Put Options Explained (The Right to Sell)
A put option gives the buyer the right to sell an underlying asset at the strike price within a certain period.
Example:
Stock B is trading at ₹100. You buy a put option with a strike price of ₹95 for a premium of ₹2.
This means you have the right to sell Stock B at ₹95 even if the price falls.
Scenario 1: Stock falls to ₹85 before expiry.
You can sell at ₹95 while the market price is ₹85 — gaining ₹10.
Your net profit = ₹10 (gain) - ₹2 (premium) = ₹8 per share.
Scenario 2: Stock stays above ₹95.
You wouldn’t exercise your right to sell at ₹95 when the market offers ₹100.
You lose only the premium (₹2).
So, a put option benefits from falling prices.
4. Understanding Option Premiums
The premium is the price of the option, and it consists of two parts:
Intrinsic Value:
The amount by which an option is in the money.
For a call: Intrinsic Value = Current Price - Strike Price
For a put: Intrinsic Value = Strike Price - Current Price
Time Value:
Extra value because there’s still time left before expiration.
The longer the time to expiry, the higher the premium.
Example: If a call option on Stock A (price ₹110) has a strike of ₹100, it’s already ₹10 in the money. If the premium is ₹12, then ₹10 is intrinsic value and ₹2 is time value.
5. How Option Sellers Make Money
While buyers pay the premium and hope the market moves in their favor, option sellers profit if the market doesn’t move much.
Call Seller (Writer): Hopes the price stays below the strike price.
Put Seller (Writer): Hopes the price stays above the strike price.
If the option expires worthless, the seller keeps the entire premium. However, sellers face unlimited potential losses if the market moves sharply against them — which is why writing options requires higher margin and risk management.
6. Why Traders Use Options
Options are powerful because they offer multiple strategic uses:
a. Hedging (Protection)
Investors use options to protect existing positions.
Example: If you own a stock at ₹100 and fear a short-term decline, you can buy a put option at ₹95. If the stock falls, your put gains, offsetting the loss.
b. Speculation
Traders buy calls if they expect prices to rise or puts if they expect prices to fall. Because options cost less than the actual stock, they allow for higher leverage — magnifying potential returns.
c. Income Generation
Experienced traders sell (write) options to earn premiums, especially in sideways markets. Covered call writing and cash-secured puts are popular income strategies.
7. Option Moneyness: In, At, and Out of the Money
Understanding an option’s moneyness helps evaluate its worth.
In the Money (ITM): Already profitable if exercised.
Call: Market Price > Strike Price
Put: Market Price < Strike Price
At the Money (ATM): Market Price = Strike Price
Out of the Money (OTM): Not profitable if exercised.
Call: Market Price < Strike Price
Put: Market Price > Strike Price
For example, if a stock trades at ₹100:
₹90 call = ITM
₹100 call = ATM
₹110 call = OTM
8. Expiration and Time Decay (Theta Effect)
Every option has an expiration date — after which it becomes worthless.
As time passes, the time value portion of the premium decreases — this is known as time decay or theta.
Time decay accelerates as the option nears expiry. That’s why buyers usually prefer longer durations (more time value), while sellers prefer shorter ones (faster decay).
9. Risk and Reward Profile
Here’s how the payoff works for each type:
Call Buyer: Unlimited profit (as price rises), limited loss (premium).
Call Seller: Limited profit (premium), unlimited loss (if price soars).
Put Buyer: High profit (as price falls), limited loss (premium).
Put Seller: Limited profit (premium), high loss (if price crashes).
This asymmetry is what makes options both powerful and risky.
10. Real-World Example: A Simplified Scenario
Let’s take a complete example:
You believe Reliance Industries (trading at ₹2500) will rise. You buy a call option with a strike of ₹2550, paying ₹40 premium.
If Reliance rises to ₹2650 → Gain = ₹100 - ₹40 = ₹60 profit.
If Reliance stays below ₹2550 → Option expires worthless → Loss = ₹40.
Alternatively, if you think it will fall, you buy a put option with a strike of ₹2450 for ₹35.
If Reliance drops to ₹2350 → Gain = ₹100 - ₹35 = ₹65 profit.
If it stays above ₹2450 → Option expires worthless → Loss = ₹35.
11. Why Understanding Calls and Puts Matters
Options aren’t just tools for speculation — they’re also essential for managing market exposure and improving portfolio efficiency. Once you understand the behavior of calls and puts, you can combine them into advanced strategies like spreads, straddles, or iron condors — each designed for specific market outlooks.
12. Conclusion: Simplifying the Power of Options
At their core, call and put options are about flexibility. They allow you to control an asset without necessarily owning it, limit your downside while amplifying your upside, and customize your market exposure.
Call = Right to Buy (Bullish tool)
Put = Right to Sell (Bearish tool)
By mastering these basics, you lay the foundation for smarter trading decisions — whether your goal is profit, protection, or passive income. In the world of finance, knowledge of options doesn’t just open doors; it gives you the power to design your own opportunities.