Best Timeframes for Riding Momentum1. Understanding Momentum Across Timeframes
Momentum is not equal on all charts. A stock may show momentum on a 5-minute chart due to a news spike, while the daily chart might show a strong trend reversal building over days or weeks. Therefore, selecting a timeframe is essentially choosing the type of momentum you want to ride:
Short-term momentum (scalping/intraday)
Medium-term momentum (swing trading)
Long-term momentum (positional/trend trading)
The key is to match your risk appetite, capital, and trading frequency with the correct timeframe.
2. Best Timeframes for Intraday Momentum Trading
Intraday momentum traders rely on speed, volume bursts, volatility expansions, and breakouts. These traders prefer timeframes that show quick moves and real-time strength.
(a) 1-Minute Chart (For Aggressive Scalpers)
The 1-minute chart captures the earliest shift in momentum. Traders who use this timeframe look for:
Quick breakouts
Volume surges
Rapid candles indicating imbalance
Small pullbacks in a fast trend
Pros:
Very early entry
Ideal during news events or opening volatility
Cons:
High noise
Requires fast decision-making
Stops can get hit easily
This timeframe suits only experienced, disciplined scalpers.
(b) 5-Minute Chart (Most Popular for Intraday Momentum)
The 5-minute chart is the most widely used for riding intraday momentum because it balances speed with reduced noise.
You can spot:
Breakouts with confirmation
Momentum continuation patterns
Clean trend waves
Strong candles backed by volume
Pros:
Good for capturing 30-minute to 2-hour momentum bursts
Less noise than 1-minute
Ideal for most intraday strategies
Cons:
Might give slightly late signals compared to 1-minute
For 90% of intraday momentum traders, this is the most effective timeframe.
(c) 15-Minute Chart (For Stable Intraday Momentum)
The 15-minute timeframe filters out small fluctuations and highlights more stable trends.
Traders use it to capture:
Structured trend continuation
Breakouts that sustain
Market-wide directional moves (index-based momentum)
Pros:
Cleaner momentum signals
Higher probability of trend continuation
Ideal for traders who don’t want to react to every tick
Cons:
May miss early entries
Momentum moves may already be halfway over
This timeframe is preferred by traders who want moderately fast but reliable moves.
3. Best Timeframes for Swing Momentum Trading
If you want to capture momentum lasting days to weeks, swing timeframes are ideal. Momentum on these charts often aligns with:
Strong fundamental triggers
Trend reversals
Breakouts from long consolidations
Institutional buying/selling
(a) 1-Hour Chart (Great for Short-Term Swings)
The 1-hour (H1) chart helps identify momentum trends that last 1–3 days.
Momentum here is typically caused by:
Overnight sentiment continuation
Market-wide setups
Sector rotations
Breakout retests
Benefits:
Captures multi-day momentum waves
Smoother trends vs. intraday charts
Works well for stocks, forex, crypto, and commodities
This timeframe is a bridge between intraday and swing trading.
(b) 4-Hour Chart (Most Reliable for Multi-Day Moves)
The 4-hour (H4) timeframe is considered one of the most powerful charts for swing momentum trading.
Here, momentum reflects:
Medium-term investor flows
Strong technical patterns
Higher probability breakouts
Why it works so well:
Less noise
Strong price follow-through
Institutional influence becomes visible
Most swing traders rely on H4 + Daily to ride big moves.
(c) Daily Chart (D1) — King of Momentum Trading
The daily chart generates the most reliable momentum signals. Moves generated here can last for:
Weeks
Months
Quarters
Daily momentum is driven by:
Strong fundamentals
Earnings
Policy changes
Market trends
Institutional accumulation or distribution
Pros:
Very high accuracy
Fewer false breakouts
Clear, powerful trends
Cons:
Requires patience
Larger stop-losses
Fewer trades (but higher quality)
If your goal is long-term, stable momentum riding, D1 is the best.
4. Best Timeframes for Positional Trend-Momentum Trading
Longer timeframes show macro momentum, ideal for investors who want to ride multi-month or multi-year trends.
(a) Weekly Chart (W1)
The weekly timeframe captures strong themes such as:
Sector trends
Commodity supercycles
Long-term breakouts
Market phases (bull/bear transitions)
Weekly momentum is extremely powerful because it represents consistent institutional buying across many weeks.
(b) Monthly Chart (MN)
The monthly chart is used for major momentum moves like:
Market cycles
Structural bull markets
Long-term investment themes
Momentum here unfolds slowly, but the moves are massive.
5. Combining Timeframes: The Secret to Riding Momentum Safely
The best traders use multi-timeframe analysis:
High timeframe = Trend direction
Lower timeframe = Entry timing
Example:
Daily chart → shows strong bullish trend
4-hour chart → shows breakout or pullback
15-minute chart → provides perfect entry
This lets you:
Avoid false signals
Trade in the direction of major forces
Enter with precision
6. Which Timeframe Is Best for YOU?
Your timeframe should match your personality and availability:
Trader Type Best Timeframes
Scalper 1m, 5m
Intraday Momentum Trader 5m, 15m
Swing Trader 1h, 4h, Daily
Positional Momentum Investor Weekly, Monthly
Ask yourself:
Do you want fast gains? → Lower timeframes
Do you want dependable momentum? → Higher timeframes
Do you want fewer but bigger moves? → Daily–Weekly
7. Key Indicators That Work Across All Timeframes
To ride momentum effectively, pair your chosen timeframe with:
RSI (overbought/oversold momentum strength)
MACD (momentum direction & crossover)
Moving Averages (20/50/200 EMA)
Volume (confirm strength)
VWAP (intraday only)
Momentum is strongest when:
Price > 20 & 50 EMA
Volume spike confirms breakout
RSI stays above 60 (bull) or below 40 (bear)
Conclusion
The best timeframe for riding momentum depends on your trading style, but the most reliable ones are:
5m for intraday
1h & 4h for swing
Daily for long-term momentum
Understanding how momentum behaves across timeframes allows you to enter earlier, stay confident in the trend, manage risk better, and maximize profits.
Trend Line Break
E-Commerce Profits in the Trading Market1. The Evolution of E-Commerce in Trading Markets
Traditional trading relied heavily on physical marketplaces, intermediaries, warehousing networks, and region-specific demand. E-commerce broke these boundaries, enabling sellers to trade goods across vast geographies with minimal friction. With digital payments, online marketplaces, automated logistics, and data analytics, the trading market’s profit model fundamentally shifted from limited, location-based selling to scalable, digital-led operations.
Key drivers of this evolution include:
Internet penetration and smartphones making online buying accessible.
Logistics innovation, including hyperlocal delivery, multi-city fulfilment centers, and cross-border shipping.
Digital payments reducing transaction friction.
AI-powered recommendations, improving customer experience and conversion.
These developments made e-commerce not just an extension of traditional trading but a new, dominant trading model.
2. How E-Commerce Generates Profits in the Trading Market
A. High Scalability with Low Marginal Cost
After initial setup—website, inventory, marketplace listings—the cost of reaching additional customers is extremely low. Unlike a physical store, which requires space, staff, and utilities, e-commerce allows businesses to scale nationally and globally without proportionally rising expenses. This creates a unique margin structure where revenue can grow faster than cost, leading to higher profits.
B. Marketplace Fee Model and Commissions
For platforms like Amazon, Flipkart, Alibaba, and Shopify stores, profits are earned through:
Listing fees
Commissions per sale
Fulfilment fees
Advertising fees
Subscription plans
This model creates steady and predictable income for e-commerce giants. Marketplaces profit whether a seller is new or established, creating a robust ecosystem.
C. Data-Driven Pricing and Dynamic Margins
E-commerce thrives on data — demand analysis, consumer behaviour, competitor pricing, time-of-day trends, geo-level demand, and more.
Dynamic pricing allows:
Higher margins during peak demand
Competitive pricing during slow periods
Inventory liquidation at optimal prices
This flexibility increases profitability significantly compared to static, offline pricing.
D. Inventory-Light Models: Dropshipping and D2C
Modern traders use models where inventory risk is low or zero:
Dropshipping: The seller markets the product; the supplier ships it.
D2C (Direct-to-Consumer): Brands bypass distributors and retail chains.
These models minimize working capital needs and reduce financial risks, allowing even small traders to achieve strong profit margins.
E. Cross-Border E-Commerce Trading
Global e-commerce platforms open new profit channels for traders:
Selling high-margin Indian products (handicrafts, Ayurveda, textiles) abroad.
Arbitrage trading between markets where prices differ.
Importing niche products and selling in new markets.
Cross-border trade provides multi-currency revenue, higher margins, and greater market depth.
3. Key Profit Drivers in the E-Commerce Trading Ecosystem
1. Customer Acquisition and Retention
Profits depend heavily on how efficiently a business attracts and retains buyers.
SEO and content marketing bring organic, low-cost traffic.
Paid ads bring fast conversions but require proper budgeting and targeting.
Email and CRM systems generate repeat purchases at low cost.
Repeat customer revenue improves profitability dramatically, as acquisition costs drop over time.
2. Supply Chain and Logistics Optimization
Efficient logistics boost profits by:
Reducing delivery time
Lowering return rates
Optimizing warehousing costs
Improving customer satisfaction
Companies that integrate last-mile delivery or use fulfilment services achieve higher operational efficiency, which strengthens margins.
3. Scale-Based Negotiation Power
Larger sellers or marketplaces achieve higher profits by:
Negotiating lower supplier costs
Reducing per-unit shipping charges
Accessing better credit terms
Getting priority listing and visibility
Scale multiplies profitability through operational leverage.
4. Technology Automation
Automation reduces labor costs, errors, and delays. Profitable traders use:
Inventory management systems
Predictive analytics for demand forecasting
Automated ad campaigns
Chatbots and AI-driven customer support
Workflow automation tools
Tech-driven operations allow small teams to run large e-commerce operations profitably.
5. Brand Building and Customer Trust
Brands earn higher profits than generic sellers due to:
Emotional connection
Repeat sales
Higher pricing power
Positive reviews and trust
D2C brands, in particular, achieve strong margins by owning their narrative, packaging, and product experience.
4. Profit Models in E-Commerce Trading
A. Retail Arbitrage
Buying lower-priced goods and selling higher online. Profit comes from price gaps between markets.
B. Private Label Selling
Sellers source generic products, rebrand them, and sell at premium margins.
C. Wholesale and Bulk Trading
Traders buy in bulk from manufacturers and sell online:
High volume
Low per-unit margins
Stable profits
D. Subscription-Based Sales
Recurring revenue models (memberships, replenishment boxes) provide predictable monthly income.
E. Affiliate Marketing
Not all traders sell products; some earn commissions by promoting others’ products online.
5. Challenges That Affect Profitability
While e-commerce is profitable, several challenges can reduce margins:
1. High Competition and Price Wars
Low entry barriers attract many sellers, which reduces margins.
2. Platform Dependency
Sellers relying heavily on marketplaces face:
Commission increases
Listing restrictions
Algorithm changes
3. Logistics and Return Costs
High return rates in categories like fashion reduce profitability.
4. Advertising Costs
Paid ads can become expensive if not optimized.
5. Inventory Risks
Overstocking or unsold goods impact cash flow and profits.
Despite these challenges, strategic traders navigate them using efficient supply chains, niche products, and technology.
6. The Future of E-Commerce Profits in the Trading Market
The next decade will bring transformative changes:
1. AI-Driven Trading
AI will optimize pricing, demand forecasting, and customer segmentation.
2. Live Commerce
Real-time selling through live video will drive impulse purchases and higher conversions.
3. Hyper-Personalized Shopping
Customized product recommendations will increase average order value and profitability.
4. Sustainable and Green E-Commerce
Consumers increasingly prefer eco-friendly brands, creating high-margin niches.
5. Expansion of Cross-Border Markets
More small traders will sell globally as shipping and compliance improve.
Conclusion
E-commerce has fundamentally reshaped the trading market, turning it into a fast, scalable, data-driven ecosystem where profits come from technology adoption, efficient operations, global reach, and consumer-centric strategies. Whether through private labels, cross-border trading, dropshipping, bulk wholesale, or digital-first branding, e-commerce offers multiple pathways to achieving profitability. As AI, logistics innovation, and digital payments evolve, e-commerce will continue to unlock even greater profit potential in global trading markets.

Part 10 Trade Like InstitutionsStrike Price, Premium, and Expiry
To understand any option, three elements are critical:
(A) Strike Price
The fixed price at which you can buy (call) or sell (put) the asset.
Example:
Nifty at 22,000
Call option strike: 22,200 CE
Put option strike: 21,800 PE
(B) Premium
The cost of buying the option.
Premium reflects what traders believe about future movement, volatility, and time value.
Higher volatility → higher premium.
(C) Expiry
Options have a limited lifespan. In India, index options expire weekly, and stock options expire monthly.
At expiry, out-of-money options lose all value.

Part 9 Trading Master Class With Experts What Are Options?
Options are derivative contracts. This means their value is derived from an underlying asset—such as Nifty, Bank Nifty, stocks like Reliance or TCS, commodities, or currencies.
There are two types of options:
Call Options (CE) – Right to buy at a specific price
Put Options (PE) – Right to sell at a specific price
But remember this key point:
Options give a right, not an obligation.
This is what makes options asymmetric:
Buyers have limited risk and unlimited potential gain.
Sellers (writers) have limited profit but potentially high risk.

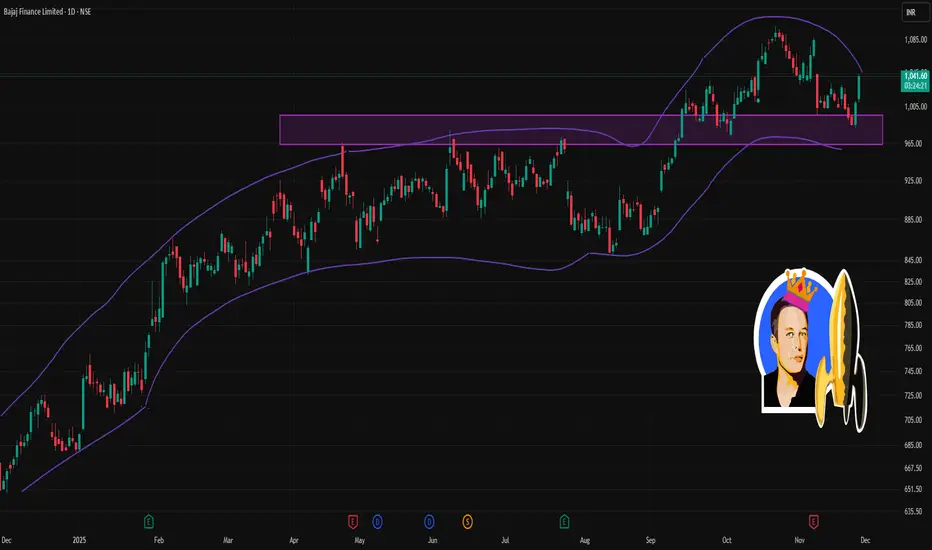
BAJFINANCE 1 Day Time Frame ✅ What we know now (as of latest available data)
1. The latest publicly quoted price for Bajaj Finance is ~ ₹1,042 – ₹1,044.
2. According to a recent report, the stock touched an intraday high of ₹1,042.20.
3. The stock is above its short‑ and long‑term moving averages, which suggests current bullish momentum.
⚠️ Important Notes / Context
These are technical levels derived using standard pivot‑point / support‑resistance calculation methods. They are not guaranteed — markets may overshoot or violently gap.
Always consider fundamentals (company news, sector, broader market sentiment) along with technicals before acting.
Use stop‑loss / risk management because intraday volatility can cause swings beyond these levels.
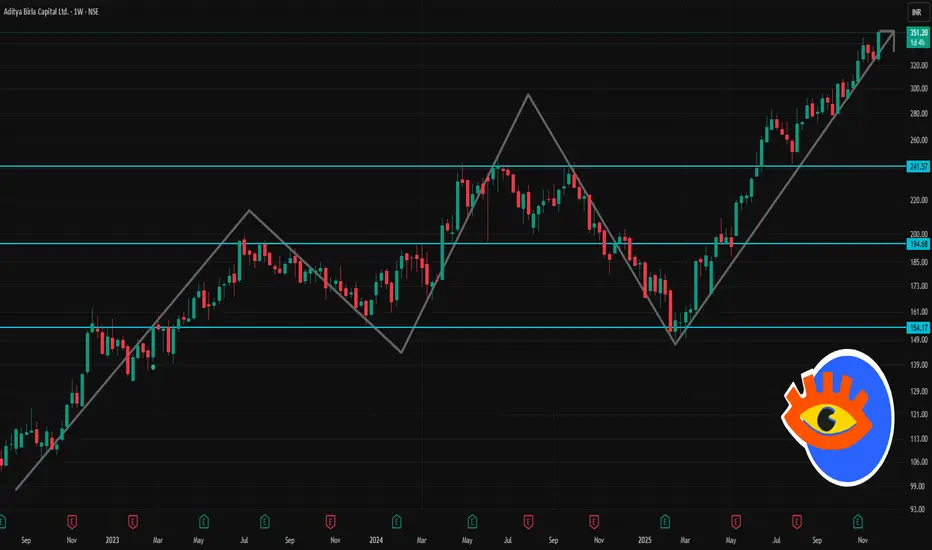
ABCAPITAL 1 Week Time Frame 📊 Key recent data & context
1. The stock recently closed around ₹349.80.
2. Over the past week it has delivered a positive return (roughly +6–7 %).
3. According to a recent technical outlook, immediate support is seen at ≈ ₹320.87, and major support at ≈ ₹316.08. On the upside, immediate resistance is around ≈ ₹333.77, with major resistance at ≈ ₹341.88.
✅ What to Watch — Possible Scenarios
Bullish scenario: If price stays above ~₹333.8 and market sentiment holds up, stock could attempt a move toward ~₹341–342.
Sideways / consolidation: Price may oscillate between ~₹320–₹335 if broader market remains neutral — could be a choppy week.
Bearish scenario: A decisive break below ~₹320.9 (with volume) could drag price toward ~₹316 or lower — a risk point for short‑term holders.
⚠️ Other Technical Notes & Volatility
The stock shows fairly significant volatility: 5‑week range typically ~5.85% for ABCAPITAL.
Broader trend appears positive: moving averages and momentum indicators have been showing strength lately.
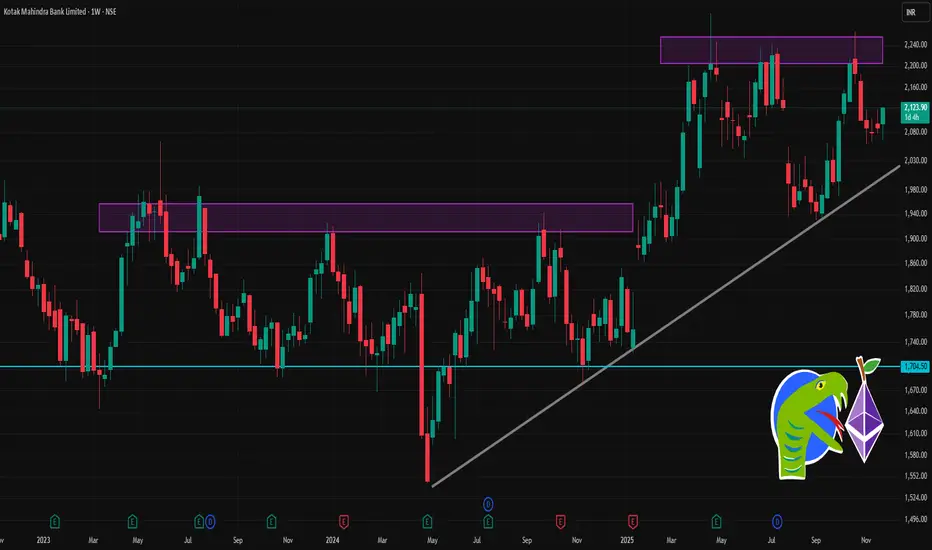
KOTAKBANK 1 Week Time Frame 📊 Key context
1. Current price (as of recent trading) is around ₹2,110–₹2,120.
2. 52‑week high: ~ ₹2,301.90, 52‑week low: ~ ₹1,723.75.
3. The stock recently got a lot of attention due to a corporate action: a 1:5 stock split approved this month — which may increase liquidity and interest among retail investors.
Level Type ₹ Price
Support 1 (S1) ~ ₹2,070.90
Support 2 (S2) ~ ₹2,054.00
Support 3 (S3) ~ ₹2,029.50
Resistance 1 (R1) ~ ₹2,112.30
Resistance 2 (R2) ~ ₹2,136.80
Resistance 3 (R3) ~ ₹2,153.70
Interpretation
On the upside, if the stock moves up past ~₹2,112–2,113, it may test higher resistance around ₹2,135–2,155.
On the downside, if there’s weakness and the price breaks below ~₹2,071, support zones at ~₹2,054 and ~₹2,030 become important — if those give way the next pullback could be deeper.
⚠️ What could alter this outlook
If broader market moves (Nifty/Sensex) are weak — banking stocks like Kotak often follow general market sentiment.
Any news about bank’s financials, regulatory environment, or macroeconomic developments can change investor sentiment quickly.
Post stock‑split, there may be increased volatility — as new investors enter, some profit‑booking can also happen
XAUUSD – H1 uptrend channel, short-term downside risk increasingXAUUSD – H1 uptrend channel, short-term downside risk increasing Brian – Prioritize short selling at the channel peak, wait to buy back at lower support
I. Strategy Summary Gold is trading in an uptrend channel on H1, but the rise around 4.160 shows signs of weakening, increasing short-term correction risk.
Preferred Scenario: Short sell at the channel peak 4.162–4.164, targeting support areas 4.145 – 4.130 – 4.115 – 4.100.
After the correction, the 4.100–4.080 area may become the foundation for the next rise in the larger trend.
Important price areas to watch: 4.139 – 4.127 – 4.110 – 4.088.
II. Macro Context & News 27/11
02:00 – Fed releases Beige Book This document updates the Fed branches' assessment of the US economic situation.
Describing slower growth, cooling price pressures will further reinforce expectations that the Fed will soon cut interest rates → supporting gold.
Conversely, if the Beige Book describes the economy as still “resilient,” the market may temporarily slow down pricing in rate cuts → causing a short-term adjustment for gold.
19:30 – ECB releases October meeting minutes
If the minutes lean towards the scenario of keeping high interest rates longer, the EUR may be supported, indirectly affecting the USD and gold inflows.
However, the impact is usually not as strong as US data, mainly affecting the overall risk-on/risk-off sentiment.
General Context: Gold has surpassed 4.160 USD/oz as the market increasingly expects the Fed to cut interest rates as early as December, reducing the appeal of interest-bearing assets and increasing the allure of gold – a non-yielding asset. This creates a support foundation for the medium-term uptrend, but after a hot rise, technical adjustments on H1 are normal.
III. Technical Structure – H1 uptrend channel
The price is within the H1 uptrend channel, with rising peaks and troughs, but the upper area near 4.160 coincides with:
The upper boundary of the price channel. The “Sell POC” area on the chart – where liquidity and sell orders are concentrated.
Preferred scenario on the chart: The price may slightly rebound to the POC area 4.162–4.164, then be rejected and slide to the important support area around 4.110 before extending the adjustment down to 4.100–4.080.
The lower trendline of the uptrend channel also acts as a short-term buy area if a clear candle reaction appears.
Notable price areas on H1: Resistance: 4.162–4.164 (channel peak + POC). Intermediate support: 4.139 – 4.127 – 4.110. Deep support: 4.088 – 4.080 – 4.100 (area that may form the bottom for the next rise).
IV. Trading Plan 1. Preferred Scenario – Short sell at the channel peak Idea: Short sell when the price rebounds to the upper boundary of the H1 uptrend channel and POC 4.162–4.164, expecting a correction to support.
Sell: 4.162–4.164 SL: 4.168 TP targets: TP1: 4.145 TP2: 4.130 TP3: 4.115 TP4: 4.100
This is a counter-move order in the uptrend channel, only targeting a short-term correction, not a major trend reversal scenario.
2. Supplementary Scenario – Short buy at support trendline Idea: When the price hits the lower trendline of the H1 uptrend channel and a nice candle reaction appears, consider a short-term buy according to the channel, prioritizing areas:
4.139 – 4.127 – 4.110 – 4.088
Specific Entry/SL levels will depend on the actual price reaction at the trendline, but the general principle:
Buy close to the trendline,
SL placed below the immediate support area,
TP aimed at the middle of the channel or the nearest resistance.
V. Risk Management & Notes
Do not open new positions right before or at the time of the Beige Book and ECB minutes release, as volatility may suddenly increase, widening spreads.
The sell order at 4.162–4.164 is a short-term counter-trend order in the uptrend channel, requiring moderate volume and strict adherence to SL 4.168.
If the price clearly breaks and holds above the 4.170 area, the H1 correction scenario weakens – in that case, stay out, wait for a new structure instead of trying to maintain a sell view.

Candle Patterns Practical Trading Tips Using Candle Patterns
Trade only with trend confirmation.
A reversal pattern against a strong trend may fail.
Look for patterns at key levels.
Support, resistance, supply-demand zones enhance accuracy.
Use stop-loss placement wisely.
For example, below the wick of a Hammer or above the wick of a Shooting Star.
Avoid trading every pattern blindly.
Candle patterns tell probabilities, not certainties.
Wait for candle close.
Incomplete candles may give false signals.
Use volume and structure to confirm.
Patterns with volume are more reliable.

Premium Chart Patterns Chart patterns provide clues about what buyers and sellers are doing:
Buyers create demand, pushing prices higher.
Sellers create supply, pushing prices lower.
When these forces interact, certain shapes form on the price chart. These shapes—like triangles, flags, head and shoulders, double tops—help traders forecast the next big move.
Patterns can be classified into two major types:
Reversal Patterns – indicate a possible change in trend.
Continuation Patterns – indicate the existing trend is likely to continue.
Understanding both helps traders catch major market moves with good accuracy.

Ujjivan SFB (D): Strongly Bullish, Testing 5-Year ResistanceThe stock is staging a powerful recovery from its 2025 lows. It is currently challenging a critical "confluence resistance" zone (₹54-₹56) that dates back to Feb 2020. A breakout here would trigger a major structural shift.
📈 1. The Long-Term Context (The "U-Shape" Recovery)
- The Fall: After hitting its All-Time High (ATH) of ₹63 in Dec 2023, the stock entered a steep 15-month correction, losing ~51% of its value by early 2025.
- The Recovery: Since March 2025, the stock has been in a steady uptrend, effectively creating a large "Rounding Bottom" or "Cup" structure.
- The "Lid" (Feb 2020 Resistance): The ₹54 – ₹56 zone is not just a random level; it aligns with the major structural resistance from February 2020 (pre-COVID highs). Breaking this would mean clearing a 5-year hurdle.
🚀 2. The Fundamental Catalyst (The "Why")
The recent bullishness is supported by improving fundamentals, which validates the technical breakout:
- Record Disbursements: In the recent Q2 results, the bank reported its highest-ever quarterly disbursements , signaling strong business growth.
- Asset Quality: Stable asset quality is attracting institutional interest, as seen in the volume spike.
💥 3. Today's Price Action (Nov 26, 2025)
- The Surge: The stock surged +3.84% , closing near the day's high.
- Volume Expansion: The move was backed by massive volume of 30.09 Million shares.
- Volume Trend: This spike comes after a period of declining volume , which is a classic "volatility contraction" setup. The sudden expansion today confirms fresh buyer participation.
📊 4. Technical Indicators
- EMAs: Short-term EMAs are in a PCO (Price Crossover) state across Monthly, Weekly, and Daily timeframes, confirming aligned bullish momentum.
- RSI: The Relative Strength Index is rising across all three timeframes, showing that momentum is accelerating into the breakout.
🎯 5. Future Scenarios & Key Levels
The stock is currently inside the breakout zone.
- 🐂 Bullish Case (Breakout):
- Trigger: A decisive weekly close above ₹56 .
- Target: The primary target is a retest of the ATH at ₹63 . Beyond that, the stock enters "blue sky" price discovery.
- 🐻 Bearish Case (Rejection):
- Trigger: If the 5-year resistance (₹56) proves too strong and sellers step in.
- Support: The stock would likely fall back to the ₹53 level (immediate support) or the 20-day EMA to gather more strength.
Conclusion
The setup is highly potent because it combines a technical recovery with a 5-year structural breakout attempt. Watch for a sustained close above ₹56 to confirm the run to ₹63 .

Gravita Triangle Breakout 1DGravita is attempting to breakout after forming a triangle pattern on 1D timeframe with high volumes. The stock is also trading above 200ema. Enter after bullish confirmation.

Part 8 Trading Master Class With Experts Role of Volume & Open Interest
These indicators help understand market participation:
Volume shows activity
Open Interest shows fresh positions
Rising OI + rising price → strong trend
Rising OI + falling price → trend strength in opposite direction
Falling OI → position unwinding
Options with high OI often influence intraday support/resistance.

Part 7 Trading Master Class With Experts Risks in Option Trading
1. For Option Buyers
High time decay
Need sharp moves
Volatility drop can cause losses
2. For Option Sellers
Large potential loss
Requires strict stop-loss
High volatility can spike premiums unpredictably

Part 6 Learn Institutional TradingWhat Is Premium?
Premium is the cost of buying an option.
It depends on multiple factors:
Underlying price
Strike price
Time to expiry
Volatility (IV)
Interest rates
Market demand and supply
If implied volatility is high, premium rises.
If expiry date is near, premium decays faster.

Part 4 Learn Institutional Trading Option Buyer vs. Option Seller
There are two sides to every option trade:
Option Buyer (Holder)
Pays premium
Limited loss
Unlimited profit potential
Needs strong directional movement
Time decay works against them
Option Seller (Writer)
Receives premium
Limited profit (premium only)
Large potential risk
Benefits from sideways/slow markets
Time decay works in favor

Part 3 Learn Institutional Trading Put Option Simplified
A put option is useful when you expect the market to go down.
When you buy a put, you are paying a premium for the right to sell.
If the underlying falls below your strike, your put gains value.
Example:
BANK NIFTY at 48,000. You buy a 48,000 PE.
If it falls to 47,500, your put becomes profitable.
Again, your maximum loss is limited to the premium.

Part 2 Ride The Big Moves Call Option Simplified
A call option is useful when you expect the market to go up.
If you buy a call option, you are paying a premium to the seller.
If the price rises above your strike price before expiry, your call option gains value.
Example:
NIFTY trading at 22,000. You buy a 22,000 CE.
If NIFTY goes to 22,300, your call becomes profitable because you have the right to buy at 22,000.
If the market falls instead, you lose only the premium you paid.

Options TradingIntroduction to Options Trading
Options trading is one of the most powerful yet misunderstood segments of the financial markets. Unlike stocks, which represent ownership in a company, options are financial contracts that give the holder the right, but not the obligation, to buy or sell an underlying asset at a predetermined price within a specific timeframe. Options are part of the derivatives family, meaning their value derives from the price movements of another asset, such as stocks, indices, commodities, or currencies.
Options trading allows investors to hedge risks, generate income, and speculate on market movements with comparatively smaller capital. They are versatile instruments, suitable for conservative hedging strategies as well as aggressive speculative plays. In India, options are actively traded on exchanges like NSE (National Stock Exchange) and are available on equities, indices (like Nifty 50), and commodities.
At its core, options trading is about flexibility and strategy. Unlike buying a stock outright, options let traders create positions that profit in bullish, bearish, or neutral market conditions. This flexibility is why professional traders and institutions frequently use options to manage risk, leverage capital, and optimize returns.
What Are Options?
An option is a contract between two parties: the buyer and the seller (writer). The buyer pays a price called a premium for the right to buy or sell the underlying asset at a specific price, known as the strike price, before the option expires. The seller, in turn, is obligated to fulfill the contract if the buyer exercises it.
Options are categorized into two main types:
Call Options – Give the holder the right to buy the underlying asset at the strike price.
Put Options – Give the holder the right to sell the underlying asset at the strike price.
The price of an option (premium) depends on multiple factors, such as:
The current price of the underlying asset.
The strike price relative to the current price.
Time until expiration (time decay).
Volatility of the underlying asset.
Interest rates and dividends (for equities).
Because options are derivative instruments, they allow traders to control a larger position with smaller capital. For instance, buying one Nifty 50 call option might give exposure equivalent to 50 shares of the index, but at a fraction of the capital required to buy the shares directly.
Options come with an expiration date, after which they become worthless if not exercised or closed. This characteristic introduces an important concept called time decay (Theta), which significantly influences option pricing and strategy.
Calls vs Puts: The Basics
Options are essentially bets on market direction, and the two main instruments—calls and puts—represent opposite positions.
1. Call Options
Definition: A call option gives the buyer the right, but not the obligation, to buy the underlying asset at a predetermined strike price before or on the expiration date.
When to Buy: Traders buy call options when they expect the price of the underlying asset to rise.
Profit Potential: The potential profit is theoretically unlimited, as the asset price can rise indefinitely above the strike price.
Risk: The maximum risk for the call option buyer is the premium paid, which is the cost of acquiring the option.
Example: Suppose Reliance Industries is trading at ₹2,500. A trader buys a call option with a strike price of ₹2,600, paying a premium of ₹50. If the stock rises to ₹2,700, the intrinsic value is ₹100, resulting in a profit of ₹50 per share after deducting the premium.
2. Put Options
Definition: A put option gives the buyer the right, but not the obligation, to sell the underlying asset at a predetermined strike price before or on expiration.
When to Buy: Traders buy put options when they expect the price of the underlying asset to fall.
Profit Potential: The potential profit increases as the price of the underlying asset declines. In theory, the maximum gain occurs if the asset price drops to zero.
Risk: Like calls, the maximum risk is limited to the premium paid.
Example: Suppose Infosys is trading at ₹1,500. A trader buys a put option with a strike price of ₹1,450 for a premium of ₹30. If Infosys falls to ₹1,400, the intrinsic value of the put is ₹50, resulting in a profit of ₹20 per share after deducting the premium.
Comparison Table: Calls vs Puts
Feature Call Option Put Option
Right To buy underlying asset To sell underlying asset
Market Expectation Bullish (price rise) Bearish (price fall)
Maximum Loss Premium paid Premium paid
Maximum Gain Unlimited Strike price minus premium (asset cannot
go below zero)
Used for Speculation, hedging long Speculation, hedging short positions
positions
Importance of Understanding Option Mechanics
Understanding the mechanics of options is crucial for traders to make informed decisions and manage risk effectively. Options are not standalone investments—they interact with market dynamics, time decay, volatility, and pricing models. Misunderstanding these mechanics can lead to significant losses, even in seemingly simple trades.
1. Pricing Factors
The pricing of options depends on variables like the underlying asset’s price, strike price, time to expiration, volatility, and interest rates. Using models like Black-Scholes (for European options) or Binomial models (for American options) helps traders understand fair value and identify mispriced options.
2. Risk Management
Options can limit risk for buyers because the maximum loss is the premium paid, while sellers face theoretically unlimited risk (especially naked call sellers). Understanding the payoff structure allows traders to balance reward vs. risk and design hedging strategies.
3. Strategic Flexibility
Options mechanics allow for sophisticated strategies beyond just buying calls and puts. Traders can combine calls, puts, and underlying assets to create strategies like:
Covered Calls – Generating income on existing holdings.
Protective Puts – Hedging against downside risk.
Spreads and Straddles – Leveraging volatility for profit.
Without a solid grasp of how options work, implementing these strategies can become confusing and risky.
4. Timing and Volatility
Time decay (Theta) erodes option value as expiration approaches. Traders must understand how timing affects profitability. Similarly, volatility (Vega) impacts premiums: higher volatility increases option prices, offering potential for greater profit but also higher cost. Ignoring these factors can lead to unexpected losses even if the market moves in the anticipated direction.
5. Hedging and Speculation
Options are invaluable for hedging. For example, an investor holding a long stock position can buy puts as insurance against market decline. Conversely, options can be used for speculation with leverage, allowing traders to control large positions with limited capital. Understanding mechanics ensures these strategies are applied effectively.
Conclusion
Options trading is a dynamic and versatile arena within financial markets. Understanding what options are, the distinction between calls and puts, and the mechanics behind option pricing is essential for anyone looking to trade wisely. Calls allow traders to profit from rising markets, while puts benefit from falling prices. Both offer defined risk for buyers and strategic opportunities when used correctly.
Mastering option mechanics is not just about predicting market direction—it’s about timing, volatility, premium management, and strategic deployment. Traders who understand these nuances can leverage options for hedging, income generation, and speculation, making them one of the most powerful tools in modern finance.

Technical Indicators Used in Momentum Trading1. Relative Strength Index (RSI)
The Relative Strength Index (RSI) is one of the most popular momentum indicators used by traders. Developed by J. Welles Wilder, the RSI measures the speed and magnitude of price movements over a specified period, typically 14 days. The indicator oscillates between 0 and 100 and helps identify overbought and oversold conditions in the market.
Overbought Condition: RSI above 70 suggests that the asset might be overbought, indicating potential for a price correction or trend reversal.
Oversold Condition: RSI below 30 suggests the asset may be oversold, providing potential buying opportunities.
RSI is particularly effective in momentum trading because it reflects the strength of price trends and highlights potential entry and exit points. Traders often combine RSI with other indicators to confirm momentum.
2. Moving Average Convergence Divergence (MACD)
The MACD is another essential tool in momentum trading. It measures the relationship between two moving averages, typically the 12-day and 26-day exponential moving averages (EMA), and produces a MACD line. A 9-day EMA of the MACD, known as the signal line, helps identify buy or sell signals.
Bullish Signal: When the MACD line crosses above the signal line, it suggests upward momentum.
Bearish Signal: When the MACD line crosses below the signal line, it indicates downward momentum.
MACD is valuable for momentum traders because it captures trend strength and potential reversals, allowing traders to time entries and exits more effectively.
3. Stochastic Oscillator
The Stochastic Oscillator is a momentum indicator that compares the closing price of an asset to its price range over a specific period, usually 14 periods. It consists of two lines: %K (fast line) and %D (slow line).
Overbought Condition: Readings above 80 suggest that the asset may be overbought.
Oversold Condition: Readings below 20 indicate that the asset may be oversold.
The Stochastic Oscillator is particularly effective in identifying short-term momentum shifts and spotting potential reversals in both trending and range-bound markets. Traders often use stochastic divergences, where price moves contrary to the oscillator, to detect weakening trends.
4. Average Directional Index (ADX)
The Average Directional Index (ADX) measures the strength of a trend rather than its direction. It is derived from the +DI and −DI lines, which indicate upward and downward directional movement. ADX values range from 0 to 100:
Strong Trend: ADX above 25 indicates a strong trend.
Weak or No Trend: ADX below 20 suggests a weak or sideways market.
Momentum traders rely on ADX to identify when a trend is gaining strength, which is essential for confirming momentum-driven trades. Unlike oscillators, ADX does not provide overbought or oversold signals but instead signals trend strength.
5. Bollinger Bands
While Bollinger Bands are primarily used to measure volatility, they also help identify momentum changes. Bollinger Bands consist of a moving average (usually 20-period SMA) and two standard deviation lines above and below it.
Price Breakout: When the price moves outside the bands, it indicates strong momentum.
Squeeze: Narrow bands indicate low volatility and potential for a momentum breakout.
Momentum traders use Bollinger Bands to spot explosive moves and gauge the strength of trends. When prices ride the upper or lower band, it often signifies strong trend momentum.
6. Commodity Channel Index (CCI)
The Commodity Channel Index (CCI) measures the deviation of the asset's price from its moving average. Typically, a 20-period CCI is used, oscillating between +100 and −100.
Overbought: CCI above +100.
Oversold: CCI below −100.
CCI is particularly useful in momentum trading for identifying cyclical trends and potential reversals. It is often combined with trend-following indicators to improve accuracy.
7. On-Balance Volume (OBV)
The On-Balance Volume (OBV) is a volume-based momentum indicator. It accumulates volume based on whether the price closes higher or lower than the previous period.
Rising OBV: Confirms upward price momentum.
Falling OBV: Confirms downward price momentum.
OBV is valuable for traders to confirm price trends with volume support. Momentum traders often rely on OBV divergences to spot potential reversals before they occur.
8. Ichimoku Cloud
The Ichimoku Cloud is a comprehensive indicator that combines trend, momentum, and support/resistance in a single view. Key components include the Tenkan-sen, Kijun-sen, Senkou Span A, and Senkou Span B.
Bullish Momentum: Price above the cloud.
Bearish Momentum: Price below the cloud.
Ichimoku Cloud helps momentum traders identify trend direction and potential entry/exit points while also providing a sense of trend strength.
9. Practical Tips for Using Momentum Indicators
Combine Indicators: No single indicator provides perfect signals. Traders often combine RSI, MACD, and ADX for better confirmation.
Confirm Trend Direction: Use trend-following indicators alongside oscillators to avoid false signals in sideways markets.
Time Frame Selection: Short-term traders may prefer 5–15 minute charts, while swing traders use daily or weekly charts.
Watch for Divergence: Momentum divergence, where price moves contrary to an indicator, often signals weakening momentum.
Risk Management: Momentum trading can be fast-moving; always use stop-loss orders and position sizing.
10. Conclusion
Momentum trading relies heavily on technical indicators to make informed decisions. Indicators such as RSI, MACD, Stochastic Oscillator, ADX, ROC, Bollinger Bands, CCI, OBV, and Ichimoku Cloud provide traders with quantitative insights into trend strength, potential reversals, and overbought or oversold conditions. By understanding the strengths and limitations of each indicator, momentum traders can optimize their strategies, identify high-probability trade setups, and manage risk effectively.
While technical indicators are powerful tools, successful momentum trading also requires discipline, market awareness, and a solid risk management plan. Using indicators in conjunction with proper trading psychology and market knowledge increases the likelihood of consistent profitability in dynamic markets.
Introduction to Futures HedgingUnderstanding Futures Contracts
A futures contract is a standardized legal agreement to buy or sell an asset at a predetermined price at a specified future date. These contracts are traded on organized exchanges, ensuring liquidity, transparency, and regulatory oversight. The underlying asset in a futures contract could be a physical commodity such as crude oil, wheat, or gold, or a financial instrument like an index, bond, or currency.
Futures contracts have key characteristics:
Standardization: The contract specifies the quantity, quality, and delivery date of the underlying asset.
Margin Requirements: Traders must maintain a margin—a fraction of the contract value—to enter into futures positions.
Mark-to-Market: Gains and losses are settled daily based on the contract’s market value.
Leverage: Futures allow traders to control large positions with relatively small capital, magnifying both potential gains and losses.
These features make futures contracts ideal tools for hedging because they provide predictability and protection against price volatility.
The Concept of Hedging
Hedging is the practice of taking an investment position in one market to offset potential losses in another. In essence, it acts like insurance: while it may limit potential profits, it also minimizes exposure to losses. There are two main types of hedging:
Long Hedge: Used when a business anticipates purchasing an asset in the future and wants to lock in the current price to avoid rising costs.
Example: An airline expects to buy jet fuel in six months. To protect against rising fuel prices, it can buy futures contracts now at the current price. If fuel prices rise, the gain on the futures contract offsets the higher cost of purchasing fuel in the future.
Short Hedge: Used when a business holds an asset and wants to protect against falling prices.
Example: A wheat farmer expects to harvest in three months. To avoid losses if wheat prices fall, the farmer can sell wheat futures contracts now. If the price drops, the profit on the futures contract compensates for the lower market price of the physical wheat.
By employing hedging strategies, both buyers and sellers can stabilize cash flows and plan their operations with more certainty.
Importance of Futures Hedging
Risk Management: The primary objective of futures hedging is to manage price risk. Businesses in agriculture, energy, metals, and finance frequently use futures to minimize the impact of adverse price movements.
Price Discovery: Futures markets facilitate price discovery, reflecting expectations of supply and demand. Hedgers benefit by gaining insight into future price trends.
Financial Stability: Hedging provides stability to earnings and costs. For companies with significant exposure to commodity or currency fluctuations, this stability supports strategic planning, investment, and growth.
Speculation Reduction: By hedging, companies avoid excessive exposure to speculation-driven market movements, focusing instead on their core business operations.
Enhanced Creditworthiness: Companies with effective hedging programs are viewed as financially prudent by lenders and investors, improving access to capital.
Mechanics of Futures Hedging
Hedging with futures involves several steps:
Identify the Exposure: Determine which assets, commodities, or financial instruments are exposed to price risk.
Select the Appropriate Futures Contract: Choose a futures contract that closely matches the underlying asset in terms of quantity, quality, and timing.
Decide the Hedge Ratio: The hedge ratio determines the number of futures contracts needed to offset the risk. Perfect hedges are rare; often, partial hedges are employed to balance risk reduction and cost.
Enter the Futures Position: Buy or sell futures contracts depending on whether a long or short hedge is appropriate.
Monitor and Adjust: As market conditions change, hedgers must monitor their positions and adjust contracts to maintain effective risk coverage.
Close or Offset the Hedge: Futures contracts can be offset before expiration by taking an opposite position or allowed to expire if physical delivery aligns with the hedger’s requirements.
Examples of Futures Hedging
1. Agricultural Hedging:
A corn farmer expects to harvest 10,000 bushels in four months. Concerned about falling prices, the farmer sells corn futures contracts now. When harvest time arrives, even if the market price has dropped, the farmer’s futures gains compensate for the lower sale price, ensuring financial stability.
2. Corporate Hedging:
A multinational company expects to receive €5 million in payments in six months but operates primarily in USD. To protect against EUR/USD exchange rate fluctuations, the company sells euro futures contracts. If the euro depreciates, gains on the futures offset the reduced dollar value of the payment.
3. Commodity Hedging:
An airline hedges against rising fuel costs by buying crude oil futures. If oil prices increase, the gain on the futures contracts compensates for higher fuel costs, helping maintain profitability.
Advantages of Futures Hedging
Predictable Cash Flows: Hedging reduces uncertainty in revenue and costs.
Flexibility: Futures can be tailored to different commodities, currencies, or indices.
Liquidity: Exchange-traded futures offer easy entry and exit.
Leverage: Efficient capital use allows risk management without tying up large amounts of money.
Transparency: Prices are visible and regulated, reducing counterparty risk.
Limitations of Futures Hedging
Basis Risk: The futures price may not move perfectly in line with the underlying asset, resulting in imperfect hedges.
Cost: Margins and transaction fees add to the cost of hedging.
Limited Profit Potential: Hedging locks in prices, reducing the opportunity to benefit from favorable market movements.
Complexity: Understanding contract specifications, hedge ratios, and market dynamics requires expertise.
Over-hedging Risk: Using excessive futures positions can create unintended exposure and losses.
Conclusion
Futures hedging is a vital risk management tool in modern financial and commodity markets. It allows businesses and investors to stabilize cash flows, plan effectively, and mitigate losses arising from adverse price movements. By understanding the mechanics, advantages, and limitations of futures contracts, market participants can use hedging strategies to navigate volatile markets with confidence. While futures hedging does not eliminate risk entirely, it transforms unpredictable market movements into manageable financial outcomes, fostering greater stability and strategic decision-making.
In an increasingly globalized and interconnected economy, the role of futures hedging has expanded beyond traditional commodities to include financial instruments, currencies, and indices. Companies, investors, and financial institutions that employ well-structured hedging strategies are better positioned to withstand market shocks, protect their profitability, and achieve long-term growth.
Introduction to the AI-Driven Trading EraThe Evolution of Trading Technology
To understand the AI-driven era, it is important to look back at how trading technology has evolved. Markets moved from the open-outcry system to electronic trading, and from electronic trading to algorithmic models. Algorithmic trading introduced systematic rule-based execution, but these systems still relied heavily on predefined human logic. AI changes that framework by enabling trading systems to learn, adapt, and optimize themselves using vast amounts of data.
This evolution happened because markets became too fast, too complex, and too data-driven for human traders to handle manually. AI emerged as the natural solution for processing huge datasets, identifying hidden patterns, and executing trades in microseconds.
What Makes AI a Game Changer in Trading?
AI’s advantage lies in its ability to detect nonlinear patterns, its speed, and its capacity to learn autonomously. Unlike conventional formulas that follow static rules, AI models adjust themselves based on new market behavior, making them exceptionally powerful during volatility, regime shifts, or unexpected market events.
Some key strengths of AI-driven trading systems include:
1. Big Data Processing
Financial markets produce enormous amounts of data: price ticks, news, economic indicators, global sentiments, social media activity, institutional flows, and alternative datasets like satellite images or credit card spending. AI models can process all of these simultaneously, generating insights far beyond the reach of human analysis.
2. Predictive Modeling
Machine learning models learn from historical price data and trading patterns to predict potential future outcomes. While no model is perfect, AI significantly improves the probabilities and timing of accurate predictions.
3. Automation and Emotion-Free Decision Making
Human traders often suffer from fear, greed, overconfidence, and biases. AI systems remove emotional interference entirely, sticking to mathematical probabilities and risk-adjusted models.
4. Multi-Factor Integration
AI can combine dozens—or even hundreds—of variables to evaluate a trading opportunity, something impossible for a human trader. These include:
Technical indicators
Market microstructure signals
Volume patterns
Macroeconomic trends
Order book depth
Options flow
Global market correlations
5. Speed and Precision
AI-powered high-speed execution ensures minimal slippage, instant order routing, and accurate position sizing. This is crucial in markets where milliseconds can mean the difference between profit and loss.
The Rise of Machine Learning Models in Trading
Three major categories of ML models dominate AI trading today:
1. Supervised Learning
Models learn from labeled historical data to predict future price movements. Examples include:
Linear regression
Random forests
Gradient boosting models
Neural networks
These models are excellent at forecasting price direction, volatility, and risk.
2. Unsupervised Learning
Used for clustering, anomaly detection, and market regime identification. These models identify hidden structures in the market such as:
Patterns preceding trend reversals
Unusual behavior indicating manipulation
Shifts in market sentiment
3. Reinforcement Learning (RL)
One of the most exciting developments in AI trading, RL models learn by trial and error. They self-optimize by interacting with market environments, much like how AlphaGo learned to play Go. RL trading systems continuously adjust strategies based on reward maximization, making them extremely adaptive.
AI in High-Frequency Trading (HFT)
High-frequency trading firms were among the earliest adopters of AI. Their algorithms operate at lightning speed, executing thousands of trades per second. AI enhances HFT through:
Ultra-fast pattern recognition
Statistical arbitrage
Market-making
Latency arbitrage
Liquidity prediction
HFT remains one of the most profitable yet highly competitive areas of AI-powered markets.
AI for Retail Traders
The democratization of AI has brought powerful tools to retail traders in India and around the world. Cloud computing, open-source ML libraries, and broker APIs allow individuals to build and deploy their own AI models. Many retail traders now use:
AI-based scanners
Sentiment analysis bots
Automated trading systems
Options flow predictors
Reinforcement learning strategies
Platforms like Zerodha, Upstox, and Interactive Brokers support API-driven execution, enabling retail participants to operate like mini-quant firms.
AI and Market Microstructure
Advanced AI tools analyze market microstructure to exploit tiny inefficiencies. They evaluate:
Bid-ask spreads
Order book imbalances
Liquidity pockets
Iceberg orders
Hidden institutional flows
For traders, this means precise entries, better exit timing, and improved risk management.
Sentiment Analysis: The New Frontier
In the AI era, price is no longer the only source of truth. Sentiment is equally powerful. AI models scan:
News
Financial reports
Twitter
Reddit
Analyst commentary
CEO statements
Global events
Natural Language Processing (NLP) converts all this into actionable trading signals. For example, a sudden surge in negative sentiment often predicts a short-term drop in price.
Risks and Limitations of AI-Driven Trading
Despite its advantages, AI also brings challenges:
1. Overfitting
Models may perform well on historical data but poorly in live markets.
2. Black-Box Behavior
Deep learning models can be difficult to interpret.
3. Market Regime Shifts
AI can struggle when markets behave in ways not seen in training data.
4. Data Quality Issues
Incorrect, insufficient, or biased data leads to inaccurate predictions.
5. Overdependence
Traders relying entirely on AI may overlook fundamental risks or black swan events.
Successful AI trading requires human judgment, risk management, and continuous monitoring.
The Future of AI-Driven Trading
The AI trading era has only just begun. The future will likely include:
Fully autonomous trading systems
AI-powered portfolio optimization
Predictive risk models
Quantum computing–based trading algorithms
Personalized AI trading advisors
Real-time global sentiment heat maps
Markets will continue becoming faster, smarter, and more efficient. Traders who adopt AI early will have a powerful edge, while those who ignore it risk falling behind.
Trading Styles in the Indian Market1. Intraday Trading
Intraday trading, commonly known as day trading, is one of the most popular styles in India due to high volatility and leverage availability. It involves entering and exiting trades within the same trading day. The primary objective is to capture small price movements across large volumes.
Key Features
Short time frames: 1–5 minutes, 15 minutes, or hourly charts.
High leverage: Brokers offer margin for intraday trades.
Targets are small: 0.3% to 1.5% moves.
Risk management is crucial due to high volatility.
Popular Strategies
Momentum trading during market opening.
Breakout and breakdown strategies.
VWAP-based institutional flow tracking.
Reversal trades at key supply-demand zones.
Best Suited For
Traders with quick decision-making skills, emotional discipline, and the ability to monitor charts during market hours.
2. Swing Trading
Swing trading is ideally suited for the Indian market because stocks often move in short-term trends driven by news, earnings expectations, institutional flows, and sector rotation. Swing traders typically hold positions for 2–20 days.
Key Features
Higher timeframe analysis: Daily and weekly charts.
Lower stress compared to intraday.
Ideal for people with jobs who cannot monitor the market all day.
Uses technical patterns like flags, triangles, pullbacks, and breakouts.
Popular Swing Indicators
Moving averages (20, 50, 200)
RSI divergences
Fibonacci retracement zones
MACD crossovers
Best Suited For
Traders who prefer moderate risk, medium-term profits, and structured analysis without minute-to-minute monitoring.
3. Positional Trading
Positional trading involves holding trades for weeks to months based on broader market trends. This style is popular among experienced traders and investors who understand macro trends, sectoral cycles, and company fundamentals.
Key Features
Focus on major trends, not minor fluctuations.
Requires patience and conviction.
Uses weekly and monthly charts.
Less stressful than intraday/swing.
Approach
Use fundamentals for selection and technicals for timing.
Sectors like banking, FMCG, pharma, and IT respond well to positional plays.
Key tool: trendlines, moving averages, sector rotation analysis.
Best Suited For
Working professionals, medium-capital traders, and long-term thinkers.
4. Scalping
Scalping is one of the fastest and most advanced trading styles. The goal is to book very small profits (0.05%–0.3%) multiple times throughout the day. Scalping is extensively used in index derivatives—especially NIFTY, BANK NIFTY, and FINNIFTY—because liquidity and depth are extremely high.
Key Features
Extremely quick trades lasting seconds to minutes.
High frequency, low risk per trade.
Requires stable internet and low-latency execution.
Works best during high liquidity periods—opening hour and closing hour.
Tools
Option order flow
VWAP
Depth of market (DOM) data
Tick charts and footprint charts (for advanced scalpers)
Best Suited For
High-skill professional traders with strong reflexes, emotional control, and advanced tools.
5. Algorithmic and System-Based Trading
Algo trading has grown rapidly in India with the availability of APIs, platforms like Zerodha Streak, Tradetron, and custom Python systems. Algorithmic trading uses rules, automation, and backtesting instead of emotional decision-making.
Key Features
Mechanical, rule-based execution.
Removes emotions from trading.
Can handle high-frequency signals.
Backtesting helps refine strategies.
Popular Algo Styles
Trend-following systems.
Mean-reversion systems.
Statistical arbitrage.
Option selling with hedges.
Market-neutral strategies.
Advantages
Consistency and discipline.
Ability to trade multiple symbols simultaneously.
Works even for part-time traders.
Best Suited For
Tech-savvy traders, engineers, data scientists, or those who prefer automation over discretion.
6. BTST / STBT Trading (Buy Today, Sell Tomorrow / Sell Today, Buy Tomorrow)
BTST and STBT trading styles focus on overnight price movements influenced by global cues, economic announcements, or corporate news.
Key Features
BTST: Carry equity positions overnight to capture gap-up openings.
STBT: Mostly used in F&O due to short selling restrictions.
Trades depend on global markets—Dow, SGX NIFTY, crude oil, and currency moves.
Best Suited For
Swing traders who want to avoid intraday volatility but profit from overnight reactions.
7. Options Buying (Directional)
Options trading has exploded in India due to low capital entry and high reward potential. Directional option buyers predict sharp short-term moves.
Focus Areas
ATM/OTM calls and puts.
Breakout-based entries.
Trend days with strong momentum.
Expiry day (Thursday) trades.
Challenges
High theta decay.
Requires accuracy in direction and timing.
Best Suited For
Experienced traders who understand volatility, Greeks, and market structure.
8. Options Selling (Non-Directional or Semi-Directional)
Option selling is preferred by professional traders because it offers consistent income through premium decay.
Popular Strategies
Straddles & strangles.
Iron condor.
Bull/bear spreads.
Calendar spreads.
Advantages
High probability trades.
Beneficial during low-volume consolidations.
Risks
Requires strict hedging.
Black swan events can cause large losses.
Best Suited For
Capital-rich traders with risk-management experience.
9. Trend Following
Trend following is timeless and works well in trending markets like India. Instead of predicting tops and bottoms, trend followers ride the big wave.
Key Features
Use moving averages (20/50/200).
Enter after confirmation, not prediction.
Works extremely well in bull markets.
Requires fewer but high-quality trades.
Psychology
Trend following is simple but emotionally challenging because you must hold winners and cut losers quickly.
10. News-Based and Event Trading
Event traders focus on volatility around:
RBI policy
Budget announcements
Earnings results
Global macro events
Corporate announcements
Approach
Predict volatility, not direction.
Often uses straddles/strangles.
Fast execution is required.
Conclusion
The Indian market provides opportunities for every type of trader—from beginners to advanced professionals. Each trading style has its strengths, weaknesses, and ideal market conditions. To succeed, traders must choose a style that matches their personality, risk tolerance, time availability, and capital. Mastery comes from specialization, risk management, and continuous learning.