Jindal Stainless (D): Strongly Bullish - Sector-Backed BreakoutTimeframe: Daily | Scale: Linear
The stock has confirmed a major "Blue Sky" breakout, clearing a confluence of resistance levels (Angular + Horizontal) to hit a new All-Time High. This move is powered by a sector-wide rally and strong institutional volume.
🚀 1. The Fundamental Catalyst (The "Why")
The breakout is fueled by a convergence of positive factors:
> Sector Rally: The Nifty Metal index is surging, lifting all ferrous metal stocks. When a stock breaks out with its sector, the probability of success increases significantly.
> Strong Earnings Support: The company’s Q2 FY26 results provided the fundamental floor, and the market is now pricing in future growth from its capacity expansion plans (targeting 4.2 MTPA).
📈 2. The Chart Structure (The "Coil" bursts)
> The Squeeze: The tight sideways trend below the angular resistance. This "Coiling" action (low volatility + drying volume) indicated that sellers were exhausted.
> The Breakout: Today's surge of 5.14% smashed through the ₹825–₹830 supply zone.
- Significance: By closing at a new ATH ( ₹848.05 ), the stock has no overhead supply (resistance) left. It is now in "Price Discovery" mode.
> Volume: The 2.77 Million volume is an "Ignition Bar." It confirms that "Smart Money" has initiated a new markup phase.
📊 3. Technical Indicators
> EMAs: The Positive Crossover (PCO) on Short-term EMAs confirms the immediate trend is vertical.
> RSI: Rising RSI across all timeframes (Monthly/Weekly/Daily) signals synchronized momentum. An RSI above 60 in a breakout is a sign of strength, not an overbought signal.
🎯 4. Future Scenarios & Key Levels
The stock is primed for a "Blue Sky" run.
> 🐂 Bullish Target (Blue Sky):
- Target 1: ₹960 .
- Strategy: Since the stock is at an ATH, use a Trailing Stop Loss (e.g., 20-day EMA) to ride the trend as far as it goes.
> 🛡️ Support (The "Must Hold"):
- Immediate Support: ₹790 – ₹800 . The previous resistance zone should now act as a rock-solid floor (Polarity Principle).
- Stop Loss: A close below ₹776 would act as a structural failure, invalidating the breakout.
Conclusion
This is a Grade A Setup .
> Refinement: The "Low Volume" during the sideways phase followed by "High Volume" on the breakout is the perfect recipe for a sustainable move.
> Action: The breakout is confirmed. The dip to ₹820-830 (if it happens) is a buying opportunity.
Trendlinebreakot

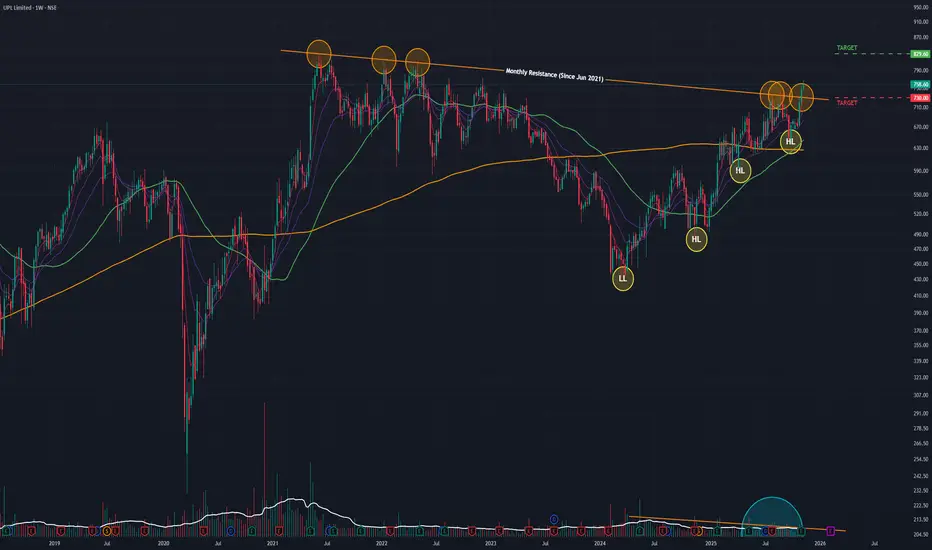
UPL (W): Strongly Bullish, Fundamentally-Driven BreakoutBased on Weekly Timeframe, Logarithmic Scale
This is a high-conviction breakout. The stock has decisively broken a 4.5-year angular resistance, driven by a blockbuster quarterly earnings report that confirmed a strong business turnaround. The alignment of high-timeframe indicators suggests a new long-term uptrend is beginning.
🚀 1. The Fundamental Catalyst (The "Why")
The technical breakout is not random. It is a direct response to strong Q2 2026 earnings :
- Strong Profitability: The company reported a 40% year-over-year growth in EBITDA and a net profit of ₹553 crore , a massive turnaround from the net loss reported in the same quarter last year.
- Upgraded Guidance: Management upgraded its full-year EBITDA growth guidance, signaling confidence in the business.
- Market Reaction: This news provided the "fuel" for the market to absorb supply and break the multi-year resistance.
📈 2. The Long-Term Setup (The "Big Picture")
- The 2021 Peak: After its ATH in June 2021 , the stock was capped by a long-term angular resistance trendline .
- The 2024 Bottom: The stock was in a corrective downtrend, which found its ultimate bottom in March 2024 .
- The Reversal: Since that low, the stock has been in a steady reversal, forming a bullish structure of Higher Lows .
- The "Lid": This recovery was repeatedly halted by the 4.5-year angular resistance, which it failed to break on previous attempts.
📊 3. The Decisive Breakout (The Past Two Weeks)
- Week of Nov 03: The stock broke out and closed above the angular resistance for the first time.
- Week of Nov 10: The stock confirmed the breakout with a gap-up open and a further 1.42% gain.
- Volume: The volume during the March 2024 uptrend was low (a "wall of worry"), but the breakout and confirmation weeks saw above-average volume ( 12.29 Million last week), confirming institutional interest.
🎯 4. Confluence of Indicators
Indicator analysis confirms the new long-term trend. This "trifecta" of bullishness on high timeframes is very powerful:
- EMAs: Short-term Exponential Moving Averages are in a "PCO" (Price Crossover) state on both the Monthly and Weekly charts.
- RSI: The Relative Strength Index is rising on both the Monthly and Weekly charts.
🧠 5. Short-Term Caution & Future Scenarios
- The "Inverted Hammer": The last daily candle of the week was an "inverted hammer." This is a sign of short-term indecision and profit-taking . It signals that while the breakout is valid, it's meeting immediate supply, and a healthy pullback or "re-test" is highly possible.
- Conclusion: The trend is now bullish, but the entry point is key.
🐂 The Bullish Case (Continuation)
- Trigger: The bullish momentum continues, absorbing the short-term profit-taking.
- Target: The next logical price target is ₹830 .
🐻 The Pullback Case (Healthy Re-test)
- Trigger: If the "inverted hammer" plays out and momentum is lost in the short term .
- Support: The price would likely fall to re-test the angular resistance-turned-support at ₹730 . A "bounce" off this level would be a classic, healthy confirmation of the breakout.
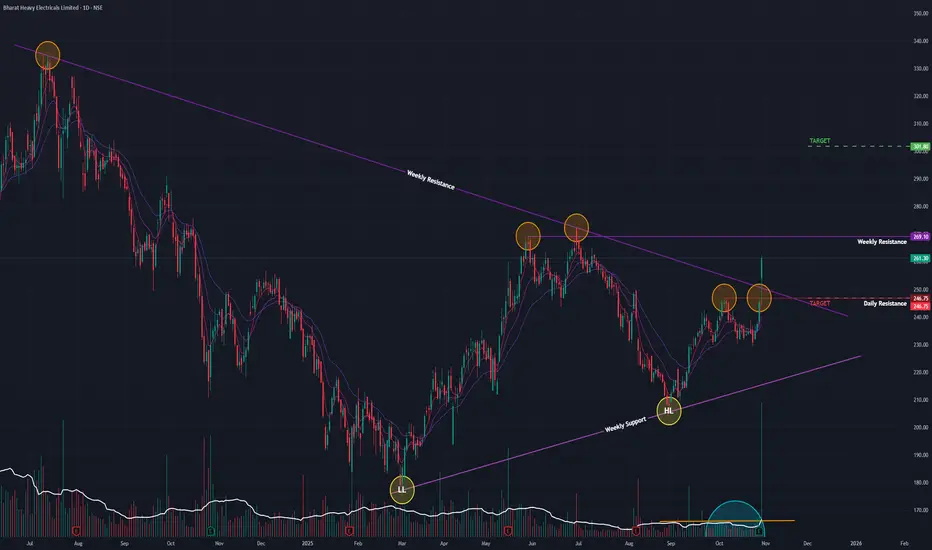
BHEL (D): Strongly Bullish, on a high-volume trendline breakoutThe stock has shown a significant character change, breaking a long-term corrective downtrend with exceptional force. All short-term and long-term indicators are aligning, suggesting a new bullish leg has begun.
📉 1. The Long-Term Context (The "Big Picture")
- Massive Run-Up: After a parabolic 1,720% surge from its March 2020 bottom, the stock hit a major peak in July 2024.
- Corrective Downtrend: This was followed by a healthy 8-month correction (Jul 2024 – Feb 2025), which allowed the stock to build a new base.
- Reversal Pattern: In recent months, the stock has reversed this trend by forming a clear pattern of Higher Lows , indicating that selling pressure has been absorbed and accumulation has taken place.
🚀 2. The Current Breakout (Today's Decisive Action)
Today's price action is the most significant bullish signal for the stock this year.
- High-Volume Surge: The stock surged +6.48% on massive volume of 75.43 Million shares, indicating strong institutional interest.
- Major Trendline Break: The price gapped up above the angular resistance trendline (formed since the July 2024 high) and, most importantly, closed firmly above it .
- Short-Term Breakout: This move also broke and closed above a minor, short-term resistance, adding to the bullish conviction.
📊 3. Key Technical Indicators
The underlying momentum across all timeframes supports this breakout:
- RSI: The Relative Strength Index is rising on the Daily, Weekly, and Monthly charts, showing broad-based, building momentum.
- EMAs: Short-term Exponential Moving Averages are in a "PCO" (Price Crossover) state on all three timeframes, confirming the trend is strongly bullish.
🎯 4. Future Scenarios & Key Levels to Watch
The path forward is now defined by two clear levels:
🐂 The Bullish Case (Breakout Confirmation)
- Immediate Hurdle: The next major test is the horizontal resistance at ₹265 .
- Confirmation: A decisive close above ₹265 would confirm the breakout and open the door for a significant rally.
- Target: If this momentum is sustained, the next logical price target is the ₹300 level.
🐻 The Bearish Case (Fake Breakout)
- Trigger: If today's move is a "fakeout," the price will fail to breach ₹265 and fall back below the broken angular trendline.
- Confirmation: A close back below the gap-up level (today's open) would be a bearish sign.
- Target: This failure would likely see the stock fall to retest its closest support at ₹245 .
Conclusion
Today's high-volume, gap-up breakout above a multi-month downtrend line is a powerful bullish event. The indicators are all aligned, suggesting this is the start of a new upward move. The key level to watch for confirmation is ₹265 .
Shipping Corp (W) - Breaks Out on Massive 21% Weekly SurgeAfter a significant downtrend from its July 2024 All-Time High, the Shipping Corporation of India (SCI) has signaled a powerful bullish trend reversal, culminating in a decisive, high-volume breakout this past week.
The Bullish Reversal
The downtrend that began last year found its bottom in March 2025. Since then, the stock has been in a constructive reversal phase, systematically forming a series of Higher Lows . This classic pattern indicated that selling pressure was being absorbed and buyers were becoming more aggressive, setting the stage for a potential breakout.
This Week's Decisive Breakout
This past week (ending Oct 24, 2025), the bullish setup was decisively confirmed:
- Massive Price Surge: The stock exploded by +21.82% for the week.
- Enormous Volume: This move was backed by a huge volume of 107.25 million shares .
- Key Resistance Breach: The surge shattered a key horizontal resistance trendline , and importantly, the stock closed the week above this level , which is a strong sign of confirmation.
This breakout is powerfully supported by the volume pattern: after drying up during the consolidation phase, it has now picked up significantly, validating the move.
Underlying Technical Strength
The breakout is underpinned by strong momentum indicators on the higher timeframes:
- The short-term EMAs are in a bullish Positive Crossover (PCO) state on both the Monthly and Weekly charts.
- The Relative Strength Index (RSI) is also rising on both the Monthly and Weekly charts.
Outlook and Key Levels to Watch
With the resistance now cleared, the path of least resistance has shifted firmly upwards.
- Bullish Target: If this bullish momentum continues, the next logical area of resistance and potential price target is the ₹330 level.
- Critical Support: The recently broken resistance level, around ₹243 , now becomes the most critical new support zone to watch.
The key to watch for next week is follow-through buying or a successful retest of the ₹243 breakout level, which would further confirm the new uptrend.

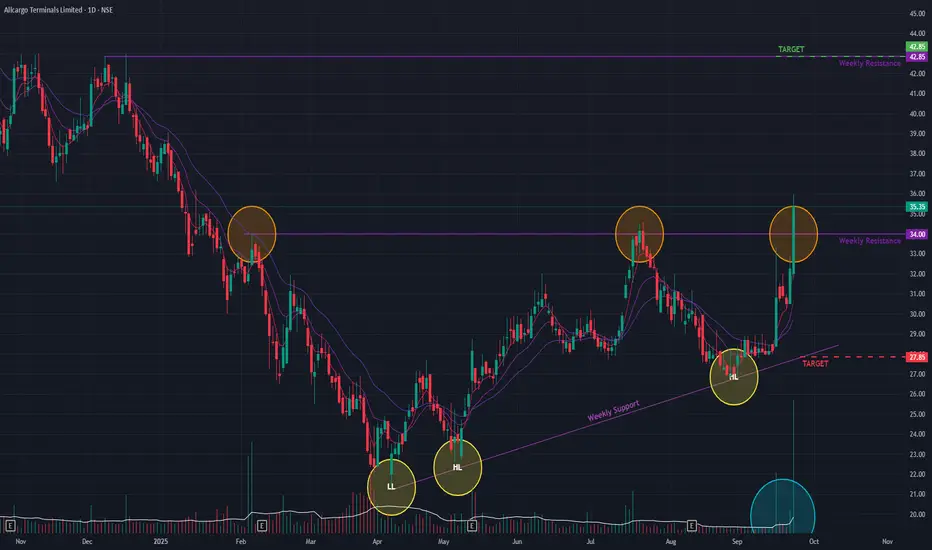
ATL (D) - Signals Bullish Reversal with Powerful BreakoutAllcargo Terminals has demonstrated a significant bullish development, suggesting its long-term downtrend may be reversing. Today, the stock decisively broke out of a key horizontal resistance trendline , a move confirmed by an impressive +9.61% price surge on the back of massive trading volume.
This breakout is the latest in a series of positive signs since May 2025, including the consistent formation of Higher Lows , which indicated a potential shift in market structure after the downtrend from January 2024.
Broad-Based Bullish Confirmation 👍
The positive outlook is strongly supported across multiple indicators and timeframes:
- Volume Thrust: The breakout was accompanied by exceptionally high volume , signaling strong conviction from buyers.
- Daily & Weekly Momentum: Both the short-term Exponential Moving Averages (EMAs) and the Relative Strength Index (RSI) are exhibiting bullish crossovers on both the daily and weekly charts, indicating synchronized positive momentum.
Outlook and Key Levels
Following a strong breakout, a common technical development is a retest of the former resistance level as new support . The price action in the coming days will be crucial for confirming the breakout's validity.
- Bullish Case 📈: If the momentum is sustained and the breakout level holds, the stock could proceed towards the next resistance target near ₹42 .
- Bearish Case 📉: However, if the stock fails to hold the breakout and momentum wanes, it could pull back towards the support level of ₹27 .
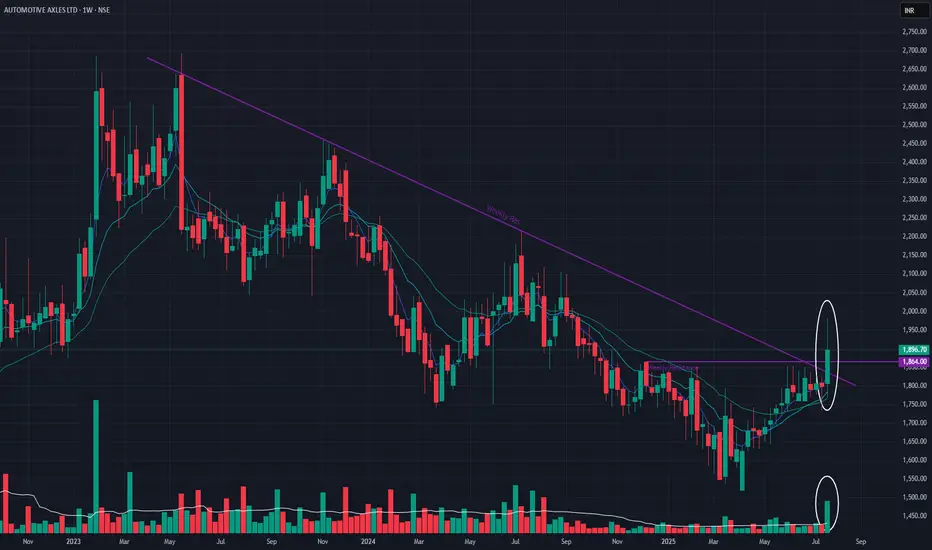
Automotive Axles Ltd (Weekly Timeframe) - Potential Reversal ??After the Double Top formation (May 15, 2023) in weekly timeframe, the stock has been in a downtrend. With this week's price action, the stock seems to BreakOut of a Weekly resistance zone with good volume. EMAs are also in positive state.
A Long-term angular resistance BreakOut along with Short-term resistance BreakOut makes this more significant to consider as a reversal sign. Watchout for next week's price action to determine if the reversal signs are intact or not. If it does, then the next target maybe 2,100.
Archean Chemical - Chart of the WeekNSE:ACI has a beautiful structure in the Weekly Timeframe that qualifies for my Chart of the Week idea. It saw Decent Volumes this week and closed above its recent swing high, with RSI and MACD Trending Upwards and Closing Above all Major Short moving Averages, breaking the Trendline.
About:
NSE:ACI is India's largest exporter of bromine and industrial salt in Fiscal 2021. The company is the leading specialty marine chemical manufacturer in India and is focused on producing and exporting bromine, industrial salt, and sulphate of potash to customers around the world.
Brokerage View:
ICICI Securities research report on Archean Chemical Industries
ACI has a plethora of opportunities – each carrying strong value creation potential – along its path ahead. Right off the bat, the expansion in bromine derivatives, and thus, higher captive bromine consumption would likely provide a strong fillip to ACI’s bromine business. Separately, Oren shall help cater to chemicals’ demand for O&G exploration services along with bromine compounds. Also, the success in its SOP flotation process could unlock extensive value. Further, its foray into SiC chip production – likely production FY28E onwards – would place ACI among the few Indian producers in semiconductors.
Outlook:
It is also exploring a giga-factory in ZincGel batteries using zinc-bromide electrolyte, which exhibits synergies with its bromine. In our view, the stock has little to lose due to undemanding valuations (12.8x FY27E PE). Retain BUY and TP of INR 675 (based on 15x FY27E EPS).
Trade Setup:
It has broken the falling trendline and respected a Major Support Zone, Buy on Dips will the way to play this counter because of the uncertain environment of trump tariffs.
Stop Loss:
Swing Low Levels around the Levels Marked on a Weekly Closing Basis only.
📌Thank you for exploring my idea! I hope you found it valuable.
🙏FLLOW for more
👍BOOST if useful
✍️COMMENT below with your views.
Meanwhile, check out my other stock ideas on the right side until this trade is activated. I would love your feedback.
Disclaimer: "I am not SEBI REGISTERED RESEARCH ANALYST AND INVESTMENT ADVISER."
This analysis is intended solely for informational and educational purposes and should not be interpreted as financial advice. It is advisable to consult a qualified financial advisor or conduct thorough research before making investment decisions.

Britannia |Bull Rally Pending . ⭕️ Swing Trading opportunity: Price Action Analysis Alert !!!⭕️
💡✍️Technical Reasons to trade or Strategy applied :-
✅Inverted Head & Shoulder Chart Pattern Bull Breakout required
✅Breakout confirmation required
✅Rise in Volume
✅Good 3 touches Trendline with volume
✅Clear uptrend with HH & HLs sequence in smaller Time frame
✅ Order block as potential Supports
✅Check out my TradingView profile to see how we analyze charts and execute trades.
🙋♀️🙋♂️If you have any questions about this stock, feel free to reach out to me.
📍📌Thank you for exploring our idea! We hope you found it valuable.
🙏FLLOW for more !
👍LIKE if useful !
✍️COMMENT Below your view !

SAKSOFT - Horizontal Trendline Breakout🔊 SAKSOFT - Horizontal Trendline Breakout
⌛Duration - Short Term (1 Week to 4 Week)
📊📈 Trade Logic - Horizontal Trendline Breakout with Huge Volume
CMP - ₹321.75
Time Frame - Daily
🎯Target 1 : ₹350
🎯Target 2 : ₹360
🎯Target 3 : ₹380
🛑 Stop : ₹300
🏆 Risk/Reward Ratio (1: 2.5)
Disclaimer: The stock information shared above is not a recommendation to buy, sell, or hold. It reflects my own analysis and is intended solely for educational purposes. Any actions you take based on this information are your responsibility, and the admin of this channel is not liable for any financial gains or losses. Please consult a financial advisor before making any investment decisions. I am not a SEBI-registered advisor.

CDSL (Looks Good For Short Term)CDSL has given a trendline breakout on a daily chart. The stock can head towards 1960, 2000, and 2100 levels in the coming days. The stop loss can be placed at the low of the current candle (2nd Feb) which is 1823. The stock also has taken support on the weekly candle.
Disclaimer: I am not a SEBI registered analyst. All the stocks are for educational purposes. Investors must consult a financial advisor before making any investment. It is not a buy or sell recommendation.

Weekly breakout dollar industryStock formed very good bais with good volumes and gave breakout of trendline with good volume it's bit risky but it also look very promising . It's for education only.

Latentview : Trendline Breakout + Retest done#latentview
>> Positional Call (1-3 months)
>> Enter above safe entry levels
>> Good Strength & Volumes in stock
>> Stock Ready to fly Upside.
Swing Traders book your Profits at 5-10% fully or partially and keep trailling
Keep Liking & sharing for more such Analysis
@moneyfesttrading

AURO PHARMA | Falling Trendline nd Symmetrical Triangle BreakoutNSE:AUROPHARMA
Strong Breakout Candle formed with Volume.
Multiple Breakouts from
a) Falling Trendline Pattern of many months
&
b) Symmetrical Triangle Pattern
CMP moving above 20 & 50 Day EMA and RSI moving in Bullish Zone
Target : 554 - 600
SL : 510
R: R - 1 : 2
Time Frame : 1 to 4 weeks

LUPIN| Change in Trend | Start of Bull Run|43% UpsideNSE:LUPIN
Breakout of Falling Trendline from May 2021
Weekly Closing > 50 Week EMA after 15 months signals change of TREND
CMP taking support from Moving Averages
Targets : 744 - 839 - 915 - 992
Upside : 43%
SL : 640
RSI>55 back in BULLISH Zone

Balakrishna on parallel channel supportCan be a good pick for swing trade it is on parallel channel trend support expecting a good bounce back from these levels and even SL seems to less for this trade.
