Trend Following SystemsCore Philosophy of Trend Following
At its heart, trend following is reactive, not predictive. A trend follower does not ask, “Where will the market go?” Instead, they ask, “What is the market doing right now?”
The system accepts three market truths:
Markets move in trends
Trends can last longer than logic suggests
No one can consistently predict reversals
Because of this, trend followers focus on price action rather than news, opinions, or forecasts. The market itself becomes the final authority.
What Is a Trend?
A trend is the general direction in which a market moves over time:
Uptrend: Higher highs and higher lows
Downtrend: Lower highs and lower lows
Sideways (Range-bound): No clear direction
Trend following systems are designed to profit from uptrends and downtrends, while accepting small losses during sideways markets.
Key Components of Trend Following Systems
A robust trend following system consists of four essential elements:
1. Trend Identification
This determines whether a trend exists and in which direction.
Common tools include:
Moving Averages (SMA, EMA)
Price structure (highs and lows)
Trendlines
Breakout levels
Channel indicators
The goal is not to catch the start of a trend perfectly, but to enter once the trend is confirmed.
2. Entry Rules
Entry rules define when to open a trade.
Typical entry methods:
Price crossing above/below a moving average
Moving average crossovers (e.g., 50 & 200)
Breakout above resistance or below support
Donchian channel breakouts
Entries are usually delayed by design. Trend followers willingly miss the early part of the move to reduce false signals.
3. Exit Rules
Exits are more important than entries in trend following.
There are two main exits:
Stop-loss exit: Limits downside risk
Trend exit: Signals the trend has ended
Common exit methods:
Trailing stop (ATR-based or percentage-based)
Moving average cross in the opposite direction
Break of trend structure
Volatility-based stop
Trend followers let profits run but cut losses quickly.
4. Position Sizing & Risk Management
Risk control is the backbone of trend following.
Key principles:
Risk a fixed percentage per trade (e.g., 0.5%–2%)
Use volatility-based position sizing
Never increase risk to “recover losses”
Expect multiple small losses before big winners
Trend following systems survive because losses are small and controlled, while winners are allowed to grow.
Characteristics of Trend Following Systems
1. Low Win Rate, High Reward
Trend followers often win only 30–45% of trades, but winning trades are much larger than losing ones.
This creates:
Many small losses
Few very large gains
Positive expectancy overall
2. Emotionally Challenging
Trend following tests discipline:
You enter late
You experience frequent losses
You often exit after giving back some profit
The system works only if rules are followed strictly.
3. Works Best in Trending Markets
Trend following performs exceptionally well during:
Strong bull markets
Bear markets
Crisis-driven volatility
It struggles in:
Sideways markets
Low-volatility environments
Popular Trend Following Techniques
Moving Average Systems
One of the simplest and most widely used methods.
Examples:
Price above 200 EMA → bullish
50 EMA crossing above 200 EMA → long signal
Opposite cross → exit
Simple, robust, and effective over long periods.
Breakout Systems
Based on the idea that new highs or lows indicate momentum.
Examples:
20-day high breakout → buy
20-day low breakout → sell
Exit on opposite breakout or trailing stop
Famous users include the Turtle Traders.
Channel-Based Systems
Uses price channels such as:
Donchian Channels
Keltner Channels
Bollinger Bands (trend context)
Breaks outside the channel suggest trend continuation.
Timeframes in Trend Following
Trend following works across all timeframes:
Intraday: Short trends, higher noise
Swing trading: Days to weeks
Position trading: Weeks to months
Long-term investing: Months to years
Higher timeframes tend to:
Have fewer trades
Produce stronger trends
Reduce emotional stress
Advantages of Trend Following Systems
Objective and rule-based
Works across markets and instruments
No need for prediction or fundamentals
Scales well with capital
Survives market crashes and booms
Many hedge funds and CTAs rely heavily on trend following due to its robustness.
Disadvantages and Limitations
Frequent small losses
Underperforms in sideways markets
Requires strong discipline
Psychologically uncomfortable
Late entries and exits
Trend following rewards patience, not excitement.
Psychology of Trend Following
Trend following demands a mindset opposite to most traders:
Accept being wrong often
Detach ego from predictions
Trust probabilities over outcomes
Follow rules even after drawdowns
The biggest enemy is not the market—it is rule-breaking due to emotions.
Who Should Use Trend Following?
Trend following suits traders who:
Prefer systematic trading
Can follow rules strictly
Are patient with drawdowns
Focus on long-term performance
Avoid overtrading
It is less suitable for traders who:
Need frequent wins
Trade based on intuition
Chase tops and bottoms
Conclusion
Trend Following Systems are not about forecasting the future or finding perfect entries. They are about aligning with market direction, controlling risk, and letting probabilities work over time. Though simple in concept, they are difficult in execution due to emotional challenges.
When applied with discipline, sound risk management, and consistency, trend following systems have proven their ability to survive market cycles, crises, and changing conditions—making them one of the most powerful approaches in trading history.
Trendpattern

Ingersoll Rand: When the Bullish Wedge Fails (Bearish Breakdown)The Setup Traders often look at Falling Wedges and blindly assume a bullish reversal is coming. Ingersoll Rand (NSE: INGERRAND) has just provided a textbook example of why "Assumption" is dangerous in trading.
Instead of breaking out to the upside, the price has sliced through the Lower Support Trendline on the Daily timeframe.
Technical Breakdown (The "Trap"):
Pattern Failure: The stock was forming a Falling Wedge (usually bullish). The market expected a bounce from the lower support.
The Invalidating Move: The recent heavy-volume candle breaking below the wedge support changes the structure entirely.
Psychology of the Short: Bulls who accumulated at the support line are now trapped. As their Stop Losses get hit, it creates a cascade of selling pressure (Long Liquidation).
Trade Management (Bearish):
Signal: The daily close below the wedge support (Current levels: ~3,438).
Conservative Entry: Wait for a "Retest" of the broken trendline from below (proving old support has become new resistance).
Trend Invalidation: A daily close back inside the wedge (above ~3,550). If it re-enters, the breakdown was a "Bear Trap."
Potential Target: Since this is a continuation of the downtrend, we look at the next major structural support zones (Psychological levels like 3,200 or 3,000).
Risological Note: We trade what we see, not what the textbook says should happen. A failed bullish pattern is often a stronger bearish signal than a standard downtrend.

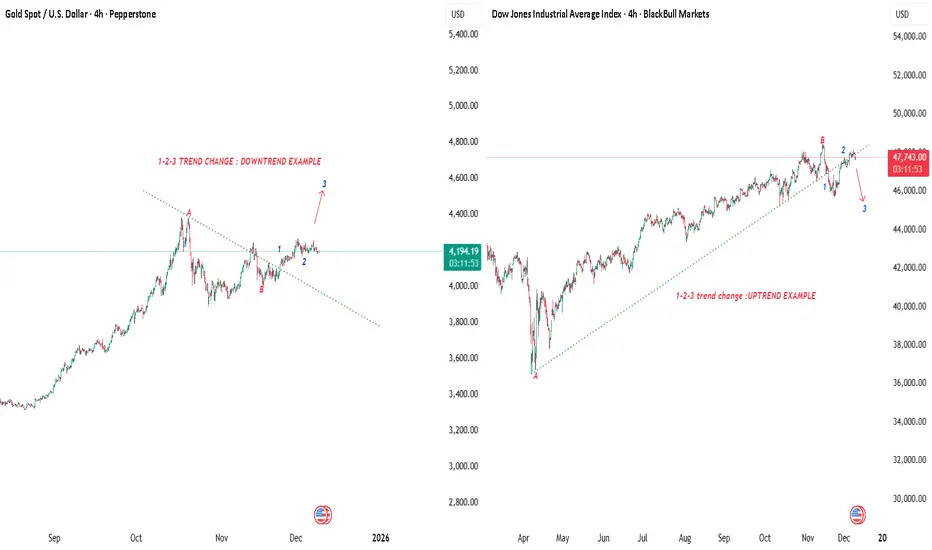
Price Action Pattern Series- 1-2-3 Trend Change Method !Starting this series with a very reliable structure-based reversal technique. The 1-2-3 method helps identify when a trend has actually changed instead of guessing bottoms or tops.
In simple terms, the trend shifts only after three structural events complete:
Sharing a simple but powerful reversal method for anyone who follows pure price structure. This technique removes the guessing part during trend shifts and keeps everything rule-based.
The method works in three steps:
Step 1: Draw a trendline from the most recent extreme high to the recent extreme low in a downtrend. The first sign of strength is when price closes above that line. This only shows the momentum is changing, not the trend.
Step 2: After the break, price usually pulls back and retests the previous low area. The retest can be slightly lower or slightly higher, but the important part is that it rejects and pushes back up, forming a higher low.
Step 3: The trend flips only when price closes above the swing high formed between the trendline break and the retest. That’s where the structure officially shifts and the market enters a new leg.
Where this method works best (timeframes)
– 15m to 1H: Perfect for intraday traders. It shows early trend shifts but with enough confirmation to avoid traps.
– 4H: Ideal for swing traders. Gives a clean, reliable trend change without noise.
– Daily: Best for bigger structural shifts. Useful for long-term direction changes and macro reversals.
– Weekly: Works, but slow. Only for big cycle traders.
When to use it
– When the market is coming out of a strong trend and you want confirmation before entering the opposite direction.
– After a large spike or news move when you want the structure to settle.
– During consolidation phases where direction is unclear.
– When you want to filter out false bottom/fake breakouts.
– When liquidity sweeps the low and you want to see if real demand steps in.
Why this method is reliable
It forces the market to:
Break momentum
Retest and hold
Break structure
Only after all three happen, the trend officially changes. It reduces emotional entries and keeps you aligned with clean structure.
This method is built on classic price-action principles seen. Sharing it purely for educational purpose as part of the price action series. More patterns will follow. Trade safe !!
NIFTY MIDCAPNIFTY MIDCAP formed with DOUBLE TOP with DIVERGENCE with first target 14,403, and next support at 13,995. If it didn't take supports at 13,995 we can see further downside with FINAL TRAGET 13,900.

XAUUSD – H4 Trend Structure Awaiting BreakoutXAUUSD – H4 Trend Structure Awaiting Breakout
Brian – Strategy to Buy on Pullback in Uptrend Channel
I. Strategy Summary
Gold continues its uptrend on H4, supported by the upward trendline from the 3,880–3,900 region.
The price is testing the resistance zone of 4,133–4,150, coinciding with the H4 supply and descending trendline, making short-term corrections likely.
Main strategy: wait for a pullback to support/FVG to buy with the trend, avoid FOMO buying at resistance.
Key levels to note: closing below 4,000 weakens the uptrend structure; below 3,884 risks shifting to a medium-term downtrend.
II. Macro Context
Unemployment Claims (weekly unemployment benefits):
Forecast: 226K
Previous: 220K
Higher-than-expected figures → indicate a weakening labor market, cooling economy, increasing the likelihood of the Fed easing sooner → real yields decrease, supporting gold.
Better-than-expected figures (lower than forecast) → support USD and bond yields, potentially causing short-term pressure on gold.
Geopolitical:
Trump's statement on easing "deadline" pressure for Russia–Ukraine negotiations ("the deadline will be when the issue is resolved") helps the market worry less about a hard deadline, but conflict risks remain. The demand for gold as a safe haven remains stable, not overly inflated but also unlikely to disappear entirely.
III. Fundamental Picture
Expectations for a rate cut cycle in 2025 continue to support gold as the market gradually prices in lower real interest rates in the medium to long term.
The demand for holding defensive assets persists amid slowing global growth and unresolved geopolitical hotspots.
In the short term, USD and US bond yields remain the two leading variables; any USD recovery can pull gold back to technical support areas, creating opportunities for buy-on-dip strategies.
IV. Technical Structure – H4 Trend Channel & FVG Zone
On H4, the price is moving within an uptrend channel, with the support trendline respected multiple times since the end of last month.
Above is the descending trendline connecting the nearest peaks, creating a price compression zone as the market approaches the 4,133–4,150 area. This is a confluence resistance zone:
The nearest swing high.
H4 supply zone.
Intersection with the descending trendline.
Notable price zones:
Resistance: 4,133–4,150 – a zone that may trigger short-term profit-taking and create a correction.
Near support/FVG: 4,078–4,080 – FVG zone combined with support after the previous breakout.
Psychological support: 4,000 – if H4 closes below this area, the uptrend structure weakens.
Medium-term reversal level: 3,884 – closing below here opens the risk of shifting entirely to a medium-term downtrend.
V. Trading Plan
Scenario 1 – Buy with the Trend (Priority)
Idea: wait for a shallow pullback to near support in the H4 uptrend channel and then buy.
Entry: 4,111–4,114
SL: 4,005
TP: 4,133 – 4,150 – 4,172 – 4,190
Scenario 2 – Buy Deep at FVG Zone
Idea: if a stronger pullback to FVG 4,078–4,080 occurs, take advantage of the good price zone to buy.
Entry: 4,078–4,080
SL: 4,073
TP: 4,100 – 4,115 – 4,142
VI. Risk Management & Notes
Limit opening new orders at the time of Unemployment Claims announcement due to potential volatility and spread widening.
If H4 closes below 4,000, reassess all current buy positions.
If H4/Daily closes below 3,884, consider the medium-term uptrend structure broken; prioritize staying out to observe or wait for a new downtrend scenario instead of continuing to look for buying points.

Bitcoin's Death Cross is Here: A crash with a message to all!BITSTAMP:BTCUSD has just delivered one of its most significant reality ✔ checks of the year — the recent crash wasn’t simply a dip; it was a multi-layered market unwind that exposes the current fragility of the crypto ecosystem.
📉 Current Bitcoin Situation: “From Euphoria to Uncertainty”
Bitcoin’s trend shifted rapidly over the past few weeks.
Spot ETFs that once fueled relentless upside have significantly slowed inflows, with some days printing net outflows as retail enthusiasm cooled and institutions trimmed exposure.
Meanwhile:
Over billions in long liquidations hit in some days.
Funding flipped aggressively negative
Sentiment turned from greed → hesitation
High beta alts saw steeper collapses, showing risk-off behavior
This wasn’t random volatility — it was a controlled flush triggered by structural weakness.
🔥 Why Bitcoin Crashed: The Real Story
🔹 Technical Factors
BTC lost a major support cluster after multiple failed attempts to hold the mid-range.
Open interest was overheated, creating the perfect setup for a liquidation cascade.
Price rejected sharply from a supply zone that aligns with the weekly imbalance.
☠️ Death Cross on Daily Time Frame: Now Confirmed
The 50 SMA crossing below the 200 SMA is not a “doom event” by itself…
But historically, Bitcoin rarely ignores this signal, especially when paired with weakening momentum and fading liquidity.
⚠ The last major Death Cross?
2022’s brutal bear continuation, which led to several months of grinding downside before any meaningful reversal.
The current structure looks uncomfortably similar:
Lower highs printing consistently
Loss of trend strength
Distribution patterns on higher time frames
Declining demand from smart money inflows
This isn’t fearmongering — it’s observation.
🔹 Fundamental + Macro Factors
ETF inflow cooldown = reduced demand pressure
Miners started selling into strength to stabilize income post-difficulty adjustment
Global markets leaned risk-off due to macro tightening
Whales began distributing quietly (confirmed by on-chain inflow spikes into exchanges)
When technical fragility meets fundamental slowdown, crashes are not accidents — they’re consequences.
🐋 Whales Are Selling: “When the quiet money moves, the market reacts loud.”
On-chain data over the last week showed:
Increase in exchange inflows from large wallets
Spot distribution from old long-term holders
ETF issuers are reducing inventory during downswings
This behavior is classic:
Whales distribute during periods of retail excitement…
Retail panics during whale exits…
And the crash becomes a self-fulfilling cycle.
📅 4–6 Week Forecast: “Chop, Pain & Opportunity”
Over the next month or so, the market will likely experience:
Sideways-to-down structure
Failed rally attempts near the 50 SMA
Whip-saw price action due to low conviction
Accumulation pockets are forming quietly
BITSTAMP:BTCUSD needs to reclaim the 50 SMA with strength before a clean trend resumes.
Until then, volatility ≠ strength.
🎯 Conclusion: Re-Investment Zones & Smart Accumulation
Crashes are emotional for most, but strategic for the prepared.
This is not a call to rush.
It’s a reminder:
Smart money enters when sentiment collapses.
Dumb money enters when sentiment peaks.
Analyze. Prepare. Don’t chase.
🧩 Comment down below 👇 and let’s talk about how to overcome it — build awareness together as traders, not competitors.
If this Idea gave you valuable information, then please boost it, and follow for more practical trading!
Happy Trading & Investing!
Team @TradeWithKeshhav ⚡

Gold is compressed; next week’s US data will pick a side.Gold is being compressed, the upcoming US data week will determine which side is squeezed.
Good evening everyone, Brian here with a view on XAUUSD on the H2 and H4 frames for the upcoming week.
Fundamental Analysis – a "tailor-made" week for the USD
Next week is packed with US data, meaning gold will react more to numbers than narratives:
Core PPI, PPI, and Retail Sales
Initial Unemployment Claims
Prelim GDP q/q
Core PCE Price Index m/m – the Fed's preferred inflation measure
If inflation and growth come out weak, the market will lean more towards the slow growth / easing policy narrative. This usually puts pressure on the USD and supports gold, especially when real yields gradually decrease.
Conversely, stronger-than-expected data will strengthen the USD, increase yields, and create short-term downward pressure on gold. In such a context, price and liquidity areas around news release times will be more important than usual – typically, fading emotional spikes back to structural areas is safer than chasing the initial move.
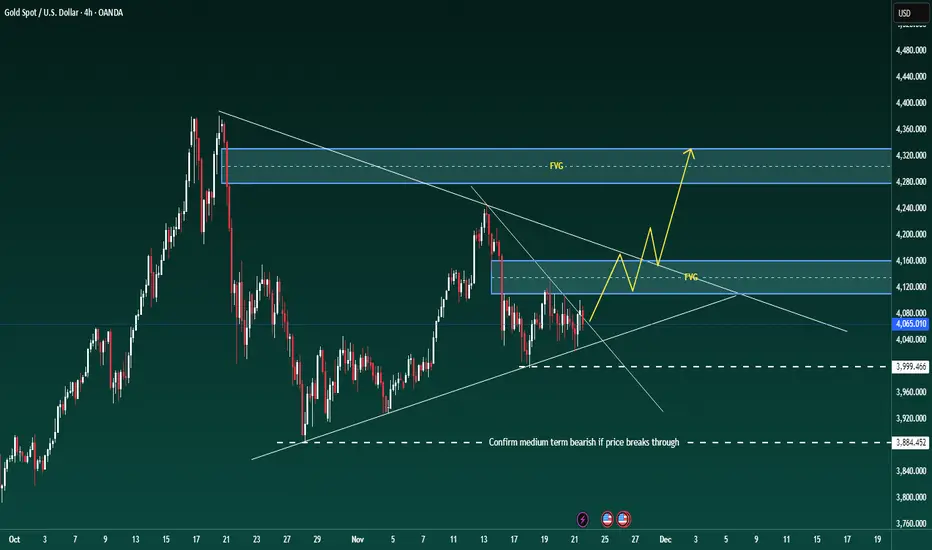
Technical Analysis – triangle, FVG, and key support areas
On the H4 frame, gold is still trading within a broad triangle structure. The previous decline has stalled, with prices continuously reacting at the upward support line and around 4,000, but there has yet to be a clear breakout from the pattern.
When zooming into H1–H2:
The price has broken a short-term downtrend line and closed strongly above – this is an early signal that selling pressure in this move is weakening.
The nearest support is around 4050–4040, deeper is the 4000–3998 support band (marked on the chart as important support). As long as it holds above 4,000, the structure remains positive.
Above, we have a very important confluence area around 4135–4160 including:
Fibo 0.382 of the most recent main decline
An old fair value gap (FVG) and resistance block
Chart note: "Gold will go strong if it passes this price range" – aligns with my view: if the price accepts above this area, the potential for a stronger upward move will open up.
Around 4100 is an area prone to "large liquidity response" – expect strong profit-taking and position restructuring if the price returns to this area.
Currently, I consider the market to be accumulating above 4,000 in a corrective pattern, with a slight upward bias as long as 4,000 is maintained.
Key Price Areas
Resistance:
4100 – first liquidity area
4135–4160 – Fibo 0.382 + FVG + strong resistance
Support:
4050–4040 – nearest intraday support
4000–3998 – large frame support; if broken, the picture changes
3940 area – stronger support if 4k is breached
Trading Scenarios for Next Week
(All are for reference only, not investment advice.)
Scenario 1 – Buy when price corrects above 4,000 (foundation for the next upward wave)
Idea: follow the forming upward bias as the price respects the triangle support and the 4,000 mark.
Entry area: 4050–4040 or any clean retest of the broken downtrend line on smaller frames
Cautious position addition area: 4025–4005 if there is a deep sweep to 4,000 with a strong bounce reaction
Stop loss: below 3990–3988 depending on risk appetite
Targets:
First: 4100 (liquidity area)
Second: 4135–4140 (lower edge of FVG/resistance)
Extended: 4155–4160 if a strong continuation move appears
Signals to wait for: wick rejections from support, bullish engulfing candles, or clear intraday structural phase shifts to higher highs and lows.
Scenario 2 – Break & Retest Long above 4135–4140
If the price doesn't give a deep correction and runs straight up:
Condition: H2/H4 candle closes clearly above 4135–4140 and holds on retest
Entry: when price pulls back in a controlled manner to the 4135–4140 area, turning this area from resistance to support
SL: below 4120
TP: 4180 → 4200+ depending on momentum strength
This is the "gold goes strong" scenario as noted on the chart – viewing the FVG/0.382 area as a launchpad for a larger impulsive upward wave.
Scenario 3 – Bearish scenario if 4,000 is broken
If fundamentals and flows turn against gold, decisively pushing the price below 4,000, the bullish view needs to be set aside.
Condition: daily candle closes clearly below 4000–3998
Plan: wait for the price to retrace up to retest 4000–4020 from below
Entry: short when rejection signals appear at that retest area
TP: 3960 → 3940, then reassess the structure
When below 4,000, the triangle will break down, and the market is likely to hunt deeper liquidity areas before potentially forming a new medium-term upward wave.
In summary: as long as 4,000 holds, I prioritize the buy scenario on corrections, respecting the upward potential to 4135–4160 and beyond. If there is a decisive break below 4,000, the picture will reverse – then retracements up will be opportunities to look for shorts.
Trade according to what the structure shows, not what I hope for. Manage risk tightly around next week's data points and let the major price areas "do the heavy lifting."
If this perspective helps you plan better, don't forget to follow Brian for weekly gold analysis and share your scenarios in the comments to compare.
STRK Wait & Watch Situation BINANCE:STRKUSDT
Trend after retracement but retracement looks weak because price break already breaks major support, but candle is not closed so, confirmation is still pending.
4H chart show channel breaks down.
That also show negativity but still day time frame is running
🧠 Always DYOR (Do Your Own Research)
⚖️ This is not financial advice or suggestion
👉 “Risk Is Real 💸 Stay Practical🚀”
💬 Please feel free to ask any questions (It's Free)

Cholamandalam Financial Holdings Ltd (CFHL) Triangle Breakout 1DCholamandalam Financial Holdings Ltd (CFHL) – Triangle Breakout & 1-Year Resistance Breakout 🚀
📊 Technical View:
CFHL has given a triangle breakout along with a 1-year resistance breakout, indicating strong bullish momentum. If Trend continues, The price action also shows a successful retest of the breakout zone, shows trend continuation.
Resistance Turned Support: ₹1650 – previously a resistance, now acting as strong support.
Current Action: Price broke above the ₹1650 range, retested the level today , and is now moving upward again.
Next Resistance Targets Levels: ₹1824 / ₹2004
Support Levels: ₹1536 / ₹1410
🏦 Company Overview:
Cholamandalam Financial Holdings Limited (CFHL), incorporated in 1949, is a part of the Murugappa Group, one of India’s most diversified business conglomerates.
CFHL is a Non-Deposit Taking Systemically Important Core Investment Company (CIC) registered with the Reserve Bank of India (RBI).
The company holds substantial investments in group companies and provides a diverse range of financial products and risk management services to individual and corporate clients through its subsidiaries and group companies.
📈 For educational purpose only. Not a buy/sell recommendation.

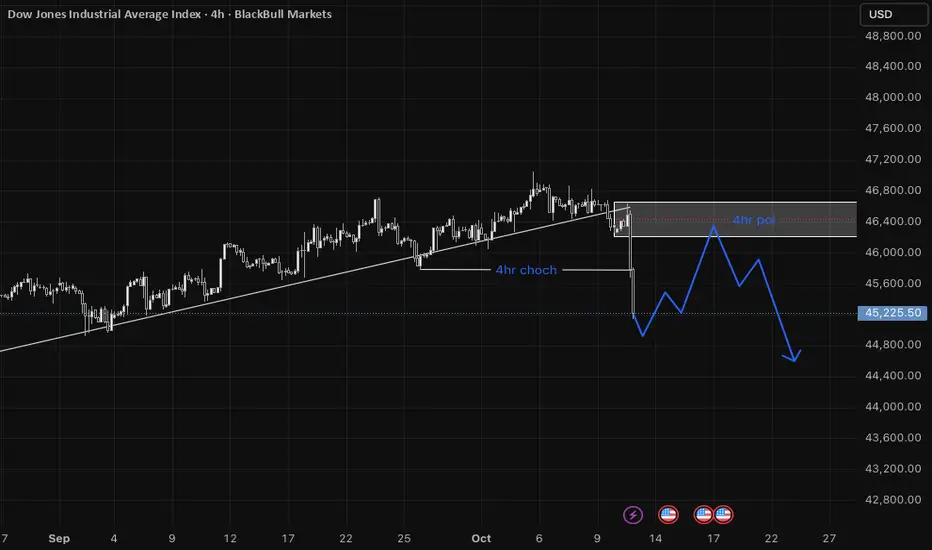
US30 | 4H–15M Bearish Confluence SetupPrice has displayed a Change of Character (ChoCH) on the 4-hour timeframe, breaking the existing bullish trendline and leaving behind a 4H imbalance. This shift indicates potential weakness in the prevailing bullish structure.
I’ll be waiting for price to retrace into the 4H imbalance zone and establish a bearish Change of Character on the 15-minute timeframe, ideally accompanied by the formation of a Fair Value Gap (FVG) or minor imbalance.
Once the 15M imbalance is retested and a bearish candlestick pattern confirms order flow alignment, a short position can be considered after a break below the low of that bearish pattern.
This setup aligns multiple timeframe confluences, reflecting a potential shift in market structure from bullish to bearish.
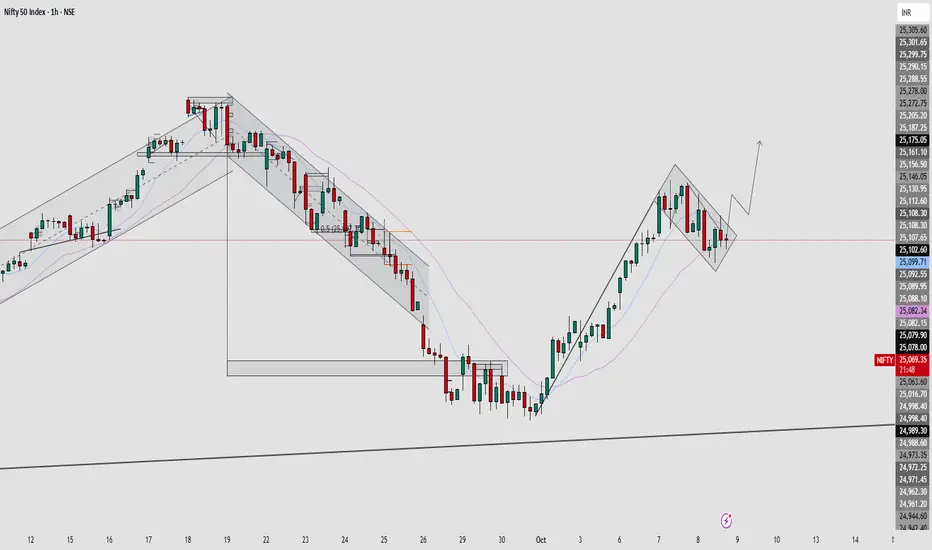
NIFTY 50 – Bullish Flag Formation | Continuation Pattern in PlayNIFTY 50 is currently forming a bullish flag pattern on the lower timeframe after a strong impulsive move to the upside.
This consolidation phase represents a healthy correction within an uptrend , indicating that bulls are likely preparing for the next breakout leg .
The structure is showing a clear flag channel , where price is respecting parallel trendlines after the strong upward impulse.
Volume is also contracting during the pullback — a typical characteristic of a flag pattern.
Key Highlights:
🚀 Strong impulsive move followed by tight consolidation (flag).
📉 Flag resistance zone: 25,130 – 25,170
📈 Breakout above this zone could trigger bullish continuation toward 25,300 – 25,400.
⚠️ Invalid if price breaks below 25,050 with strong momentum.
Trading Idea:
Wait for a clean breakout candle above the flag resistance with volume confirmation for potential long entries.
BUY TODAY SELL TOMORROW for 5%DON’T HAVE TIME TO MANAGE YOUR TRADES?
- Take BTST trades at 3:25 pm every day
- Try to exit by taking 4-7% profit of each trade
- SL can also be maintained as closing below the low of the breakout candle
Now, why do I prefer BTST over swing trades? The primary reason is that I have observed that 90% of the stocks give most of the movement in just 1-2 days and the rest of the time they either consolidate or fall
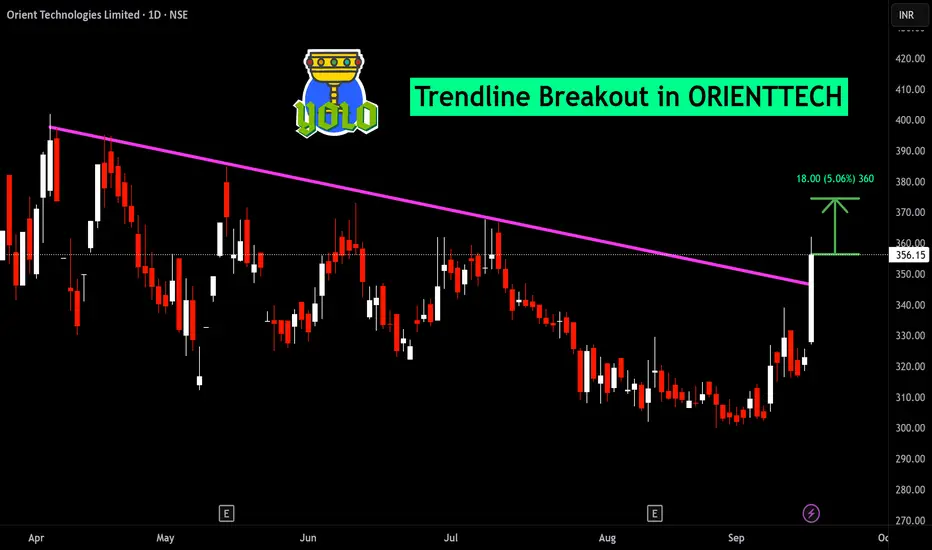
Resistance Breakout in MBLINFRA
BUY TODAY SELL TOMORROW for 5%
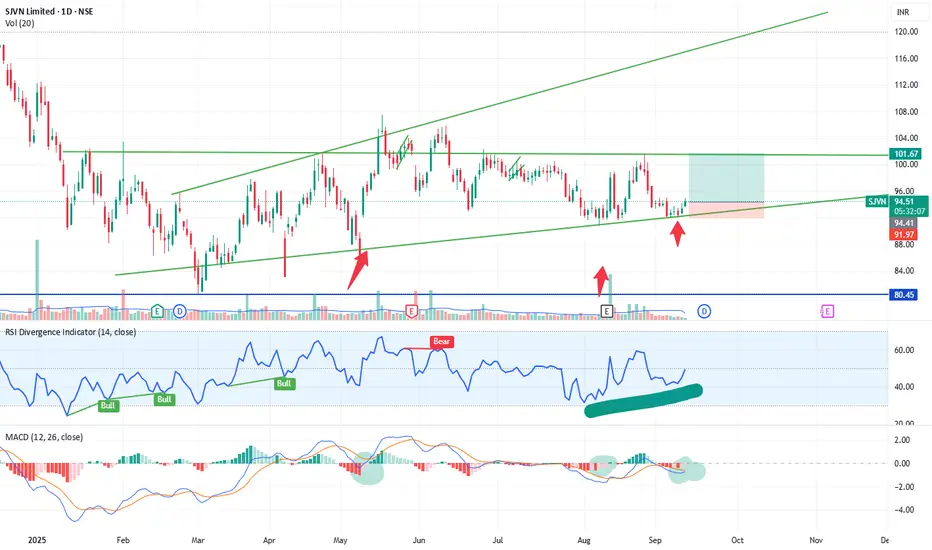
Study & Analysis: Bullish Setup in SJVN (NSE)SJVN Ltd. is showing signs of a potential bullish reversal after taking support at the lower boundary of an ascending channel. The stock has formed a consistent pattern of higher lows and is currently trading at ₹94.55 with increasing volume and positive momentum on key indicators.
✅ Key Technical Highlights:
📈 Chart Pattern:
Trading within a well-defined ascending channel.
Recently bounced off the channel support line (third touch confirmation).
Next resistance zone lies near ₹101.67, which aligns with the upper trendline and horizontal supply zone.
📊 Indicators:
RSI Divergence: Bullish divergence seen — RSI made a higher low while price made a lower low, signaling potential reversal.
MACD Bullish Crossover: MACD line has crossed above the signal line near oversold levels — historically a strong bullish sign.
Volume: Notable volume spike observed at support — indicating accumulation.
📏 Risk-Reward Zone (For Study Purposes Only):
Entry Zone: ₹93–₹95
Target: ₹101–₹102
Stop Loss: Below ₹91.97
⚠️ Note:
This post is purely for educational and analysis purposes only. It is not a recommendation to buy or sell any security. Always do your own research or consult a qualified advisor before making investment decisions.
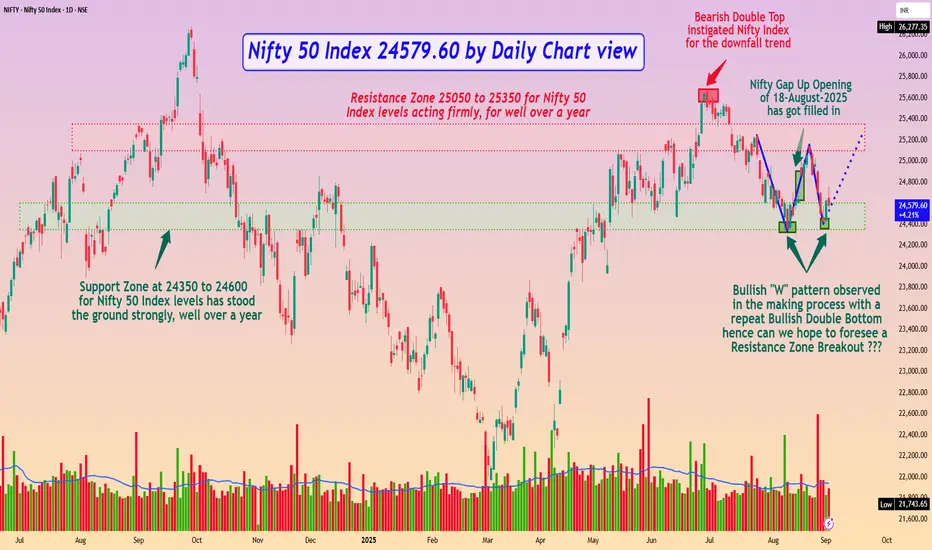
Nifty 50 Index 24579.60 by Daily Chart viewNifty 50 Index 24579.60 by Daily Chart view
- Nifty Gap Up Opening of 18-August-2025 has got filled in
- Bearish Double Top instigated Nifty Index for the downfall trend
- Resistance Zone 25050 to 25350 for Nifty 50 Index levels acting firmly, for well over a year
- Support Zone at 24350 to 24600 for Nifty 50 Index levels has stood the ground strongly, well over a year
- Bullish "W" pattern observed in the making process with a repeat Bullish Double Bottom hence can we hope to foresee a Resistance Zone Breakout ???
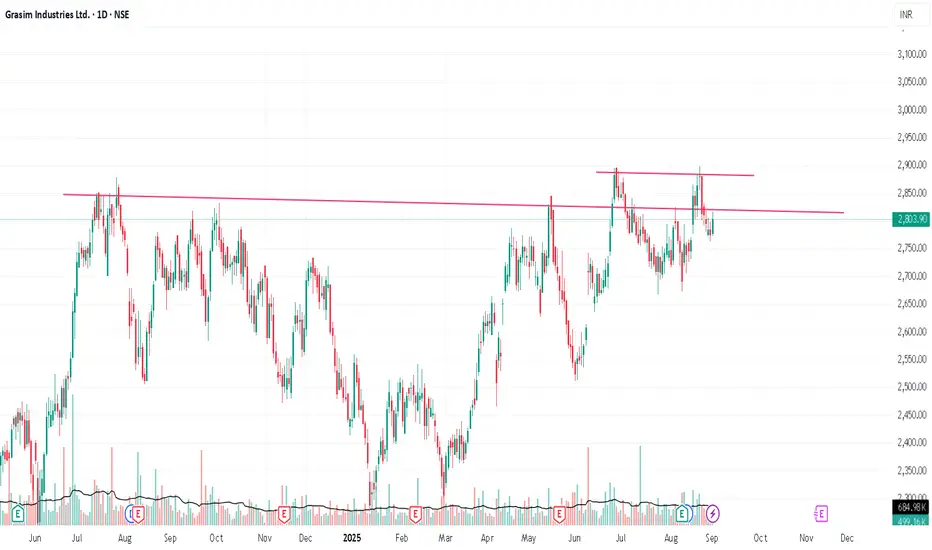
Flexing at All Time HighGrasim broke a cup & handle pattern and came down, again trying to break another trendline at top of the cup & handle pattern. if it breaks and sustain above the latest breakout with good volume, it'll move up for sure.
***This is only for educational purposes***
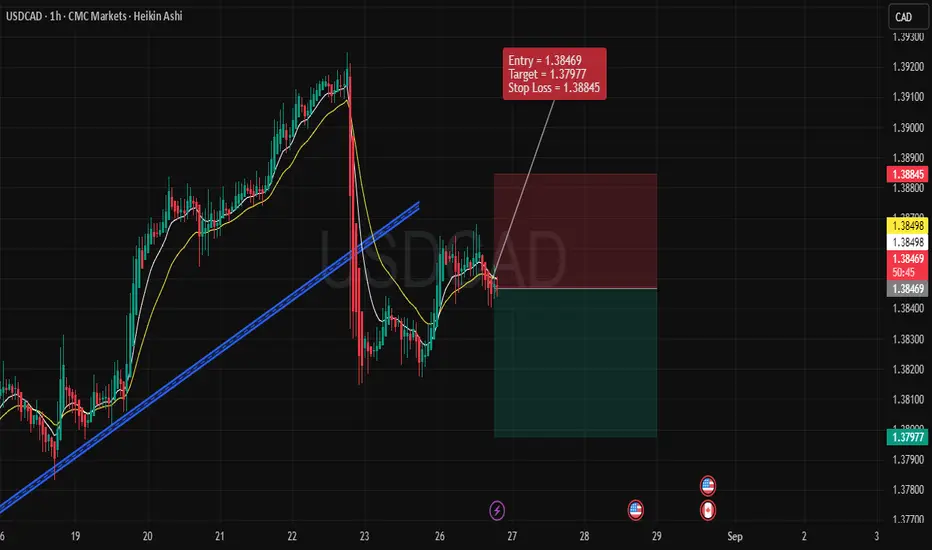
USDCAD – Bearish Trade Setup (1H Timeframe)Trade Details
Entry: 1.38469
Stop Loss: 1.38845
Target: 1.37977
🔹 Technical Reasons for Bearish Bias
Trendline Breakdown
Price recently broke below the rising trendline, indicating that the bullish momentum has weakened.
The failed retest of the broken trendline confirms bearish pressure.
Moving Averages Confirmation
The short-term moving averages (yellow lines) have crossed to the downside, aligning with bearish sentiment.
Price is trading below these moving averages, signaling sellers are in control.
Lower High Formation
After the sharp drop, the latest pullback failed to make a new higher high.
This indicates a shift from bullish structure to a bearish lower-high pattern.
Weak Recovery Attempt
The rebound after the drop is shallow and lacks strong bullish candles.
This suggests the market is unable to regain bullish momentum.
🔹 Risk Management
The Stop Loss is placed above the recent swing high (1.38845), protecting against sudden spikes.
The Target is set at 1.37977, aligning with recent support levels and offering a favorable risk-to-reward ratio.
🔹 Trade Outlook
This setup anticipates continuation of the bearish trend after the trendline break. Unless price reclaims and sustains above 1.3885, sellers remain favored in the short term. A successful breakdown could open the way for deeper downside in USDCAD.
✅ Summary:
Bearish structure confirmed by trendline break, bearish moving average alignment, and weak recovery → Entered short at 1.38469, targeting 1.37977 with stop at 1.38845.
Bearish Trade Setup for ETH/USDOverview:
The setup for this trade is based on a bearish outlook for Ethereum (ETH) against the US Dollar (USD) on the 1-hour chart. The entry, stop loss, and take profit levels are carefully defined to provide a balanced risk-to-reward ratio. Here's why this setup is a solid trade idea:
1. Trade Entry:
Entry Price: 4574.87
The entry point is set based on a recent price retracement within the prevailing downtrend. The price has shown signs of rejection from key resistance levels, and the trade is positioned to capitalize on further downside momentum.
2. Target Price:
Target Price: 4241.87
The target level is derived from technical analysis, where price is expected to move toward previous support levels, presenting a logical exit point for profits.
3. Stop Loss:
Stop Loss Price: 4741.37
The stop loss is placed above recent swing highs, ensuring the trade has enough room to breathe while minimizing the risk of false breakouts. This level is a protective measure to ensure that a reversal or unexpected price movement does not lead to unnecessary losses.
4. Risk-to-Reward Ratio:
RRR: The trade has an acceptable risk-to-reward ratio, where the potential reward outweighs the risk by more than 1:1. This is crucial for maintaining profitability over the long term.
5. Trend Analysis:
The market is currently in a bearish phase, as seen in the price action and the overall downtrend. The setup capitalizes on this momentum with a proper risk management strategy.
The use of indicators like moving averages can further confirm the downtrend, though they are not displayed here, they should align with the bearish trend.
6. Volume Confirmation:
The volume should ideally be decreasing during the retracement phase and increase during the move towards the target price, confirming the bearish continuation.
7. Conclusion:
This trade is well-positioned to take advantage of a continuation of the bearish trend. The entry, stop loss, and target are all logically placed based on key price levels and risk management principles. As always, ensure to monitor the trade, and be ready to adjust if market conditions change unexpectedly.

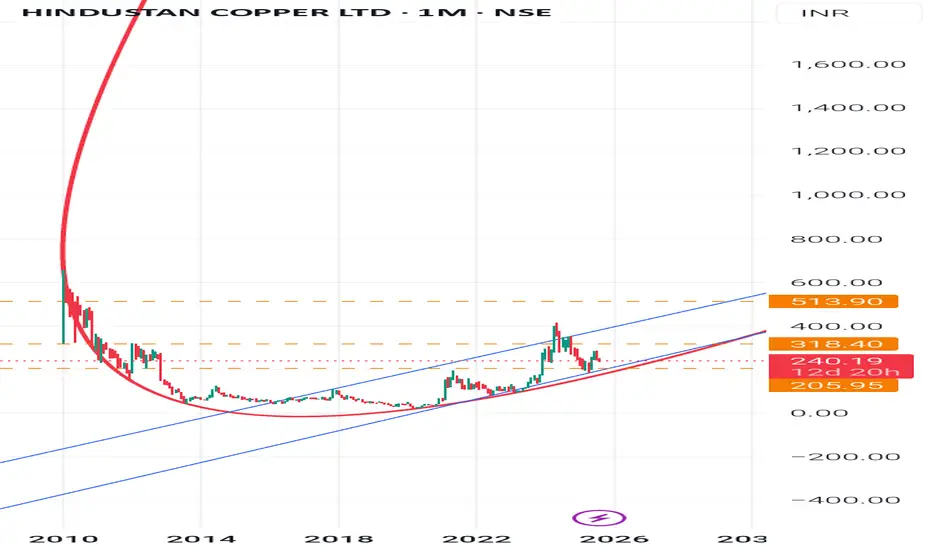
Hindustan copper Trend AnalysisHindustan Copper (HINDCOPPER) - Monthly Chart : Trend Analysis-
Long-term Trend: Strong uptrend since 2020, visible with higher highs and higher lows.
Current Position: After a sharp rally to 414, the stock corrected and is now consolidating around 280.
200-Month MA (red curve): Acts as a strong long-term support trendline.
Chart Pattern👉
Cup & Handle Formation: The stock formed a long cup (2010-2020) and has broken out. Now it is forming a handle/consolidation phase.
Rising Channel: Price is moving inside an upward channel (blue lines).
Support Levels
1. 240 - Strong immediate support (monthly close basis).
2. 205 - Next strong support (channel + trendline confluence).
3. 165- Major base (only if bigger correction comes).
📈 Resistance Levels
1. 318- First hurdle (recent swing high).
2. 414- Previous top, very important resistance.
3. 513- Long-term target zone shown on your chart.
🚀 Next Big Leap🎯
If stock sustains above 318, momentum buying can take it back toward 414.
A monthly close above 414 will confirm a fresh breakout, next big target opens to 513-550 zone.
In the longer run (2-3 years), if 513 is crossed and sustained, stock could head towards 750+.
Risk Note:
Below 240 on monthly close- weakness.
Below 205- trend reversal risk (long-term investors must watch this level closely).
Summary:
Hindustan Copper is in a long-term bullish structure. It is currently consolidating in a handle phase between 240-318. A breakout above 318 can lead to a retest of 414, and then a big move towards 513+. Long-term investors should stay put as long as 205 support holds.
Disclaimer-
This analysis is only for educational and learning purposes.
It is not an investment or trading advice.
Stock market investing is risky- please consult a SEBI-registered financial advisor before making any decisions.
#StockMarket #TechnicalAnalysis #PriceAction
Part1 Ride The Big MovesUnderstanding Greeks (The DNA of Options Pricing)
Delta – How much the option price changes per ₹1 move in stock.
Gamma – How fast delta changes.
Theta – Time decay rate.
Vega – Sensitivity to volatility changes.
Rho – Interest rate sensitivity.
Mastering the Greeks means you understand why your option is moving, not just that it’s moving.
Common Mistakes to Avoid
Holding OTM options too close to expiry hoping for a miracle.
Selling naked calls without understanding unlimited risk.
Over-leveraging with too many contracts.
Ignoring commissions and slippage.
Not adjusting positions when market changes.

Hero moto corp: Long view to 5500Hero moto has given a break out from its levels of consolidation:
Next important levels on the chart can be seen as:
Support: 4350
Resistance : 4660, 5000, 5500
It's only for learning purpose.
Thanks.

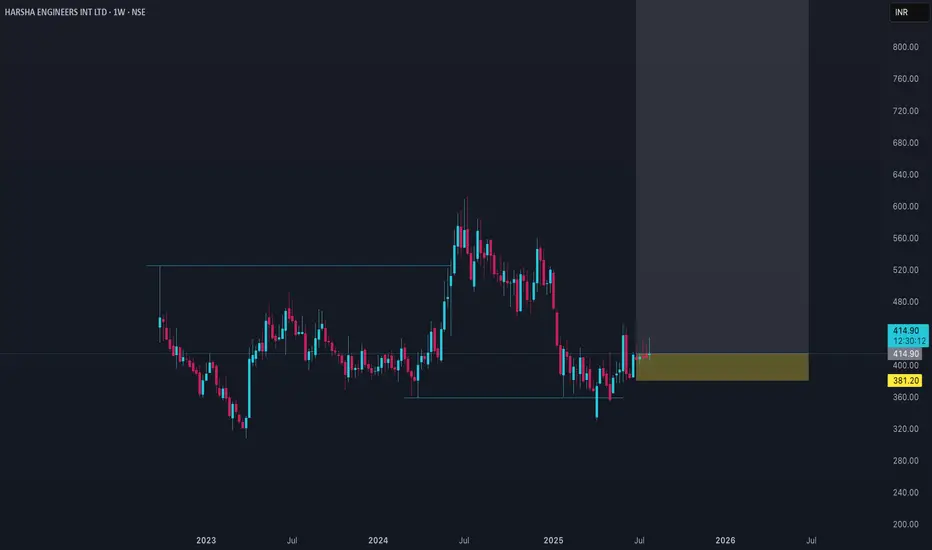
HARSHA Price ActionHarsha Engineers International Ltd is trading around ₹414 as of early August 2025. The stock has seen a modest increase of about 3% over the past six months but a significant decline of roughly 23% over the past year. The 52-week price range is wide, with a low near ₹330 and a high close to ₹584, indicating notable price volatility.
Valuation-wise, the stock trades at a price-to-earnings ratio around 35 and a price-to-book ratio near 0.33 to 3.1 depending on sources, reflecting mixed signals; the low book value multiple might suggest undervaluation relative to its assets, while the P/E suggests reasonable earnings expectations. The company has a market capitalization near ₹3,770 crore.
Financially, Harsha Engineers has delivered poor sales growth of under 10% over the past five years, which may have contributed to the recent price softness. Dividend announcements have been made recently, providing some income to shareholders. The stock’s mid-term outlook appears cautious with moderate price movement and valuation reflecting both risks from muted growth and some stability in fundamentals.
In summary, Harsha Engineers currently trades at a level indicating some undervaluation on a book value basis, but the stock price reflects concerns about slow growth and past volatility. Investors should weigh the company’s solid asset base against subdued sales growth and potential market fluctuations when considering the stock.
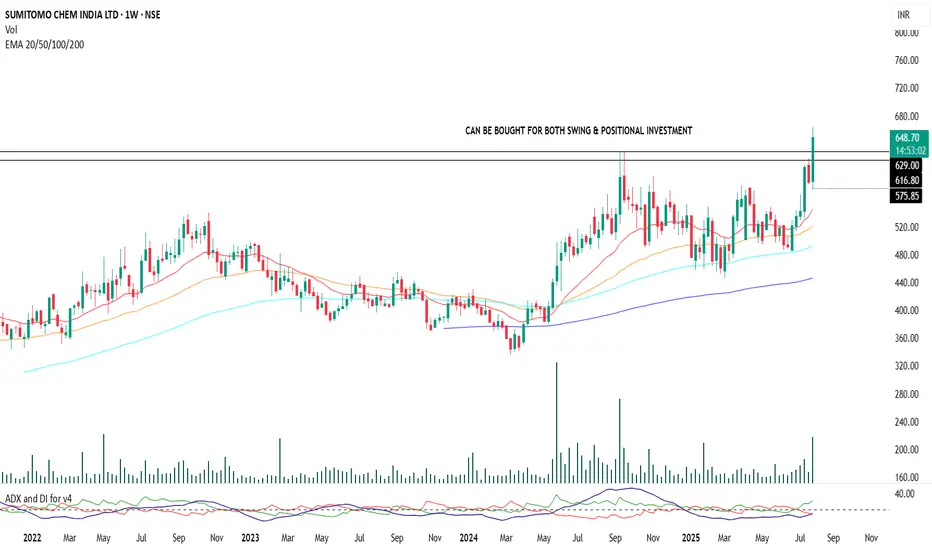
Sumitomo Chemical | Positional Swing Setup with Dynamic SLA strong setup is forming in Sumitomo Chemical with bullish c price action and trend indicators. Entry can be been initiated at current levels with small quantity with a stop-loss placed at ₹570 on a weekly closing basis.
No fixed targets. This is a trailing stop-loss-based position aimed at capturing a sustained trend move.
Add-on Zone: If the price retests the support near the ₹630 level (previous structure/support), more quantity will be added as part of a pyramiding strategy, provided broader market structure remains bullish.
Indicators Used for Trailing SL & Confirmation:
ADX & DI , RSI Levels
Exit Criteria:
Weekly close below ₹570 (hard stop)
Note: This is a disciplined, structure-based swing trade with optional pyramiding. Avoid impulsive exits; trail stop-losses logically based on trend indicators.
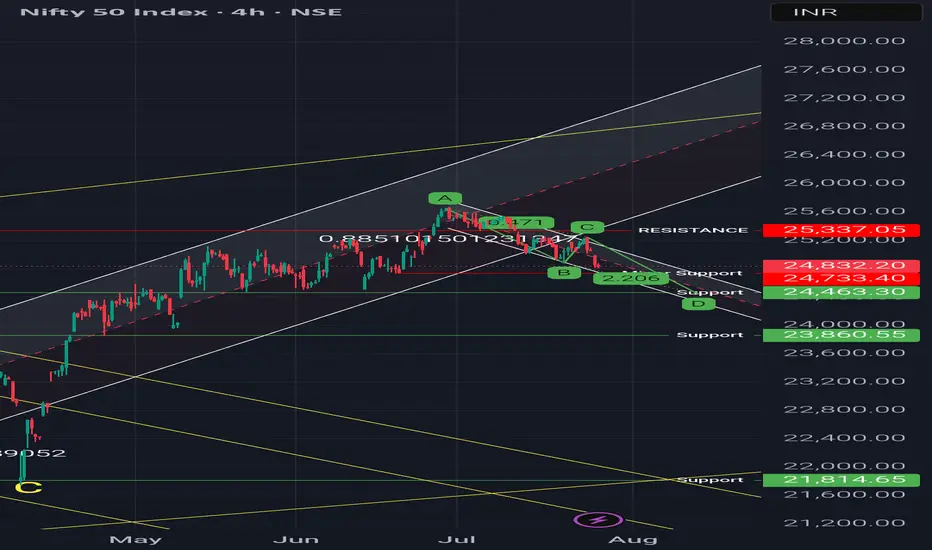
Regression channel & Harmonic pattern - Short term bearish trendObservations:
1. It is short term bearish trend as long as price holds above 24400
2. Price is below 50 DEMA
Possible Scenarios:
1. Price may attempt a mean reversion toward the median line of the channel
2. A break above could retest the 25,240–25,337 resistance zone, up move can only be considered when weekly candle will closed above that level because on weekly time frame there is 4 crows formation.
3. Harmonic patterns (1:1) suggests, the level of 24470 Support level in coming 10-15 trading days.